. 2022 Aug 4;13(8):674.
doi: 10.1038/s41419-022-05131-x.

Ca2+ homeostasis maintained by TMCO1 underlies corpus callosum development via ERK signaling

Affiliations

Ca2+ homeostasis maintained by TMCO1 underlies corpus callosum development via ERK signaling

Ke-Yan Yang et al. Cell Death Dis. .

Abstract

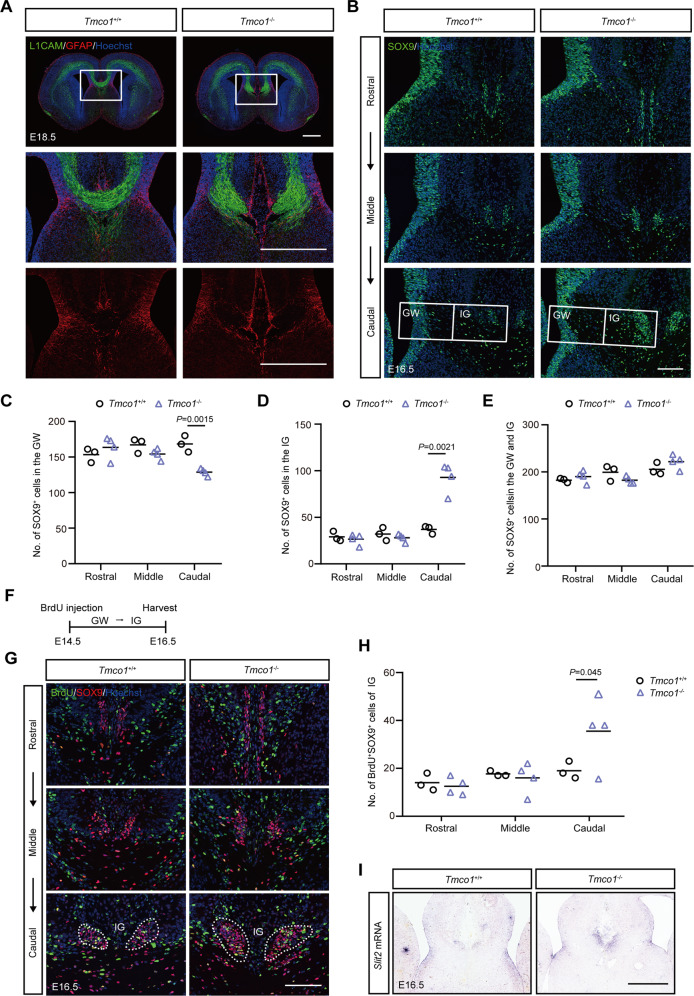
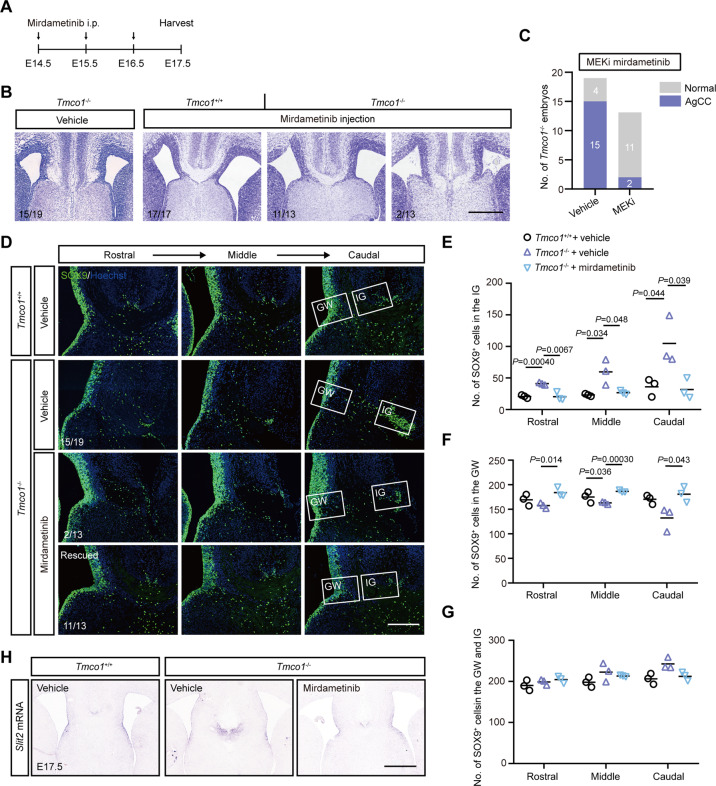
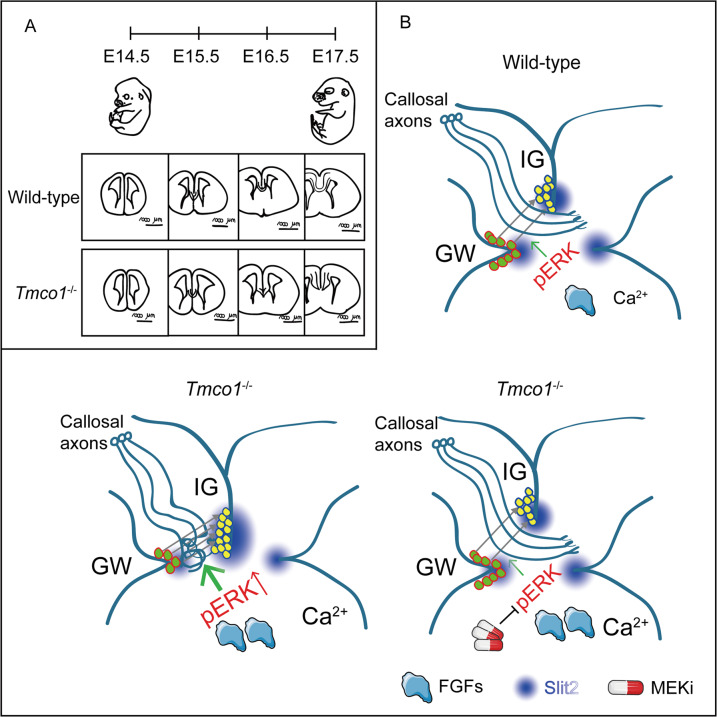
Transmembrane of coiled-coil domains 1 (TMCO1) plays an important role in maintaining homeostasis of calcium (Ca2+) stores in the endoplasmic reticulum (ER). TMCO1-defect syndrome shares multiple features with human cerebro-facio-thoracic (CFT) dysplasia, including abnormal corpus callosum (CC). Here, we report that TMCO1 is required for the normal development of CC through sustaining Ca2+ homeostasis. Tmco1-/- mice exhibit severe agenesis of CC with stalled white matter fiber bundles failing to pass across the midline. Mechanistically, the excessive Ca2+ signals caused by TMCO1 deficiency result in upregulation of FGFs and over-activation of ERK, leading to an excess of glial cell migration and overpopulated midline glia cells in the indusium griseum which secretes Slit2 to repulse extension of the neural fiber bundles before crossing the midline. Supportingly, using the clinical MEK inhibitors to attenuate the over-activated FGF/ERK signaling can significantly improve the CC formation in Tmco1-/- brains. Our findings not only unravel the underlying mechanism of abnormal CC in TMCO1 defect syndrome, but also offer an attractive prevention strategy to relieve the related agenesis of CC in patients.


Conflict of interest statement

The authors declare no competing interests.

Figures

Fig. 1
Fig. 1. Defects in the formation of the corpus callosum and hippocampal commissure in developing brains of Tmco1−/− mice.
A Nissl staining of coronal sections of Tmco1+/+ and Tmco1−/− brains at E18.5. Lower panels, high magnification of the areas boxed in the upper. Arrow indicates the agenesis of the corpus callosum (AgCC) in Tmco1−/− brains. Scale bar, 500 μm. B H&E staining of coronal sections of Tmco1+/+ and Tmco1−/− brains at 3 months old. Arrow indicates the abnormal corpus callosum in Tmco1−/−. Scale bar, 1000 μm. C Quantification of the number of pups with the AgCC phenotype in Tmco1+/+ and Tmco1−/−. Gray indicates normal CC while purple indicates AgCC. D L1CAM immunofluorescence (green) in Tmco1+/+ and Tmco1−/− embryos at E18.5 in rostral and caudal coronal sections showing the developing CC region, hippocampal commissure and anterior commissure. High magnification of the areas boxed are shown on the right. Arrow indicates the AgCC. Scale bar, 200 μm. CC corpus callosum, HC hippocampal commissure, AC anterior commissure. E Callosal axons projection pattern monitored by DiI crystals (red), which was injected in the cortex of one hemisphere and allowed to diffuse via callosal axons to the contralateral hemisphere in P7 Tmco1+/+ or Tmco1−/− mice. Scale bar, 500 μm. Arrow, the correctly projected callosal axons to the contralateral hemisphere in Tmco1+/+; arrowhead, Probst bundles formed in Tmco1−/−. LV lateral ventricle. See also Fig. S1.
Fig. 2
Fig. 2. TMCO1 deficiency increases the migration of glial cells from the GW to the IG.
A Upper: Immunofluorescence for the axonal marker LICAM (green) and the glial marker GFAP (red) in coronal sections of Tmco1+/+ and Tmco1−/− embryonic brains at E18.5. High magnification of the midline area (white box) is shown in lower panels. Scale bar, 500 μm. B SOX9 immunofluorescence (green) at the telencephalic midline in Tmco1+/+ and Tmco1−/− embryonic brains in rostral, middle and caudal coronal sections through the developing CC region. Scale bar, 100 μm. GW glia wedge, IG indusium griseum. CE The counts of SOX9-positive cells in the GW (C), IG (D) and GW + IG (E). Tmco1+/+, n = 3; Tmco1−/−, n = 4. Two-tailed unpaired Student’s t test. F The timeline of the experiment for SOX9 immunostaining after BrdU injection. G BrdU (green) and SOX9 (red) co-immunofluorescence at the telencephalic midline of Tmco1+/+ and Tmco1−/− embryonic brains at E16.5 after a single BrdU administration at E14.5. Scale bar, 100 μm. IG indusium griseum. (H) Quantification of the number of BrdU+SOX9+ cells at the IG in Tmco1+/+ and Tmco1−/− midline. Tmco1+/+, n = 3; Tmco1−/−, n = 4. Two-tailed unpaired Student’s t test. (I) In situ hybridization for the expression of Slit2 in coronal sections from Tmco1+/+ and Tmco1−/− E16.5 embryos. Scale bar, 500 μm. See also Figs. S2 and S3.
Fig. 3
Fig. 3. TMCO1 depletion upregulates FGF8/17 and over-activates ERK signaling in the Tmco1 mutants.
A Immunofluorescence of the factors required for the formation of commissural plate and corticoseptal boundary (ZIC2, GLI3, NFIA) in E15.5 brains of Tmco1+/+ and Tmco1−/−. Scale bar, 200 μm. B, C In situ hybridization analyses of Fgf8 (B) and Fgf17 (C) in E13.5 and E16.5 brains of Tmco1+/+ and Tmco1−/−. Scale bar, 500 μm. D qRT-PCR analysis of Tmco1, Fgf8 and Fgf17 expression in the E16.5 rostral-medial telencephalons of Tmco1+/+ and Tmco1−/−. Tmco1+/+, n = 3; Tmco1−/−, n = 4. Two-tailed unpaired Student’s t test. E Western-blotting analysis of FGF8 extracted from E16.5 rostral-medial brains of Tmco1+/+ and Tmco1−/−. GAPDH is used as a loading control. Right panel, Relative quantification of western blotting analysis of FGF8 protein levels in the rostral-medial brain of Tmco1+/+ and Tmco1−/−. Data is represented as the mean protein intensity normalized to GAPDH. Tmco1+/+, n = 3; Tmco1−/−, n = 3. Two-tailed unpaired Student’s t test. F Western-blotting analysis of FGF17 extracted from E16.5 rostral-medial brains of Tmco1+/+ and Tmco1−/−. Actin is used as a loading control. Lower panel, Relative quantification of western blotting analysis of FGF17 protein levels in the rostral-medial brain of Tmco1+/+ and Tmco1−/−. Data is represented as the mean protein intensity normalized to Actin. Tmco1+/+, n = 3; Tmco1−/−, n = 3. Two-tailed unpaired Student’s t test. G The expression of Fgf8 and Fgf17 were up-regulated in TMCO1 deficient cells in a Ca2+-dependent manner. qRT-PCR analysis of Fgf8 and Fgf17 expression in the wild-type (WT) or Tmco1-KD HeLa cells treated with/without 50 or 100 μM BAPTA-AM. One-way ANOVA with Tukey’s correction for multiple comparisons. (H) pERK1/2 immunohistochemistry on E16.5 coronal sections from Tmco1+/+ and Tmco1−/− brains. Arrows, pERK1/2-positive cells in GW. Arrowheads, pERK1/2-positive cells in IG. High magnification of the areas boxed are shown in lower panels. Scale bar, 500 μm. I Western-blotting analysis of proteins extracted from E16.5 whole telencephalons of Tmco1+/+ and Tmco1−/−. Right panel, relative quantification of western blotting analysis of pERK/ERK in the telencephalons of Tmco1+/+ and Tmco1−/−. Tmco1+/+, n = 3; Tmco1−/−, n = 3. Two-tailed unpaired Student’s t test.
Fig. 4
Fig. 4. TMCO1 deficiency causes overactive ERK signaling upon FGFs stimulation, which related to supernormal Ca2+ signaling in vitro.
A Fura-2 ratio (340/380) was used to indicate the cytosolic Ca2+ concentration. Images show Fura-2 340/380 ratios in wild-type (WT) and Tmco1-knockdown (KD) HeLa cells. The pseudo-color calibration scale for 340/380 ratio is shown on the right. Ratios are recorded for 50 ng/ml FGF8b stimulation (upper panel) or FGF17 stimulation (lower panel) in WT and Tmco1 KD HeLa cells. Upper panel, 340/380 ratio images are shown for cells 30 s before, and 210 s, 360 s, 450 s, 600 s, 750 s, 1020 s and 1110 s after stimulation of 50 ng/ml FGF8b. Lower panel are shown for cells 30 s before, and 150 s, 200 s, 300 s, 360 s, 480 s, 600 s and 810 s after stimulation of 50 ng/ml FGF17. Scale bar, 20 μm. B, C FGF8b (B) and FGF17 (C) -evoked Ca2+ transients in WT and Tmco1-KD HeLa cells in HBSS medium. Compared to WT cells, Tmco1-KD cells exhibit supernormal Ca2+ signaling with more Ca2+ spikes and higher Ca2+ spike amplitudes. D Western-blotting analysis of proteins extracted from WT or Tmco1-KD HeLa cells treated with/without 50 μM BAPTA-AM. β-tubulin is used as a loading control. The relative expression of pERK/ERK is shown in lower panel. n = 3. One-way ANOVA with Tukey’s correction for multiple comparisons. E, F Western-blotting analysis of proteins extracted from WT or Tmco1-KD HeLa cells treated with FGF8b (E) or FGF17 (F) together with/without 50 μM BAPTA-AM. β-tubulin is used as a loading control. The relative expression of pERK/ERK is shown in right panel. n = 3. One-way ANOVA with Tukey’s correction for multiple comparisons.
Fig. 5
Fig. 5. The phenotype of AgCC can be efficiently relieved by MEK inhibitor - mirdametinib.
A The timeline of mirdametinib injection, which was administrated to pregnant females daily between E14.5 and E16.5 spanning the period of CC formation and harvested at E17.5. B Nissl staining of the coronal sections in the Tmco1+/+ and Tmco1−/− treated with/without mirdametinib. Numbers at the bottom left indicate the proportions of embryonic brains with phenotype shown in that panel. Scale bar, 500 μm. C Quantification of the number of Tmco1−/− embryos showing normal or AgCC phenotypes with/without mirdametinib treatment (i.p., 3.0 mg/kg). Vehicle-injected pregnant females, n = 12; mirdametinib-injected pregnant females, n = 10. D SOX9 immunofluorescence (green) at the telencephalic midline in Tmco1+/+ and Tmco1−/− E17.5 embryos treated with/without mirdametinib in rostral, middle and caudal coronal sections through the developing CC region. Numbers at the bottom left indicate the proportions of embryos with phenotype shown in that panel. Scale bar, 200 μm. EG The counts of SOX9-positive cells in the GW (E), IG (F) and GW + IG (G). The vehicle group: Tmco1+/+, n = 3; Tmco1−/−, n = 3; the mirdametinib-treated group: Tmco1−/−, n = 3 (2/3 rescued and 1/3 not fully recovered). One-way ANOVA with Tukey’s correction for multiple comparisons. H In situ hybridization for the expression of Slit2 in the IG of coronal sections from E17.5 Tmco1+/+ and Tmco1−/− embryos treated with/without mirdametinib. Scale bar, 500 μm. See also Fig. S4.
Fig. 6
Fig. 6. Model for TMCO1 deficiency-induced agenesis of corpus callosum (AgCC) and MEKi-restored corpus callosum (CC) formation.
A The Tmco1−/− brains exhibit severe CC defect during E14.5-E17.5. B Compared to wild-type embryonic brains with normal CC extension (B, upper right), the abnormal Ca2+ homeostasis induced by TMCO1 deficiency leads to supernormal Ca2+ signaling, over-activation of the FGF/ERK signaling at the midline, excessive migration of glial cells from GW to IG, and overpopulation of glial cells in the IG (B, lower left). Then the robust Slit2 signals secreted by IG glial cells repulse the callosal axon navigation before crossing the midline, leading to a halted extension of callosal axons and severe AgCC (B, lower left). Clinical MEK inhibitors efficiently reduce the excessive migration of glial cells from GW to IG, rebuild the Slit2 gradient balance between GW to IG, and restore the normal CC extension across the midline in Tmco1−/− brains (lower right). These findings highlight a novel role of Ca2+ homeostasis maintained by TMCO1 in orchestrating the midline glial structure and CC formation during embryonic neurodevelopment, and provide a promising prevention strategy to relieve the related AgCC in patients.

Similar articles

Cited by

References

    1. Tomasch J. Size, distribution, and number of fibres in the human corpus callosum. Anat Rec. 1954;119:119–35. doi: 10.1002/ar.1091190109. - DOI - PubMed
    1. Bloom JS, Hynd GW. The role of the corpus callosum in interhemispheric transfer of information: excitation or inhibition? Neuropsychol Rev. 2005;15:59–71. doi: 10.1007/s11065-005-6252-y. - DOI - PubMed
    1. Gerhard B, Elżbieta P-P, Richard B, Iris U, Giorgi K. Corpus callosum and epilepsies. J Epileptol. 2013;21:89–104. doi: 10.1515/joepi-2015-0008. - DOI
    1. Glass HC, Shaw GM, Ma C, Sherr EH. Agenesis of the corpus callosum in California 1983-2003: a population-based study. Am J Med Genet A. 2008;146A:2495–500. doi: 10.1002/ajmg.a.32418. - DOI - PMC - PubMed
    1. Bang M, Eom J, An C, Kim S, Park YW, Ahn SS, et al. An interpretable multiparametric radiomics model for the diagnosis of schizophrenia using magnetic resonance imaging of the corpus callosum. Transl Psychiat. 2021;11:462. doi: 10.1038/s41398-021-01586-2. - DOI - PMC - PubMed

Publication types

Substances