

Pan-African genome demonstrates how population-specific genome graphs improve high-throughput sequencing data analysis
- PMID: 35927245
- PMCID: PMC9352875
- DOI: 10.1038/s41467-022-31724-3
Pan-African genome demonstrates how population-specific genome graphs improve high-throughput sequencing data analysis
Abstract
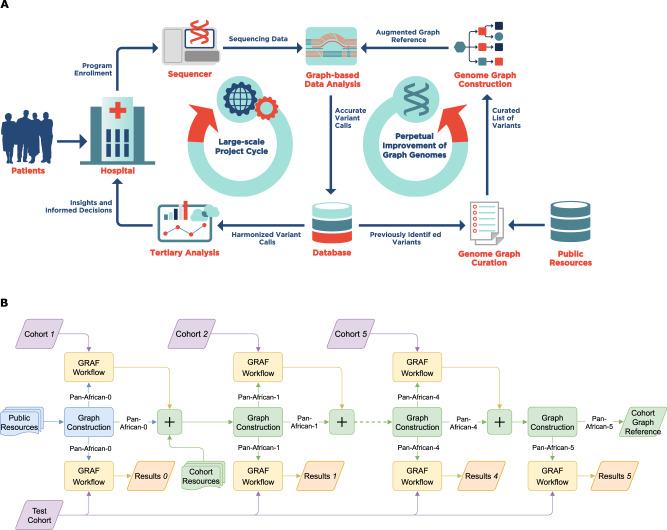
Graph-based genome reference representations have seen significant development, motivated by the inadequacy of the current human genome reference to represent the diverse genetic information from different human populations and its inability to maintain the same level of accuracy for non-European ancestries. While there have been many efforts to develop computationally efficient graph-based toolkits for NGS read alignment and variant calling, methods to curate genomic variants and subsequently construct genome graphs remain an understudied problem that inevitably determines the effectiveness of the overall bioinformatics pipeline. In this study, we discuss obstacles encountered during graph construction and propose methods for sample selection based on population diversity, graph augmentation with structural variants and resolution of graph reference ambiguity caused by information overload. Moreover, we present the case for iteratively augmenting tailored genome graphs for targeted populations and demonstrate this approach on the whole-genome samples of African ancestry. Our results show that population-specific graphs, as more representative alternatives to linear or generic graph references, can achieve significantly lower read mapping errors and enhanced variant calling sensitivity, in addition to providing the improvements of joint variant calling without the need of computationally intensive post-processing steps.
© 2022. The Author(s).
Conflict of interest statement
All authors have been employed by Seven Bridges Genomics Inc. during this study.
Figures


Similar articles
-
Fast and accurate genomic analyses using genome graphs.Nat Genet. 2019 Feb;51(2):354-362. doi: 10.1038/s41588-018-0316-4. Epub 2019 Jan 14. Nat Genet. 2019. PMID: 30643257
-
NovoGraph: Human genome graph construction from multiple long-read de novo assemblies.F1000Res. 2018 Sep 3;7:1391. doi: 10.12688/f1000research.15895.2. eCollection 2018. F1000Res. 2018. PMID: 30613392 Free PMC article.
-
Enhancing SNV identification in whole-genome sequencing data through the incorporation of known genetic variants into the minimap2 index.BMC Bioinformatics. 2024 Jul 13;25(1):238. doi: 10.1186/s12859-024-05862-y. BMC Bioinformatics. 2024. PMID: 39003441 Free PMC article.
-
Genome graphs and the evolution of genome inference.Genome Res. 2017 May;27(5):665-676. doi: 10.1101/gr.214155.116. Epub 2017 Mar 30. Genome Res. 2017. PMID: 28360232 Free PMC article. Review.
-
A beginners guide to SNP calling from high-throughput DNA-sequencing data.Hum Genet. 2012 Oct;131(10):1541-54. doi: 10.1007/s00439-012-1213-z. Epub 2012 Aug 11. Hum Genet. 2012. PMID: 22886560 Review.
Cited by
-
A Pangenomic Approach to Improve Population Genetics Analysis and Reference Bias in Underrepresented Middle Eastern and Horn of Africa Populations.Biomolecules. 2025 Apr 15;15(4):582. doi: 10.3390/biom15040582. Biomolecules. 2025. PMID: 40305331 Free PMC article.
-
Pangenome graphs and their applications in biodiversity genomics.Nat Genet. 2025 Jan;57(1):13-26. doi: 10.1038/s41588-024-02029-6. Epub 2025 Jan 8. Nat Genet. 2025. PMID: 39779953 Review.
-
Accurate human genome analysis with element avidity sequencing.BMC Bioinformatics. 2025 Jul 25;26(1):194. doi: 10.1186/s12859-025-06191-4. BMC Bioinformatics. 2025. PMID: 40713517 Free PMC article.
-
Phased genome assemblies and pangenome graphs of human populations of Japan and Saudi Arabia.Sci Data. 2025 Aug 12;12(1):1316. doi: 10.1038/s41597-025-05652-y. Sci Data. 2025. PMID: 40796583 Free PMC article.
-
Personalizing medicine in Africa: current state, progress and challenges.Front Genet. 2023 Sep 19;14:1233338. doi: 10.3389/fgene.2023.1233338. eCollection 2023. Front Genet. 2023. PMID: 37795248 Free PMC article. Review.
References
-
- E pluribus unum. Nat. Methods7, 331 (2010). - PubMed
Publication types
MeSH terms
Grants and funding
LinkOut - more resources
Full Text Sources
Other Literature Sources
