. 2022 Jun 6;8(1):7.
doi: 10.1038/s41514-022-00087-w.

Free-living wrist and hip accelerometry forecast cognitive decline among older adults without dementia over 1- or 5-years in two distinct observational cohorts

Affiliations

Free-living wrist and hip accelerometry forecast cognitive decline among older adults without dementia over 1- or 5-years in two distinct observational cohorts

Chengjian Shi et al. NPJ Aging. .

Abstract

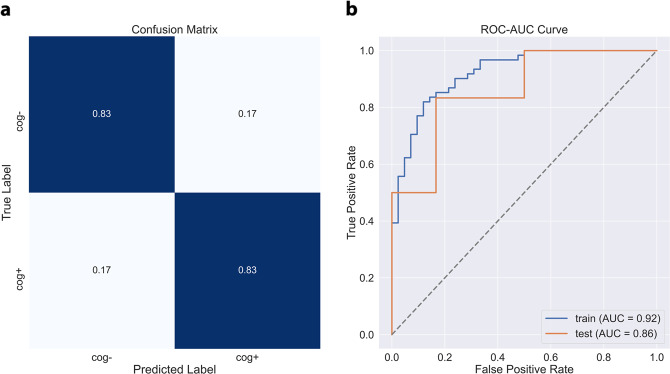
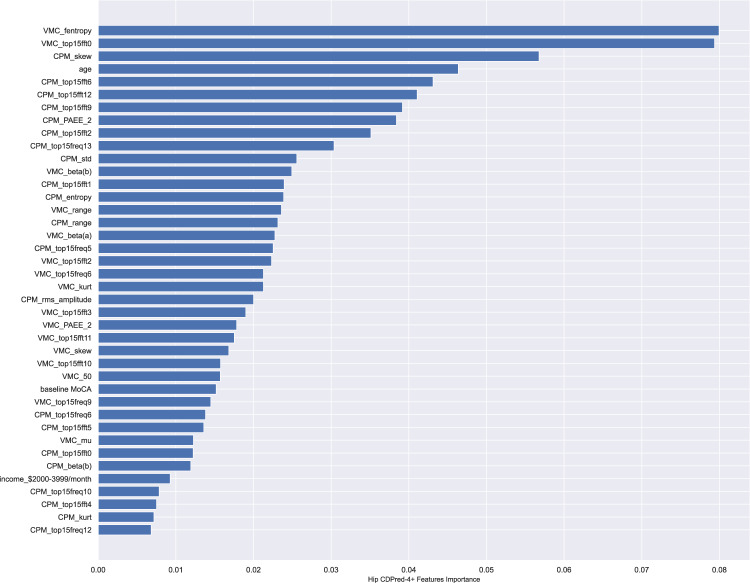
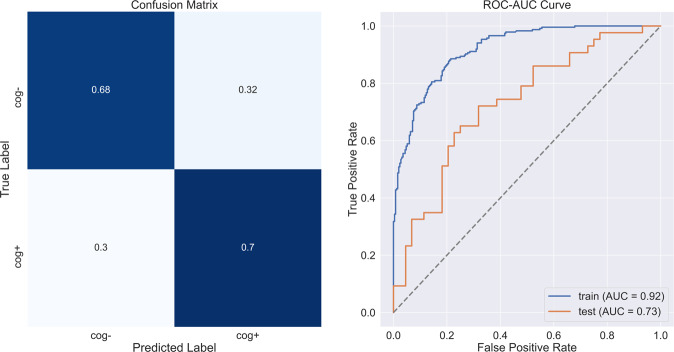
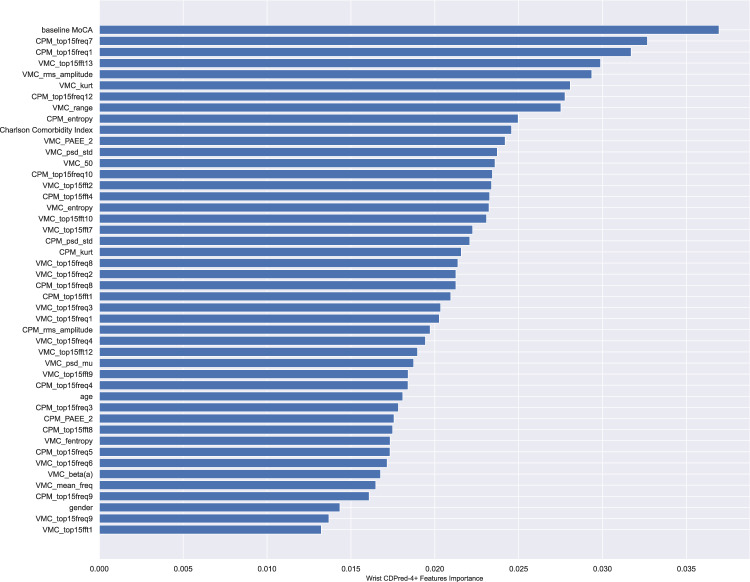
The prevalence of major neurocognitive disorders is expected to rise over the next 3 decades as the number of adults ≥65 years old increases. Noninvasive screening capable of flagging individuals most at risk of subsequent cognitive decline could trigger closer monitoring and preventive strategies. In this study, we used free-living accelerometry data to forecast cognitive decline within 1- or 5-years in older adults without dementia using two cohorts. The first cohort, recruited in the south side of Chicago, wore hip accelerometers for 7 continuous days. The second cohort, nationally recruited, wore wrist accelerometers continuously for 72 h. Separate classifier models forecasted 1-year cognitive decline with over 85% accuracy using hip data and forecasted 5-year cognitive decline with nearly 70% accuracy using wrist data, significant improvements compared to demographics and comorbidities alone. The proposed models are readily translatable to clinical practices serving ageing populations.


Conflict of interest statement

The authors declare no competing interests.

Figures

Fig. 1
Fig. 1. Confusion matrix and ROC-AUC curve summarizing experiments with data recorded for the hip accelerometry cohort.
The figure shows a confusion matrix and b ROC-AUC curve for the held-out sample.
Fig. 2
Fig. 2. Relative importance of predictive features in CDPred-4+ experiments with the hip accelerometry cohort.
The features are listed in the order of decreasing importance, from top to bottom of the graph.
Fig. 3
Fig. 3. Confusion matrix and ROC-AUC curve summarizing experiments with data recorded for the wrist accelerometry cohort.
The figure shows a confusion matrix and b ROC-AUC curve for the held-out sample.
Fig. 4
Fig. 4. Relative importance of predictive features in CDPred-4+ experiments with the wrist accelerometry cohort.
The features are listed in the order of decreasing importance, from top to bottom of the graph.
Fig. 5
Fig. 5. Distribution of CPM75/VMC75 over cohorts.
Hip/Wrist accelerometry cohorts distribution of CPM75/VMC75. Red dashed line represents Q1 quantiles on inactive: [0, 25%]; Green dashed line represents Q2 quantiles on moderately active [25–50%]; Blue dashed line represents Q3 quantiles on active [50–75%], and above Q3 represents extremely active [75–100%].
Fig. 6
Fig. 6. Includes animations illustrating the entropy, skewness, harmonics, kurtosis, and amplitude accelerometry features used in our analysis (we did not illustrate more standard statistics, such as mean and variance of measurements).
a Differential entropy: Differential entropy is the highest for a uniform distribution of activity (for example, when a person stays inactive 24 h a day, so there are no bursts of activity). When a person is more active through the day and inactive at night, the entropy of activity drops, because the daytime activity exceeds the night-time activity average. b Fast Fourier transform (FFT): The fast Fourier transform refers to the number of harmonics that can be used to describe a curve. Any curve can be decomposed into a spectrum of harmonics. In this case, the hypothetical activity curve shown in red is the sum of 3 harmonics with nonzero amplitude: one with four cycles a day, one with a single full cycle a day, and one with a two-day cycle. In real accelerometry data, the number of accelerometry harmonics composing a 24-h circadian pattern is typically over 15 harmonics. c Skewness is a statistic characterizing the asymmetry of the distribution of activity; it can be applied to entire device wear time or to smaller intervals of accelerometry readings. d Excess kurtosis is a statistic indicating deviation of a distribution from a normal distribution. Kurtosis is zero for a normal distribution, positive for distributions with heavier (than normal) tails, such as t-distribution, and negative for distributions that have lighter tails, such as Beta with parameters (2,2). e Amplitude: The amplitude of each harmonic in an FFT reflects the distance between minimum and maximum activity values. For non-essential (noise-level) harmonics in FFT, the amplitude is close to zero.

References

    1. Prince, M. in An Analysis of Prevalence, Incidence, Cost, and Trends (ed. Wimo, A) (Alzheimer’s Disease International, 2015).
    1. Institute of Medicine of the National Academies (n.d.) Institute of Medicine of the National Academies. Accessed November 13, 2008. http://www.iom.edu/ Millenson, M. L. Evidence of a need for change. Miller-McCune, 1, 34–39 (2008).
    1. Federal Interagency Forum on Aging-related Statistics. (U.S. Government Printing Office, 2016).
    1. Babulal GM, et al. Perspectives on ethnic and racial disparities in Alzheimer’s disease and related dementias: Update and areas of immediate need. Alzheimers Dement. 2019;15:292–312. doi: 10.1016/j.jalz.2018.09.009. - DOI - PMC - PubMed
    1. Hoe J, et al. Changes in the quality of life of people with dementia living in care homes. Alzheimer Dis. Assoc. Disord. 2009;23:285–290. doi: 10.1097/WAD.0b013e318194fc1e. - DOI - PMC - PubMed