. 2022 Aug 4;13(1):4443.
doi: 10.1038/s41467-022-32198-z.

Molecular characterization of colorectal cancer related peritoneal metastatic disease

Affiliations

Molecular characterization of colorectal cancer related peritoneal metastatic disease

Kristiaan J Lenos et al. Nat Commun. .

Abstract

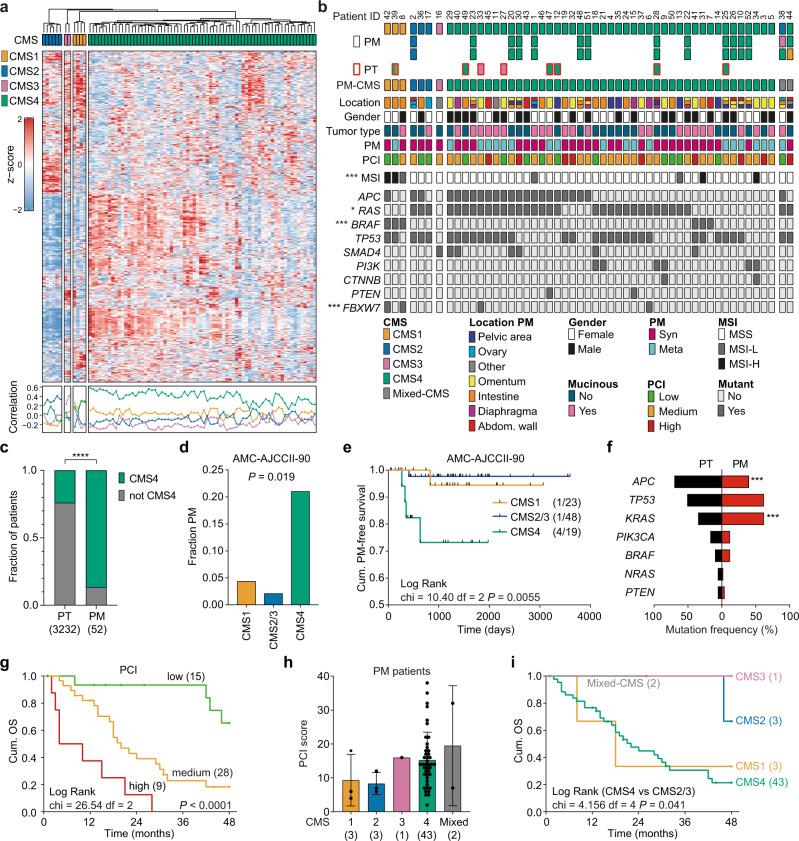
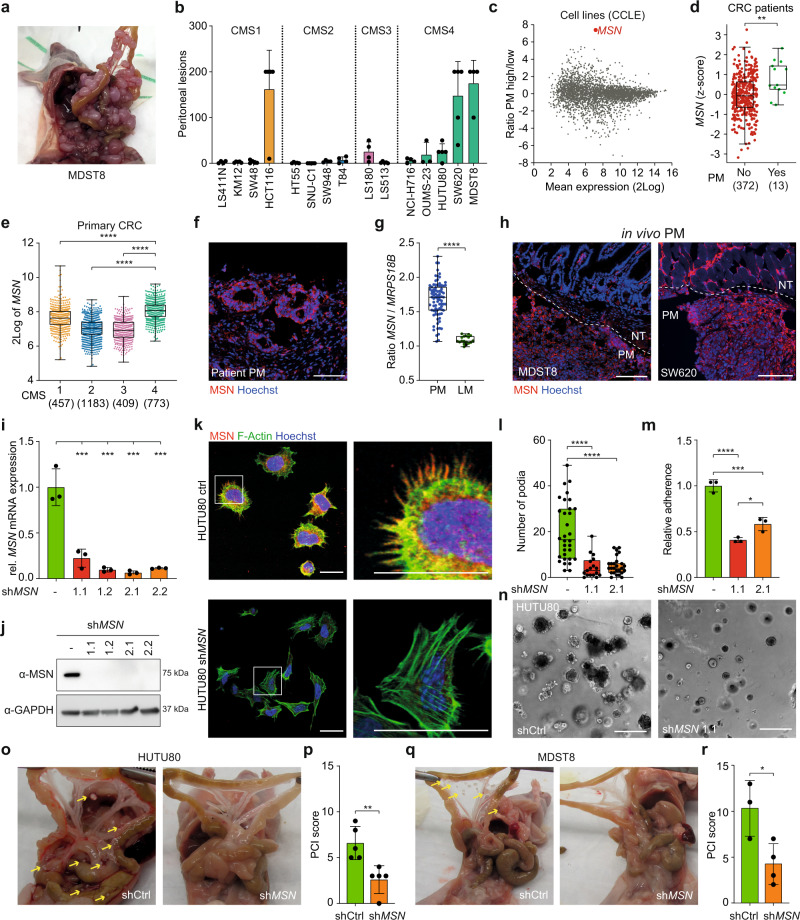
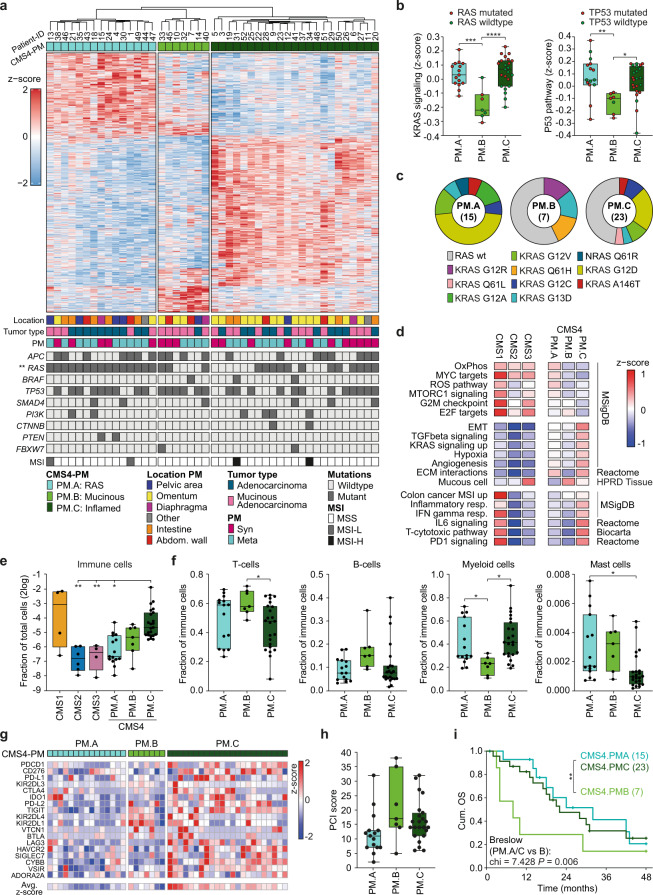
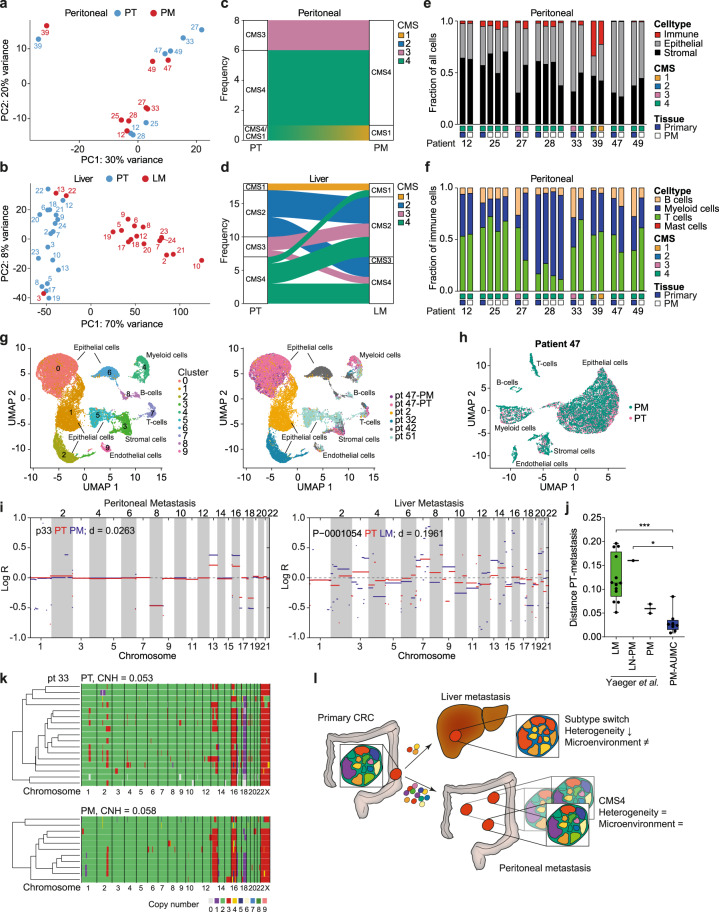
A significant proportion of colorectal cancer (CRC) patients develop peritoneal metastases (PM) in the course of their disease. PMs are associated with a poor quality of life, significant morbidity and dismal disease outcome. To improve care for this patient group, a better understanding of the molecular characteristics of CRC-PM is required. Here we present a comprehensive molecular characterization of a cohort of 52 patients. This reveals that CRC-PM represent a distinct CRC molecular subtype, CMS4, but can be further divided in three separate categories, each presenting with unique features. We uncover that the CMS4-associated structural protein Moesin plays a key role in peritoneal dissemination. Finally, we define specific evolutionary features of CRC-PM which indicate that polyclonal metastatic seeding underlies these lesions. Together our results suggest that CRC-PM should be perceived as a distinct disease entity.


Conflict of interest statement

L.V. received consultancy fees from Bayer, MSD, Genentech, Servier and Pierre Fabre, but these had no relation to the content of this publication. I.H.d.H. received research funding (paid to institute) from Roche and RandD for unrelated research. R.K., F.P.D., N.S., and G.A.S. are employees of and have ownership interest in Celsius Therapeutics. All other authors declare no conflict of interest in the context of this publication.

Figures

Fig. 1
Fig. 1. Molecular characterization of peritoneal metastasis tissue.
a CMS classification of 82 fresh frozen peritoneal metastasis samples (CMSclassifier - Single Sample Prediction (SSP)). Samples are clustered by nearest CMS classification, indicated by the colors on top. Heatmap showing the expression of the top 500 most differentially expressed genes within the peritoneal metastasis group. Correlation of samples with the CMS subtypes is depicted below the heatmap, colors of lines correspond with CMS subtype. b Schematic overview of 90 CRC-PM patient samples (52 patients). Squares represent individual tissue samples, colors indicate predicted CMS subtype. Metastasis samples (PM, n = 82, black outline) and primary tumor tissue (PT, n = 8, red outline). Location of PM, gender, primary tumor type, synchronous or metachronous development of peritoneal metastasis and PCI scores are depicted. MSI status and drivers gene mutations were derived from 1 sample per patient. Asterisks indicate significant differences between CMS subtypes (two-sided Chi-square, MSI ***P = 0.0071; RAS *P = 0.043; BRAF ***P = 5.89E-05; FBXW7 ***P = 0.0034). c Frequency of CMS4 tumors amongst primary CRC (Guinney, n = 3232) and peritoneal metastasis (n = 52) (two-sided Chi-square, P < 0.0001). d, e Incidence of peritoneal metastasis (PM) (d) and PM free survival (e) of stage II CRC patients (n = 90, AMC-AJCCII-90 cohort) stratified to CMS1, CMS2/3 and CMS4 (two-sided Fisher’s exact test, (d) and Log-rank (Mantel-Cox) test (e)). f Mutation frequencies of common driver genes in primary CRC tumors (PT, black bars) and peritoneal metastasis (PM, red bars, two-sided Fisher’s exact test, APC ***P = 0.0004; KRAS ***P = 0.0002). g Overall 4-year survival of peritoneal metastasis patients (n = 52), stratified to PCI score (low: <10, medium: 10–20, high: >20; Log Rank test, P < 0.0001). h Bar plots showing PCI score (mean and standard deviation) in relation to patient PM-CMS classification. i Overall 4-year survival of peritoneal metastasis patients (n = 52), stratified to patient PM-CMS classification (Log Rank test, P = 0.289). Source data are provided as a Source data file.
Fig. 2
Fig. 2. Subtype-specific MSN expression is related to peritoneal metastasis.
a Peritoneal outgrowth of MDST8 cells, 10 weeks post i.p. injection. b CMS specific peritoneal outgrowth of CRC cell lines, 10 weeks post injection (mean ± S.D., n = 5 animals for all cell lines, except LS411N, SW948, T84, NCI-H716, MDST8 (n = 4 animals) and OUMS23 (n = 3 animals)). c MA-plot showing all differentially expressed genes (CCLE cell line panel) between PM high (>10 lesions/animal: HCT116, LS180, OUMS-23, HUTU-80, MDST8, SW620) vs low (≤10 lesions/animal: LS411, KM12, SW48, HT55, LS513, SW948, T84, SNU-C1, NCI-H716). d MSN expression (z-score) in primary CRCs of patients with and without PM (AMC-AJCCII-90 combined with MATCH cohort, n = 385, two-sided Mann–Whitney U test, P = 0.0034). e MSN expression (2Log) in primary CRCs, stratified to CMS (one-way ANOVA with Tukey’s multiple comparisons test). f MSN expression in patient-derived fixed frozen peritoneal tumor material, MSN (red), nuclear staining (Hoechst, blue). Scale bars, 100 µm. g Ratio of gene expression (2Log) of MSN and housekeeping gene MRPS18B, in peritoneal metastases (PM, n = 82) and liver metastases (LM, n = 18, Kim et al.) (unpaired, two-sided t-test, P < 0.00001). h MSN expression in MDST8 and SW620 in vivo peritoneal lesions, MSN (red), nuclear staining (Hoechst, blue), white dotted line indicates border between normal tissue (NT) and peritoneal metastasis (PM). Scale bars, 100 µm. i, j Two different sh-RNAs targeting MSN were lentivirally transduced into HUTU80 cells, single cell clones were established and MSN expression was analyzed on both mRNA (i) and protein level (j). GAPDH was used as a housekeeping gene to normalize mRNA expression (i, one-way ANOVA with Tukey’s multiple comparisons test P = 0.009, 0.0003, 0.0002, and 0.0003, respectively). k, l Confocal images (k) of either control or MSN knockdown HUTU80 cells, 24 h after seeding, MSN (red), F-Actin (green) and nuclei (Hoechst, blue). Right images are magnifications of white boxes in left images. Scale bars, 25 µm. l Number of filopodia per cell (n = 32, 17, or 26 cells/condition, for respectively control, shMSN1.1 and shMSN2.1, one-way ANOVA with Tukey’s multiple comparisons test, ****P < 0.0001). m Relative adherence of HUTU80 cells is decreased upon MSN knockdown (one-way ANOVA with Tukey’s multiple comparisons test, ****P < 0.0001, ***P = 0.0003, *P = 0.0265). n 3D matrigel outgrowth of MSN knockdown HUTU80 is impaired. Scale bars, 50 µm. o–r In vivo peritoneal tumor outgrowth is impaired by MSN knockdown for HUTU80 (o, p) and MDST8 (q, r). Representative images of tumor burden (o, q) and PCI score (p, r) of mice injected with respectively HUTU80 or MDST8 control or MSN knockdown cells, yellow arrows indicate lesions (p, n = 5 animals, r, n = 3 (control) or 4 (shMSN) animals, two-sided t-test, P = 0.0054 (p); P = 0.0274 (r)). b, i, m, p, r Bar plots represent mean and standard deviation. d, e, g, l Boxplots indicate median, first and third quartiles (Q1 and Q3), whiskers extend to the furthest values. Source data are provided as a Source data file.
Fig. 3
Fig. 3. Clustering CMS4 peritoneal metastases into 3 distinct subgroups.
a Heatmap depicting the 1355 most differential expressed genes between the 3 CMS4-PM subgroups (1 PM sample per patient, n = 45), clustered by CMS4-PM subgroup. Location of lesions, primary tumor type, development of PM (syn- or metachronous), mutational status of CRC driver genes and MSI are indicated below (two-sided Fisher’s exact test). b Z-scores of KRAS (left) and TP53 (right) activation gene signatures in the CMS4-PM subgroups. Red and green dots indicate respectively mutated or wild-type genes (one-way ANOVA with Tukey’s multiple comparisons test, ***P = 0.0001, ****P < 0.0001, **P = 0.0049, *P = 0.0232). c Distribution of RAS mutations (KRAS and NRAS) over the 3 CMS4-PM subtypes. d Gene set enrichment analysis depicting differentially expressed (P < 0.05, two-sided t-test) signatures between the PM subgroups. Colors indicate relative signature expression (z-score). e Deconvolution of bulk RNA sequencing data was used to determine the fraction of immune cells per sample (Welch ANOVA with Dunnett’s multiple comparisons test, P = 0.0036, P = 0.0048, and P = 0.0166). f Relative distribution of immune cell types over total immune cell compartment (one-way ANOVA with Tukey’s multiple comparisons test, T cells *P = 0.049; Myeloid cells *P = 0.0476 and P = 0.0112; Mast cells *P = 0.0142). g Heatmap depicting relative expression of 18 immune checkpoint-associated genes within CMS4-PM subgroups. h Boxplots showing PCI scores within the 3 CMS4-PM subgroups (one-way Anova, P = 0.058). i Cumulative overall survival (OS) of patients with CMS4 classified peritoneal lesions, stratified to the 3 CMS4 subgroups. CMS4-PM.B has a significantly worse survival when compared to the other two combined (Breslow, P = 0.006). b, e, f, h n = 15 (CMS4-PM.A), n = 7 (CMS4-PM.B) or n = 23 (CMS4-PM.C) biologically independent samples. a, b, e, f, i Asterisks indicate level of significance: *P < 0.05; **P < 0.01; ***P < 0.001; ****P < 0.0001. b, e, f, h Boxplots indicate median, first and third quartiles (Q1 and Q3), whiskers extend to the furthest values. Source data are provided as a Source data file.
Fig. 4
Fig. 4. Primary tumor and peritoneal metastasis have highly similar profiles.
a, b PCA plots of matching primary CRC (PT, blue) and peritoneal metastasis (PM, red, n = 8 patients, a), or liver metastasis (LM, red, n = 18 patients, Kim et al., b). Numbers correspond to patient ID. c, d Alluvial plot showing CMS classification of matching primary CRC (PT) and peritoneal metastasis samples (PM, n = 8 patients, c) or liver metastasis (LM, n = 18 patients, d). e, f Deconvolution of RNA sequencing data was used to compare total cellular composition (e) or immune cell composition (f) of matched primary CRC (blue box) and PM (white box) samples, CMS of sample is indicated by colored boxes. g, h Single-cell transcriptome analysis was performed on 6 CRC samples (1 primary tumor, 5 PM samples). g UMAP (Uniform Manifold Approximation and Projection) plot of 26,570 cells from all 6 samples, color-coded by clusters (left panel) or sample ID (right panel). h UMAP plot of 11,689 cells from patient 47 (primary tumor (PT) and peritoneal metastasis (PM) sample), color-coded by sample type. i CNV profiles of primary CRC (PT, red lines) and matching metastasis sample (PM or LM, blue lines) of a PM (left panel) or a LM (right panel) patient. Distance (d) between CNV profiles of primary CRC and metastasis sample are depicted. j Boxplots depicting the CNV profile distance (d) between primary CRC and metastasis samples (median, first and third quartiles (Q1 and Q3), whiskers extend to the furthest values). LM, liver metastasis (n = 13 patients); LN-PM, peritoneal metastasis with lymph node metastasis as first metastatic site (n = 1 patient); PM, peritoneal metastasis (n = 2 patients, Yaeger et al.); PM-AUMC, peritoneal metastasis AUMC dataset (n = 8 patients) (one-way ANOVA with Tukey’s multiple comparisons test, ***P = 0.0003, *P = 0.0296). k Heatmaps showing hierarchical clustering of single-cell CNV profiles of primary CRC (upper) and matching PM sample (lower) of patient 33. Each row represents a single cell. Colors indicate ploidy number. Copy number heterogeneity was calculated based on single cell CNV profiles and indicated per sample. l Schematic representation of peritoneal and liver dissemination. Source data are provided as a Source data file.

Similar articles

Cited by

References

    1. Sung H, et al. Global cancer statistics 2020: GLOBOCAN estimates of incidence and mortality worldwide for 36 cancers in 185 countries. CA Cancer J. Clin. 2021;71:209–249. doi: 10.3322/caac.21660. - DOI - PubMed
    1. Jayne DG, Fook S, Loi C, Seow-Choen F. Peritoneal carcinomatosis from colorectal cancer. Br. J. Surg. 2002;89:1545–1550. doi: 10.1046/j.1365-2168.2002.02274.x. - DOI - PubMed
    1. Koppe MJ, Boerman OC, Oyen WJ, Bleichrodt RP. Peritoneal carcinomatosis of colorectal origin: incidence and current treatment strategies. Ann. Surg. 2006;243:212–222. doi: 10.1097/01.sla.0000197702.46394.16. - DOI - PMC - PubMed
    1. Lemmens VE, et al. Predictors and survival of synchronous peritoneal carcinomatosis of colorectal origin: a population-based study. Int. J. Cancer. 2011;128:2717–2725. doi: 10.1002/ijc.25596. - DOI - PubMed
    1. Segelman J, et al. Incidence, prevalence and risk factors for peritoneal carcinomatosis from colorectal cancer. Br. J. Surg. 2012;99:699–705. doi: 10.1002/bjs.8679. - DOI - PubMed

Publication types