. 2022 Apr 19;8(1):3.
doi: 10.1038/s41514-022-00083-0.

Pyrroloquinoline quinone (PQQ) protects mitochondrial function of HEI-OC1 cells under premature senescence

Affiliations

Pyrroloquinoline quinone (PQQ) protects mitochondrial function of HEI-OC1 cells under premature senescence

Ying Gao et al. NPJ Aging. .

Erratum in

Abstract

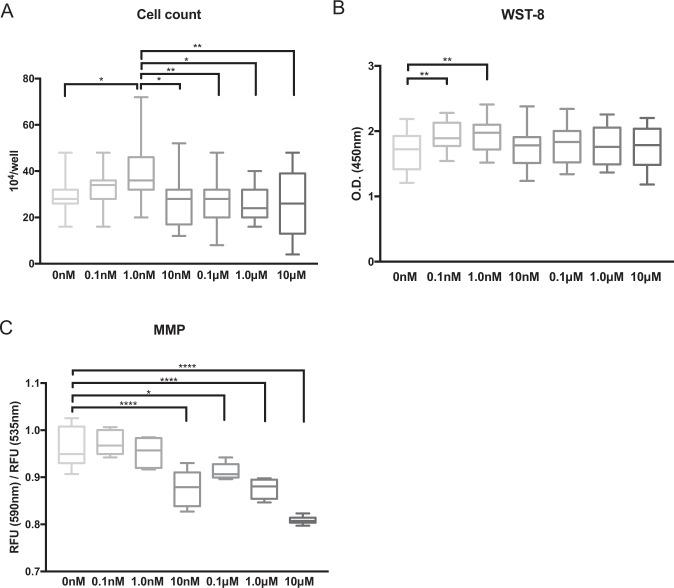
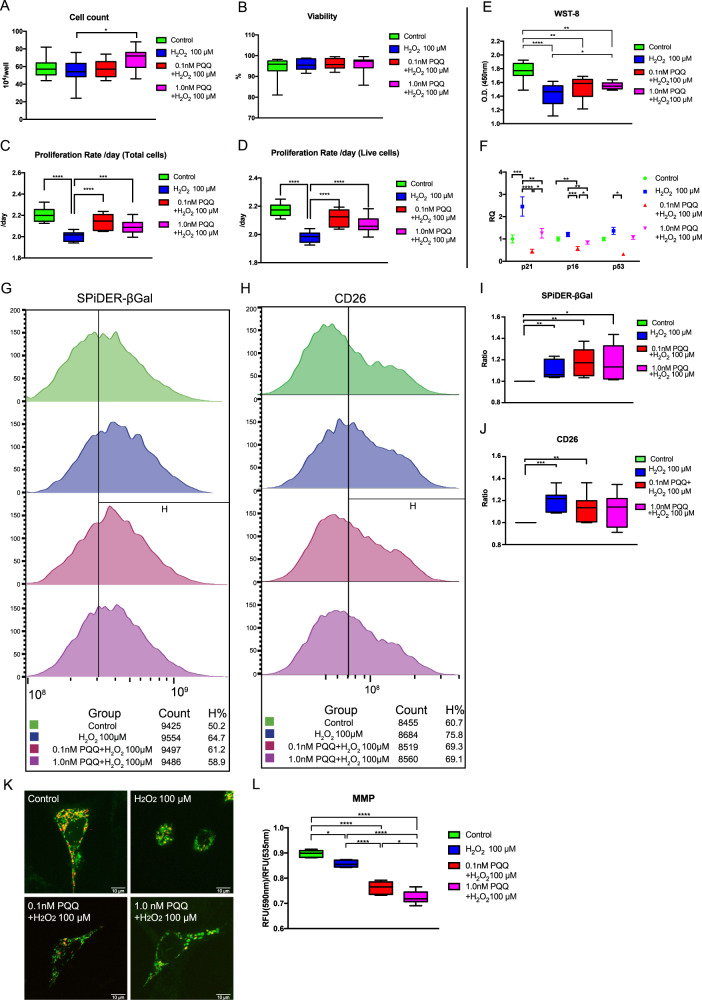
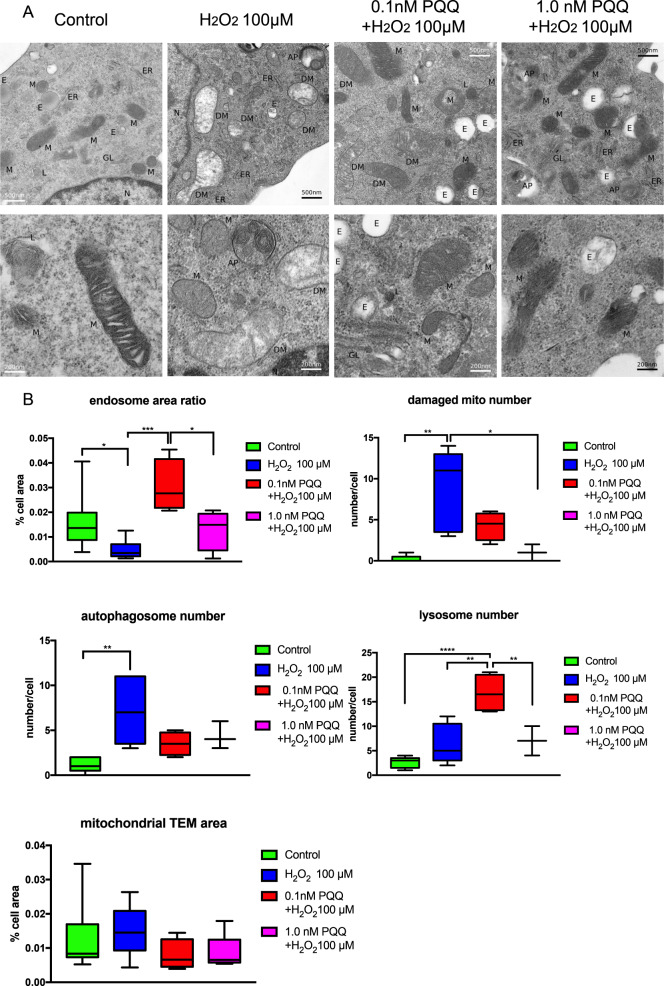
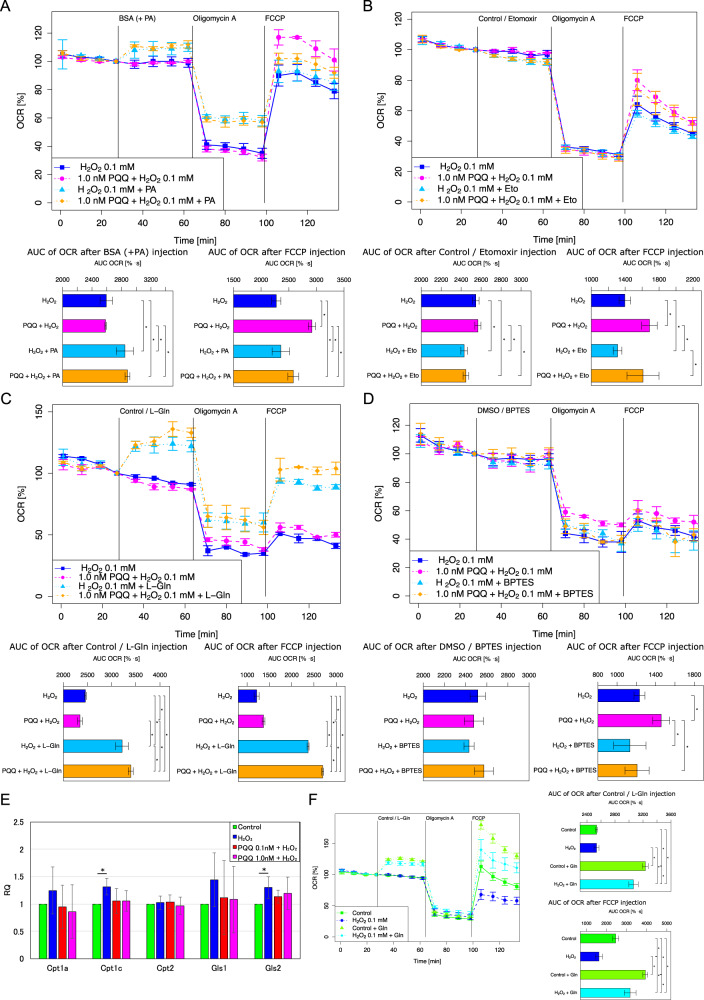
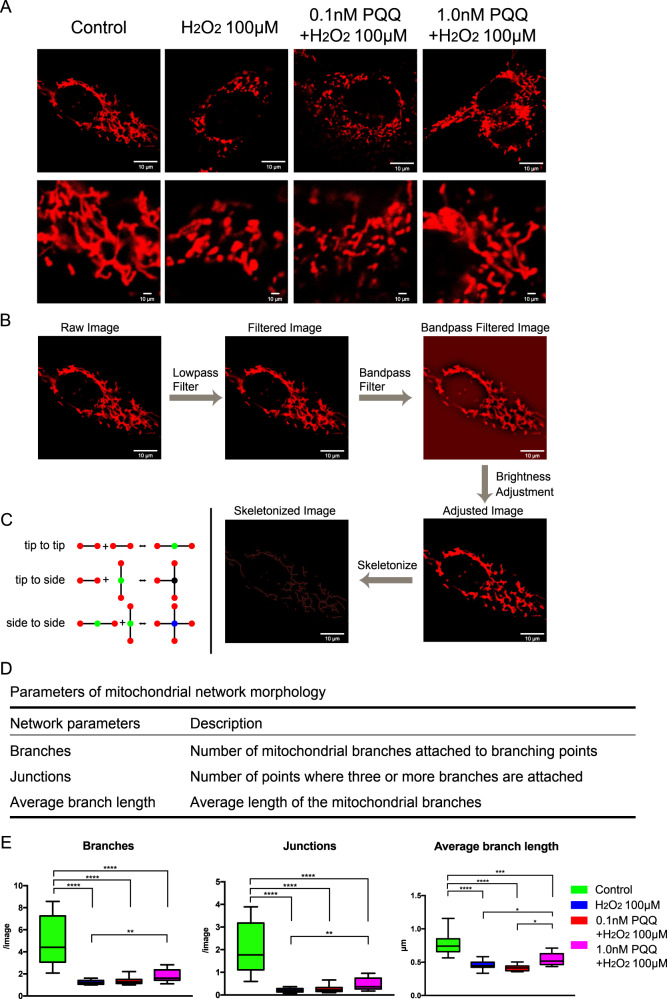
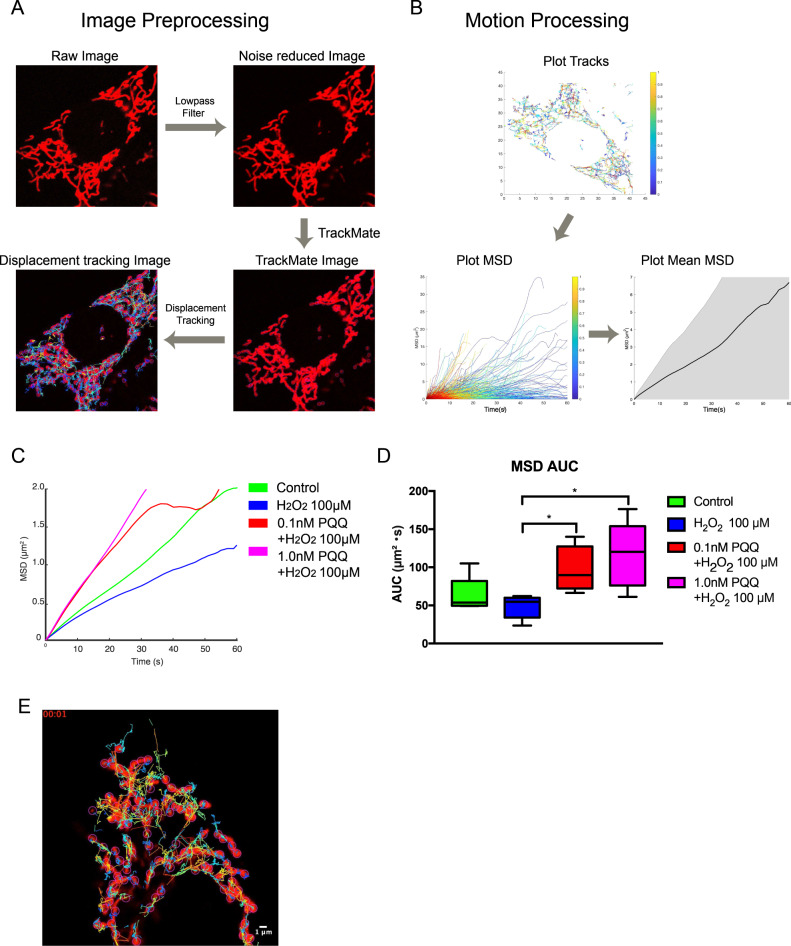
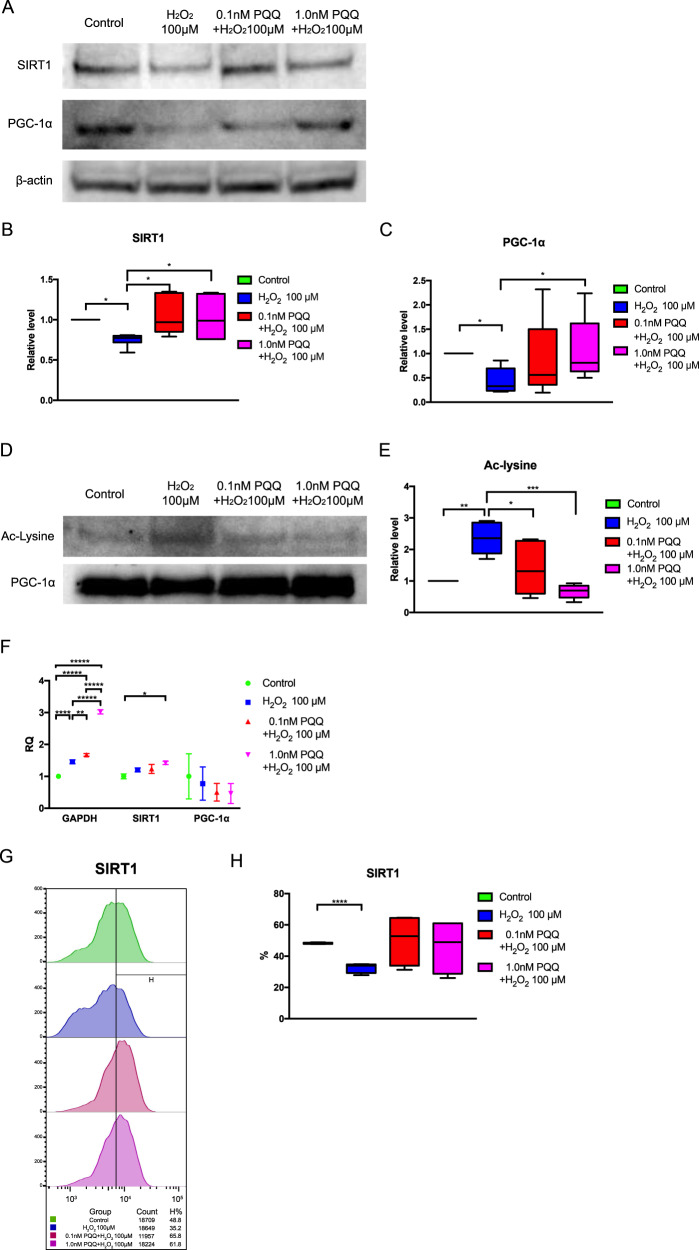
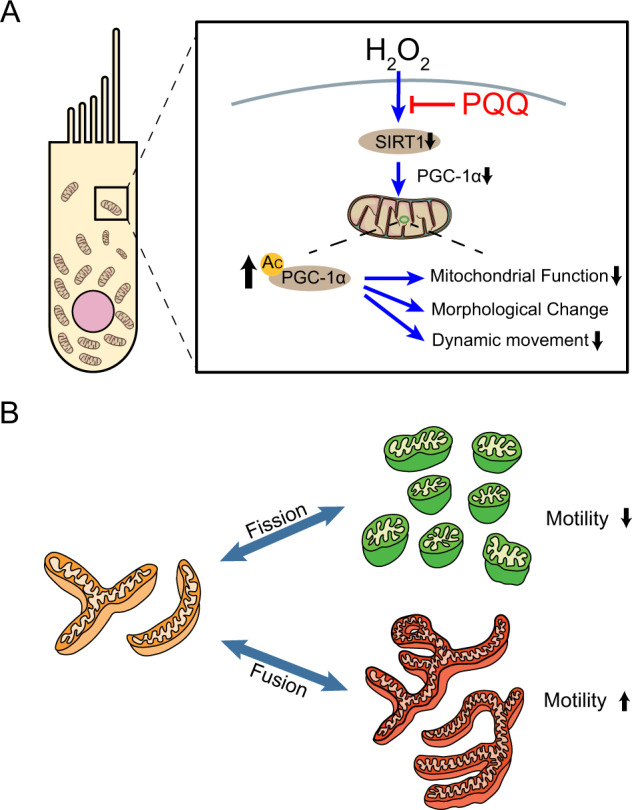
The aim of this study was to investigate the effects of pyrroloquinoline quinone (PQQ), an oxidoreductase cofactor, on the H2O2-induced premature senescence model in HEI-OC1 auditory cells and to elucidate its mechanism of action in vitro. Cells were treated with PQQ for 1 day before H2O2 (100 μM) exposure. Mitochondrial respiratory capacity was damaged in this premature senescence model but was restored in cells pretreated with PQQ (0.1 nM or 1.0 nM). A decrease in mitochondrial potential, the promotion of mitochondrial fusion and the accelerated movement of mitochondria were all observed in PQQ-pretreated cells. The protein expression of sirtuin 1 (SIRT1) and peroxisome proliferator-activated receptor gamma coactivator-1α (PGC-1α) were significantly decreased under H2O2 exposure while they were increased with PQQ pretreatment, and PGC-1α acetylation was significantly decreased. In conclusion, PQQ has a protective effect on the premature senescence model of HEI-OC1 auditory cells and is associated with the SIRT1/PGC-1α signaling pathway, mitochondrial structure, and mitochondrial respiratory capacity.


Conflict of interest statement

The authors declare no competing interests.

Figures

Fig. 1
Fig. 1. Effects of PQQ on cell proliferation, cell metabolic activity, and the mitochondrial membrane potential in HEI-OC1 cells evaluated using multiple assays.
A Cell proliferation rate analyzed by cell counting after PQQ pretreatment for 1 day. B Cell metabolic activity measured with the WST-8 formazan assay after PQQ pretreatment for 1 day, shown in optical density (O.D.). The higher value indicates higher metabolic activity. C Mitochondrial membrane potential (MMP) measured with JC-1 fluorescence staining after PQQ pretreatment for 1 day. The ratio of red signal (relative fluorescence units (RFU) at 590 nm; mitochondrial polarized cells) to green signal (RFU at 535 nm; mitochondrial depolarized cells) is shown (n = 5 per group). Box plot shows statistical parameters as follows; central line: median; box limits: first and third quartile; whiskers: minimum and maximum. *P < 0.05, **P < 0.01, ****P < 0.0001.
Fig. 2
Fig. 2. Cell proliferation, cell metabolic activity, senescence markers, and mitochondrial membrane potential (MMP) in HEI-OC1 cells with premature cellular senescence induced by H2O2 exposure with and without PQQ pretreatment.
The effects of PQQ under H2O2 exposure are evaluated using multiple assays in the same manner as shown in Fig. 1. A Cell count 1 day after H2O2 exposure. B Cell viability 1 day after H2O2 exposure. C Cell proliferation rate using total cell count for 3 days after H2O2 exposed. D Cell proliferation rate using live-cell count for 3 days after H2O2 exposure. E Cell metabolic activity measured with WST-8 formazan assay. F Relative mRNA expressions of Cdkn1a (p21), Cdkn2a (p16), and Trp53 (p53) using β-actin as an internal control. RQ relative quantification. G The changes of senescence-associated β-galactosidase (SA-β-Gal) using SPiDER-βGal staining in flow cytometry analysis. H The changes of dipeptidyl peptidase DPP4 (CD26) cell surface protein marker in flow cytometry analysis. I The increased ratio in positivity rate over control of SPiDER-βGal positive cells. J The increased ratio in positivity rate over control of CD26 positive cells. K Imaging of mitochondria stained with JC-1. Green signal indicates low MMP and red signal indicates high MMP. Scale bar, 10 µm. L MMP measured with JC-1. (AD, L: n = 6 per group, E, I, J: n = 5 per group, F: n = 3 per group). Box plot shows statistical parameters as follows; central line: median; box limits: first and third quartile; whiskers: minimum and maximum. RQ data are shown as mean ± standard deviation. *P < 0.05, **P < 0.01, ***P < 0.001, ****P < 0.0001.
Fig. 3
Fig. 3. Mitochondrial ultrastructure in HEI-OC1 cells exposed to H2O2 (100 µM) with and without PQQ pretreatments (0.1 nM and 1.0 nM), and control cells.
A Short exposure to H2O2 induces fine structural damage to mitochondria, which is alleviated with PQQ pretreatment. From left to right: control cells, cells exposed to H2O2, cells exposed to H2O2 after 0.1 nM PQQ pretreatment, and cells exposed to H2O2 after 1.0 nM PQQ pretreatment. AP autophagosome, DM damaged mitochondria, E endosome, ER endoplasmic reticulum, GL Golgi body, L lysosome, M mitochondria, N nucleus. Scale bar, 500 nm in top row, 200 nm bottom row. B The numerical analysis of TEM images. The endosome ratio, damaged mitochondria number, autophagosome number, and lysosome number were calculated by visual inspection (n = 5 per group). Box plot shows statistical parameters as follows; central line: median; box limits: first and third quartile; whiskers: minimum and maximum. *P < 0.05, **P < 0.01, ***P < 0.001, ****P < 0.0001.
Fig. 4
Fig. 4. Mitochondrial biogenesis in the premature cellular senescence model with and without PQQ treatment.
The effects of PQQ pretreatment in HEI-OC1 cells exposed to H2O2 were evaluated using a XF24 flux analyzer. A Oxygen consumption rate (OCR) diagram of the XF assay, normalized by the number of cells. B Extracellular acidification rate (ECAR) diagram of the XF assay. C ATP production rate quantified with OCR measured following the injection of oligomycin, maximal respiration rates measured following injection of FCCP, and cell energy phenotype profile of the XF assay. D Basal ATP production rate and ATP rate index of the XF assay (n = 5 per group). Data are shown as mean ± standard deviation. *P < 0.05.
Fig. 5
Fig. 5. Substrate-specific mitochondrial biogenesis in the premature cellular senescence model with and without PQQ treatment.
The substrate-specific effects of PQQ pretreatment in HEI-OC1 cells exposed to H2O2 were evaluated using a XF24 flux analyzer; A Oxygen consumption rate (OCR) under palmitic acid supplementation. B OCR under Cpt (Carnitine palmitoyltransferase) inhibition by Etomoxir. C OCR under glutamine supplementation. D OCR under Gls (Glutaminase) inhibition by BPTES ((bis-2-(5-phenylacetamido-1,3,4-thiadiazol-2-yl)ethyl sulfide). E Relative mRNA expressions of Cpt1a, Cpt1c, Cpt2, Gls1, and Gls2 using β-actin as an internal control. F OCR under glutamine supplementation in HEI-OC1 cells in the control group or H2O2-exposed group (n = 5 per group). Data are shown as mean ± standard deviation. *P < 0.05.
Fig. 6
Fig. 6. The morphological evaluation of mitochondria in the premature cellular senescence model under PQQ pretreatment.
The morphological changes with PQQ pretreatment in HEI-OC1 cells exposed to H2O2 to induce premature cellular senescence were evaluated using microscopic imaging. A Mitochondrial images stained with MitoTracker Orange CMTMRos. Scale bar, 10 µm. B The image processing flow of the skeletonized image analysis. C The different types of dynamic mitochondrial regulations including fusion and fission mechanisms involving network nodes (tip-to-tip, tip-to-side, or side-to-side). Graph representation of the mitochondrial reticulum using four node types: 1 (magenta), 2 (green), 3 (dark blue), and 4 (blue). D The descriptions of parameters in the mitochondrial network morphology. E The number of branches, junctions, and the average length of branches in each image (E: n = 5 per group; repeated experiments). Box plot shows statistical parameters as follows; central line: median; box limits: first and third quartile; whiskers: minimum and maximum. *P < 0.05, **P < 0.01, ***P < 0.001, ****P < 0.0001.
Fig. 7
Fig. 7. The dynamic evaluation of mitochondrial motility in the premature cellular senescence model under PQQ pretreatment.
The changes in mitochondrial dynamics with PQQ pretreatment in HEI-OC1 cells exposed to H2O2 to induce premature cellular senescence were evaluated using microscopic imaging and image processing. A Image preprocessing flow of the motility analysis. B Motility analysis of the mitochondria. C The average of the mean square displacement (MSD) of each group. D The area under curve (AUC) of the MSD of each group. E Mitochondrial motion tracking video. The mitochondrial particle tracking lasted for 3 min in 3 s of intervals under ImageJ (D: n = 5 per group; repeated experiments). Box plot shows statistical parameters as follows; central line: median; box limits: first and third quartile; whiskers: minimum and maximum. *P < 0.05.
Fig. 8
Fig. 8. Analysis of protein expression and protein acetylation in the premature cellular senescence model under PQQ pretreatment.
A SIRT1 and PGC-1α protein expression was analyzed by Western blotting (upper, middle) using β-actin as a loading control (lower). B Relative protein expression level of SIRT1 normalized by β-actin. n = 10 per group. C Relative protein expression level of PGC-1α normalized by β-actin. D Acetylation of PGC-1α analyzed by immunoprecipitation. E Relative acetylation level of PGC-1α normalized by PGC-1α. F Relative mRNA expressions of GAPDH, SIRT1, and PGC-1α using β-actin as an internal control. G The changes of SIRT1 expression in flow cytometry analysis. H The rate of SIRT1 positive cells (B, C, E, H: n = 5 per group, F: n = 3 per group; repeated experiments). Box plot shows statistical parameters as follows; central line: median; box limits: first and third quartile; whiskers: minimum and maximum. RQ data are shown as mean ± standard deviation. *P < 0.05, **P < 0.01, ***P < 0.001, ****P < 0.0001, *****P < 0.00001.
Fig. 9
Fig. 9. Schematic diagram of the mechanism of HEI-OC1 mitochondrial biogenesis modulation under H2O2 exposure and PQQ protection.
A Sirtuin 1 (SIRT1) expression and deacetylation activity are decreased in HEI-OC1 cells by H2O2 exposure. PGC-1α mediates the protective effect of SIRT1 expression and mitochondrial biogenesis and function. PQQ improves mitochondrial biogenesis and function by restoring SIRT1 expression and deacetylation activity under H2O2 exposure in HEI-OC1 cells. B Schematic diagram of mitochondrial morphological changes.

Similar articles

Cited by

References

    1. Baker DJ, et al. Clearance of p16 Ink4a-positive senescent cells delays ageing-associated disorders. Nature. 2011;479:232–236. - PMC - PubMed
    1. Tsuchihashi NA, et al. Autophagy through 4EBP1 and AMPK regulates oxidative stress-induced premature senescence in auditory cells. Oncotarget. 2015;6:3644–3655. - PMC - PubMed
    1. Wang Z, Wei D, Xiao H. Methods of cellular senescence induction using oxidative stress. Methods Mol. Biol. 2013;1048:135–144. - PubMed
    1. Zdanov S, Remacle J, Toussaint O. Establishment of H2O2-induced premature senescence in human fibroblasts concomitant with increased cellular production of H2O2. Annal. New York Acad. Sci. 2006;1067:210–216. - PubMed
    1. Kamogashira T, Hayashi K, Fujimoto C, Iwasaki S, Yamasoba T. Functionally and morphologically damaged mitochondria observed in auditory cells under senescence-inducing stress. npj Aging Mech. Dis. 2017;3:2. - PMC - PubMed