. 2022 Aug 4;13(1):4520.
doi: 10.1038/s41467-022-32285-1.

TP53-dependent toxicity of CRISPR/Cas9 cuts is differential across genomic loci and can confound genetic screening

Affiliations

TP53-dependent toxicity of CRISPR/Cas9 cuts is differential across genomic loci and can confound genetic screening

Miguel M Álvarez et al. Nat Commun. .

Abstract

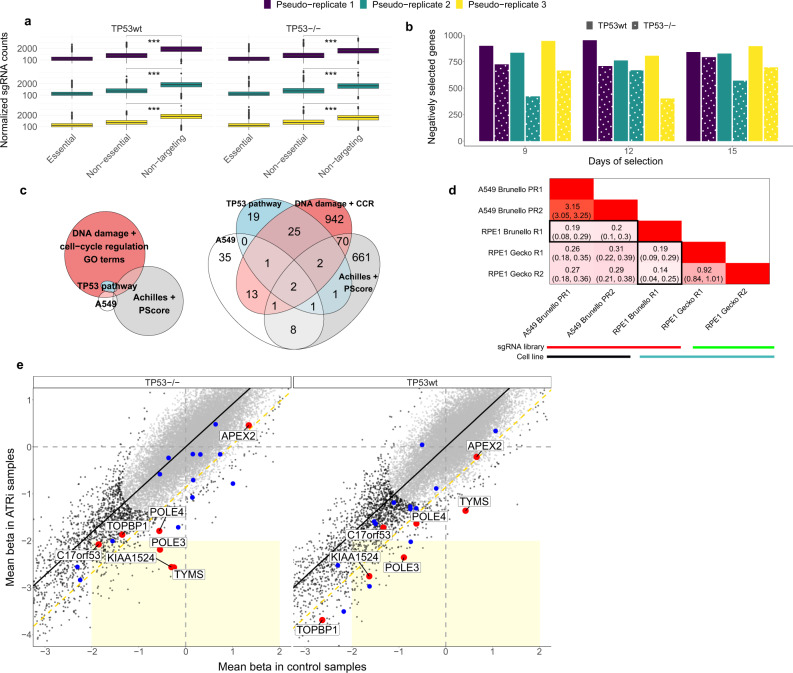
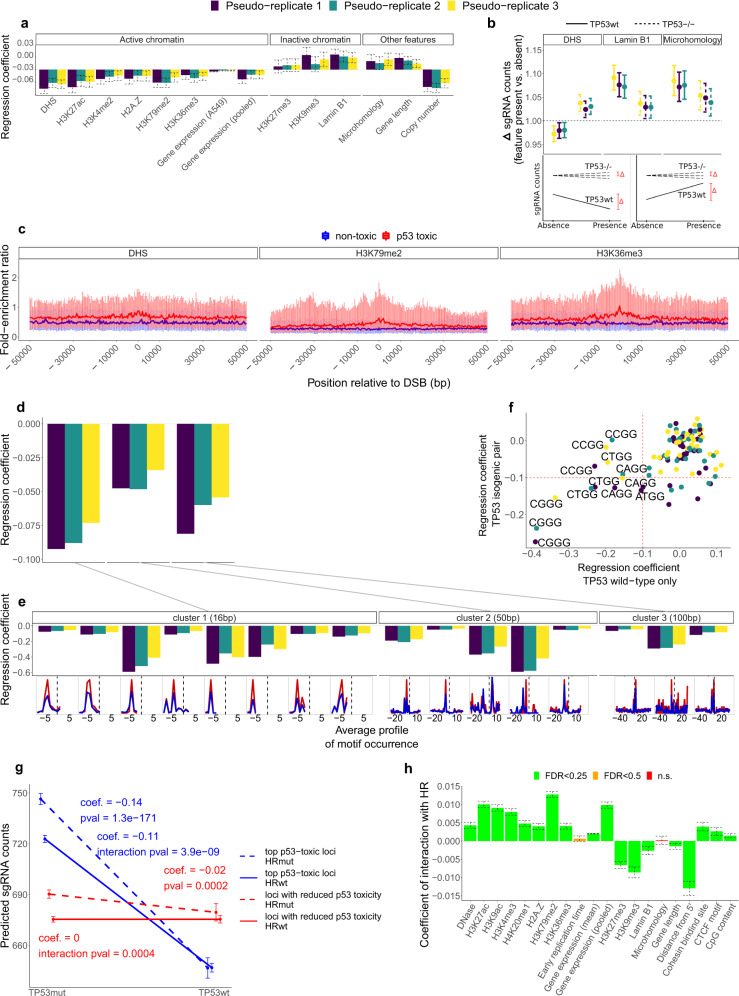
CRISPR/Cas9 gene editing can inactivate genes in a precise manner. This process involves DNA double-strand breaks (DSB), which may incur a loss of cell fitness. We hypothesize that DSB toxicity may be variable depending on the chromatin environment in the targeted locus. Here, by analyzing isogenic cell line pair CRISPR experiments jointly with previous screening data from across ~900 cell lines, we show that TP53-associated break toxicity is higher in genomic regions that harbor active chromatin, such as gene regulatory elements or transcription elongation histone marks. DSB repair pathway choice and DNA sequence context also associate with toxicity. We also show that, due to noise introduced by differential toxicity of sgRNA-targeted sites, the power of genetic screens to detect conditional essentiality is reduced in TP53 wild-type cells. Understanding the determinants of Cas9 cut toxicity will help improve design of CRISPR reagents to avoid incidental selection of TP53-deficient and/or DNA repair deficient cells.


Conflict of interest statement

The authors declare no competing interests.

Figures

Fig. 1
Fig. 1. A TP53 wild-type background can confound estimates of gene selection in genetic screens.
a Boxplots showing the pooled normalized sgRNA counts per sample (essential and non-essential genes, and non-targeting sgRNAs; 15 day samples are shown). Tested using 1-tailed Mann-Whitney. *** denotes a p <2.2e-16. No adjustments were made for multiple comparisons. n = 7300 independent sgRNAs examined over six independent experiments. b Barplot showing the number of genes that are negatively (beta score<0) selected, per sample used in this study. Beta score significance: FDR < 0.25. c Venn (left) and corresponding Euler (right) diagrams of the overlap of genes between four sets: genes negatively selected exclusively in TP53wt in our samples (A549), genes negatively selected exclusively in TP53wt in Project Achilles and Score (Achilles + Score), top-50 TP53-interactors (TP53 pathway), and genes included in 19 GO terms related to DNA damage and cell-cycle regulation that we found enriched with genes from the A549 set. d Results of the analysis of overlap between different cell lines and/or sgRNA libraries detailed in Supplementary Text 1a: heatmap shows the log2 odds ratio of the overlap of genes negatively selected exclusively in TP53wt, between different experiments. R: Replicate, PR: Pseudo-replicate. Darker shades of red indicate higher overlap. Black rectangles highlight the overlap between RPE1 Brunello dataset with others. e Comparison between TP53-isogenic cell lines to assess biases in identifying conditional essentiality from genetic screens. x and y axes represent the standardized beta scores (Z-scores) for genes either in the control samples (incl. doxycycline-treated; pseudo-replicates 1 and 2), or in the doxycycline+ATRi treated samples, respectively, averaged across later time points and pseudo-replicates. Coordinate axes were capped in order to zoom on the region of interest. The EM clustering identified two gene clusters as the most likely model, represented by black and gray dots. Black line represents the best fit linear model. The yellow dashed diagonal line represents −2 standard deviations (SD) of the Z-score difference. The light yellow rectangle delimits the tentative significance area containing genes negatively selected in the treatment, but not selected in the control sample (i.e., potentially synthetic lethal with ATRi). The top-20 validated ATRi-sensitizing genes are highlighted with color, and the top-7 (red) are further labelled. Source data are provided as a Source Data file.
Fig. 2
Fig. 2. Association of active chromatin marks with high-p53-toxicity sgRNA target sites.
a NB regression coefficients for each chromatin feature tested independently. Each colour represents one of the three pseudo-replicates. The regression coefficients are those from the interaction of TP53 status with a given variable (see Supplementary Fig. 6a (bottom) for the effect of each variable per se, including only the TP53wt samples). Negative regression coefficients indicate a decrease of sgRNA counts. All regression coefficients have FDR < 0.25. n = 10,050 independent sgRNAs and 14 chromatin features were examined over six independent samples at three time points. Error bars represent the SE of the mean. b Interpretation of the regression coefficients of the interactions between TP53 status and three selected features. There is a larger departure of the fitted sgRNA counts if the feature is present (its absence is scaled to 1) in TP53wt samples. For active chromatin feature DHS, the departure happens towards lower sgRNA counts in TP53wt samples (i.e., more p53 toxicity vinculated to presence of the feature), while the opposite is true for Lamin B1 (inactive chromatin) and microhomology. Error bars are 95% CI. Pseudo-replicates follow the same color scheme as in Fig. 1a. Schematics are included to aid interpretation of DHS (bottom left) and Lamin B1 and Microhomology (bottom right); the actual regressions are in Supplementary Fig. 6c. n = 10,050 independent sgRNAs and three chromatin features examined over six independent experiments. c Local abundance of a feature (represented as the ChipSeq fold-enrichment ratio), averaged at each 400bp-bin position relative to the sgRNA cut position (denoted 0), shown for the top 200 target loci exhibiting high p53 toxicity (larger negative LFC, red) and top 200 non-selected loci (LFC closer to 0, blue). Vertical lines represent the 25–75% interquartile range at each bin, and left-to-right lines connect the medians. Supplementary Fig. 6d shows the corresponding figures when using another score. d Clusters of DNA sequence motifs identified by HOMER as enriched near target loci (FDR < 1e-5) —at different genomic distance to the sgRNA cut position— that show a significant (FDR < 0.25; red crosses indicate FDR > 0.25) and consistent association with higher p53 toxicity in the NB regressions (see Supplementary Fig. 8 for the effect of each variable alone regressed against the same sgRNA set, including only the TP53wt samples). e Separate regression results for motifs contained in the motif clusters. Below each motif are shown its relative frequencies at target (red) and background (blue) loci. The actual motif sequences are shown in Supplementary Fig. 8B. f Associations with all PAM sequence contexts, as regression coefficients. Top associations with DSB-related p53 toxicity are labelled. See Supplementary Fig. 9 for additional information. g Interaction of TP53 and HR repair gene mutational status, using either the counts from the target loci (blue) or from the control loci (red). For the regressions including only HRmut cell lines (dashed lines) the regression coefficient and associated p-value are shown; for the regressions including only HRwt cell lines (full lines) the regression coefficient and p-value of the interaction of TP53 and HR are shown. Error bars represent the 95% CI. n = 16,174 independent sgRNAs examined over 124 independent cell lines. h Regression coefficients of the interaction between each feature and the HR repair mutational status. Positive coefficients indicate that the increment of DSB toxicity when a feature is present (or more abundant) is alleviated in HRwt cells. Error bars represent the SE of the mean. FDR adjustment was performed to account for multiple comparisons. n = 56,855 independent sgRNAs and 20 chromatin features examined over 124 independent cell lines. Source data are provided as a Source Data file.

References

    1. Jinek M, et al. A programmable dual-RNA-guided DNA endonuclease in adaptive bacterial immunity. Science. 2012;337:816–821. doi: 10.1126/science.1225829. - DOI - PMC - PubMed
    1. Cho SW, Kim S, Kim JM, Kim J-S. Targeted genome engineering in human cells with the Cas9 RNA-guided endonuclease. Nat. Biotechnol. 2013;31:230–232. doi: 10.1038/nbt.2507. - DOI - PubMed
    1. Cong L, et al. Multiplex genome engineering using CRISPR/Cas systems. Science. 2013;339:819–823. doi: 10.1126/science.1231143. - DOI - PMC - PubMed
    1. Mali P, et al. RNA-guided human genome engineering via Cas9. Science. 2013;339:823–826. doi: 10.1126/science.1232033. - DOI - PMC - PubMed
    1. Hart T, et al. High-resolution CRISPR screens reveal fitness genes and genotype-specific cancer liabilities. Cell. 2015;163:1515–1526. doi: 10.1016/j.cell.2015.11.015. - DOI - PubMed

Publication types