. 2022 Aug 4;13(1):4545.
doi: 10.1038/s41467-022-32142-1.

Cingulate-motor circuits update rule representations for sequential choice decisions

Affiliations

Cingulate-motor circuits update rule representations for sequential choice decisions

Daigo Takeuchi et al. Nat Commun. .

Abstract

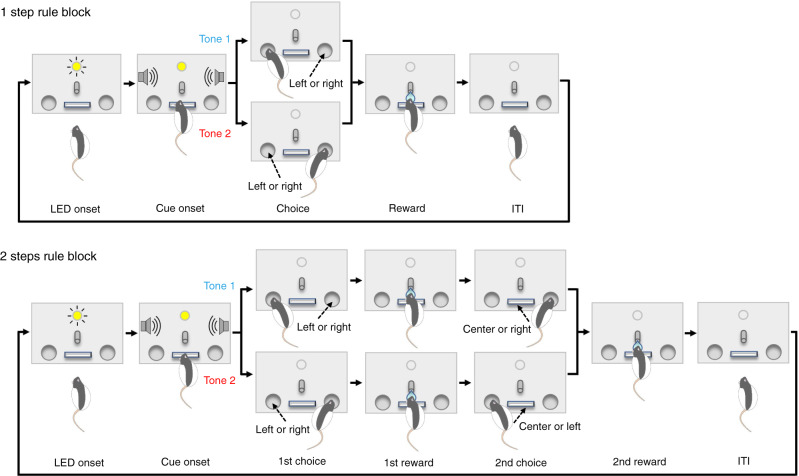
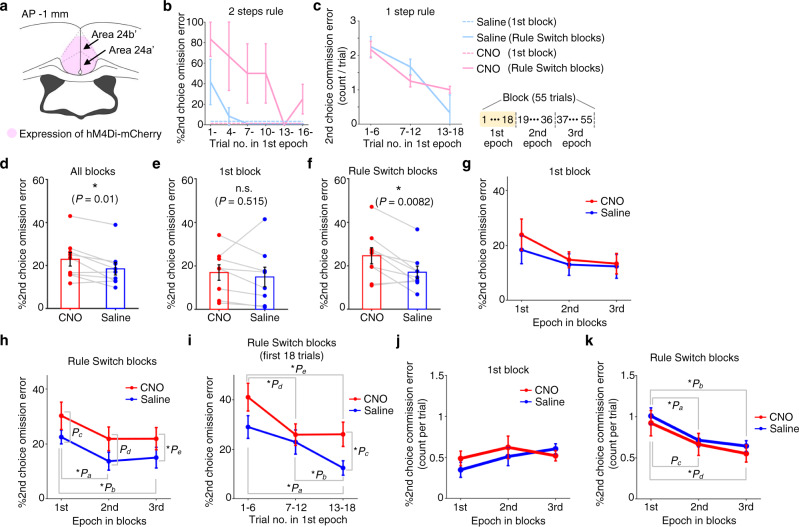
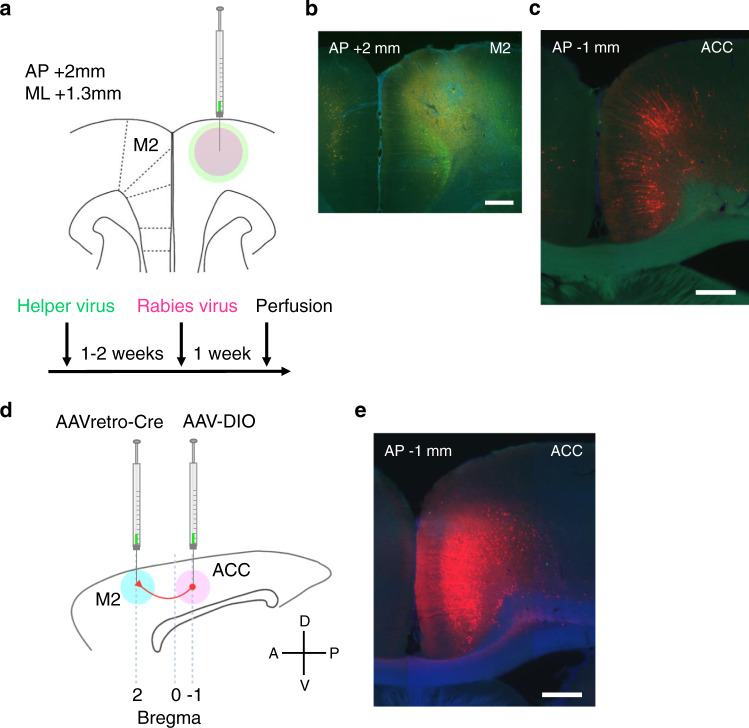
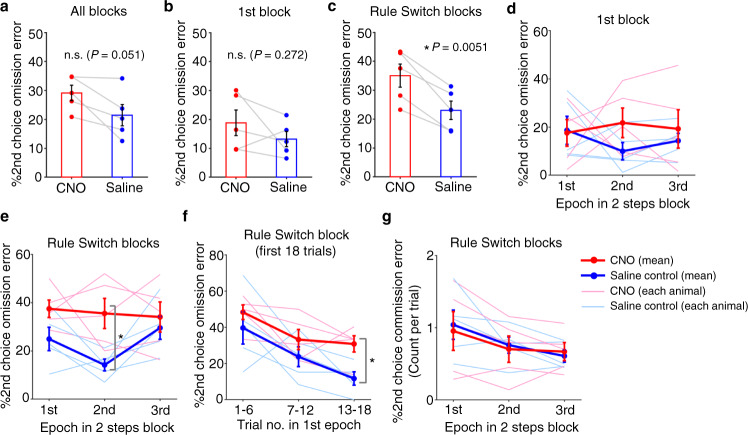
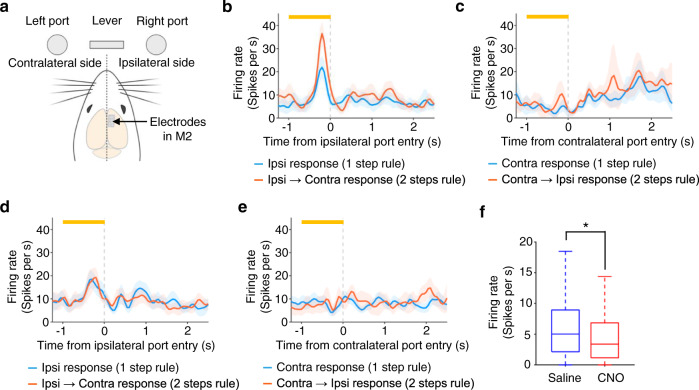
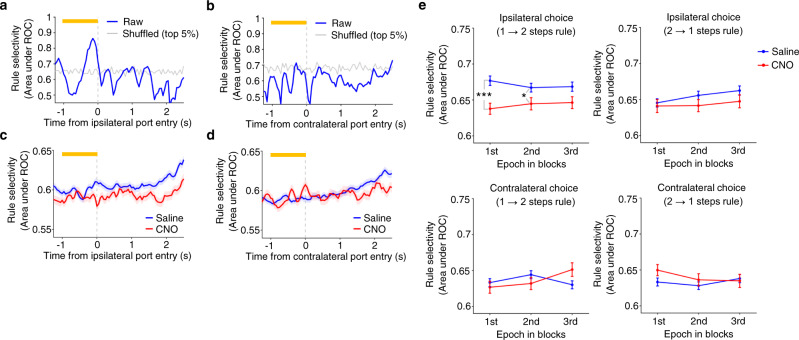
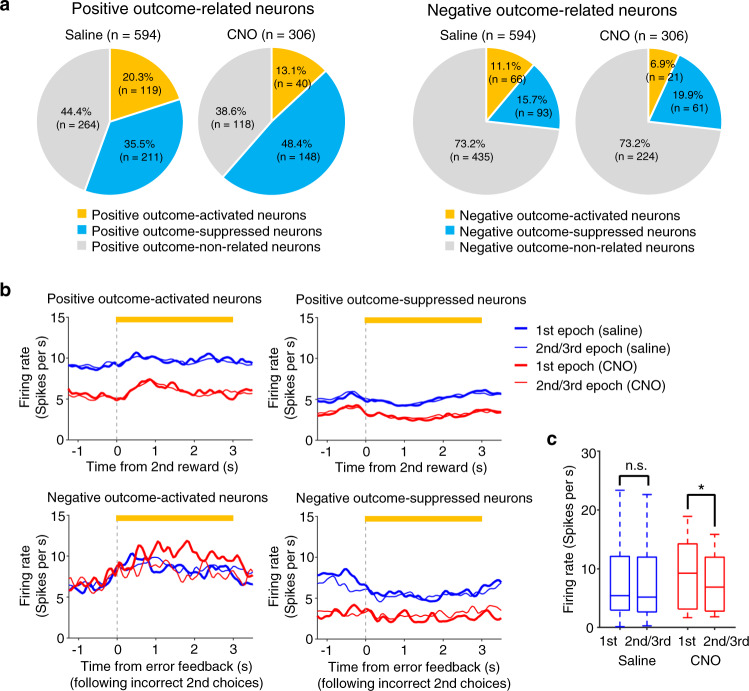
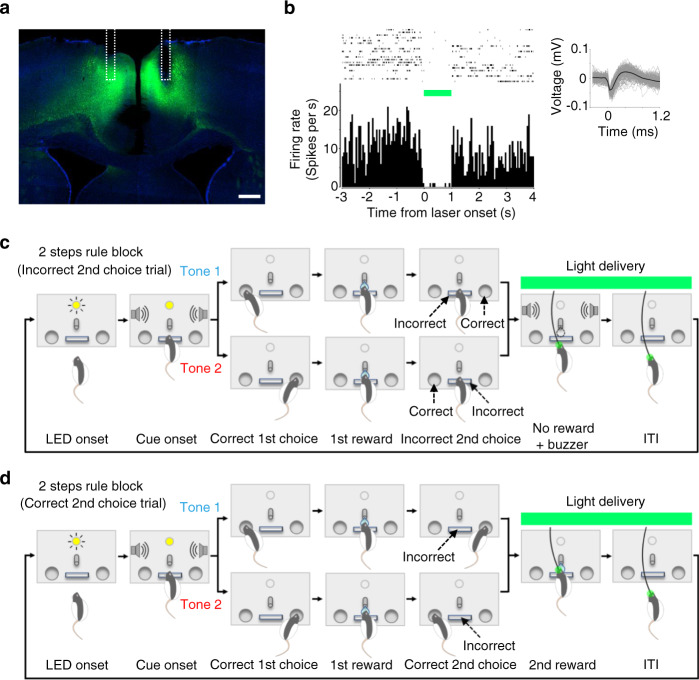
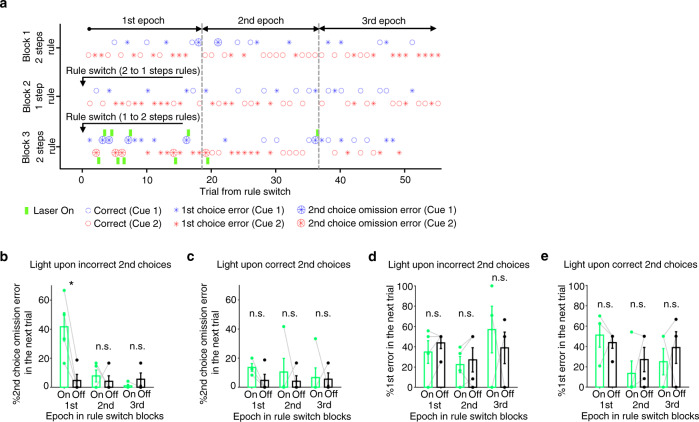
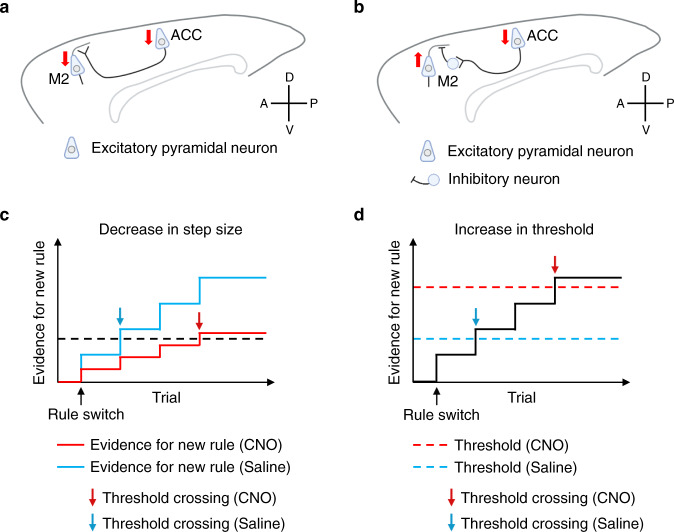
Anterior cingulate cortex mediates the flexible updating of an animal's choice responses upon rule changes in the environment. However, how anterior cingulate cortex entrains motor cortex to reorganize rule representations and generate required motor outputs remains unclear. Here, we demonstrate that chemogenetic silencing of the terminal projections of cingulate cortical neurons in secondary motor cortex in the rat disrupts choice performance in trials immediately following rule switches, suggesting that these inputs are necessary to update rule representations for choice decisions stored in the motor cortex. Indeed, the silencing of cingulate cortex decreases rule selectivity of secondary motor cortical neurons. Furthermore, optogenetic silencing of cingulate cortical neurons that is temporally targeted to error trials immediately after rule switches exacerbates errors in the following trials. These results suggest that cingulate cortex monitors behavioral errors and updates rule representations in motor cortex, revealing a critical role for cingulate-motor circuits in adaptive choice behaviors.


Conflict of interest statement

The authors declare no competing interests.

Figures

Fig. 1
Fig. 1. Conditional action sequencing task.
Rats were trained and tested in a chamber in which a lever, a water spout, and an LED were installed on the front wall with two infrared (IR) ports on the left and right sides. Sound speakers were equipped on side walls. Task rules were switched between 1 step rule and 2 steps conditions every 55 trials. LED onset signals the end of the inter-trial interval (ITI) and rats can start a new trial by pushing the center lever. In 1 step condition (top), animals received a water reward after correctly poking the left or right IR port as instructed by one of two tone cues. When animals poked an incorrect port, they received no reward, and instead, a buzzer sound was delivered with an extra waiting being imposed in ITI before starting the next trial (i.e., 1st choice error; also see Supplementary Fig. 1c). In 1 step condition, no reward but an error feedback buzzer followed by an extra waiting time was delivered when animals made a second choice to the opposite side port (2nd choice commission error; also see Supplementary Fig. 1d). In 2 steps condition (bottom), animals received a reward after making a correct first choice and then received another reward after poking the opposite side port. If an animal made an incorrect first choice, no reward was delivered. Instead, a buzzer sound was delivered, and an extra waiting time was imposed in ITI before starting the next trial (1st choice error). If the animal made a correct first choice but pushed the center lever before poking the opposite side port, it received no reward. Instead, a buzzer sound was delivered, and an extra waiting time was imposed in ITI (2nd choice omission error; also see Supplementary Fig. 1d).
Fig. 2
Fig. 2. Chemogenetic silencing of ACC affected task performance.
a Inhibitory DREADD virus was injected in ACC. b 2nd choice performance for 1st epoch in 2 steps condition in representative CNO and saline sessions (three rule switches each for 1→2 steps and for opposite direction in both sessions). Blue, saline. Pink, CNO. Dotted and solid lines, 1st and Rule Switch-blocks. c 2nd choice commission error for 1st epoch in 1 step condition for the same sessions. d 2nd choice performance for all 2 steps blocks. Blue, saline. Red, CNO. e Same as in d, but for 1st block. f Same as in d, but for Rule Switch-blocks. g 2nd choice performance for 1st block in 2 steps condition. Repeated measures ANOVA revealed no main effect (P > 0.4 for dose; P > 0.1 for epoch). h Same as in g, but for Rule Switch-blocks. CNO dose showed a main effect (P = 0.018, F1,50 = 5.98 for dose; P = 0.051, F2,50 = 3.16 for epoch) with no interaction (P > 0.9). Post hoc comparisons using two-sided paired t-test with Bonferroni’s correction across epochs (no correction for dose because it contained only two conditions): *Pa = 0.009; *Pb = 0.015; Pc = 0.11; Pd = 0.054; *Pe = 0.021. i 2nd choice performance for 1st epoch of Rule Switch-blocks in 2 steps condition. *Pa = 0.0342; *Pb = 0.0050; *Pc = 0.044; *Pd = 0.025; *Pe = 0.0047. j 2nd choice commission error for Rule Switch-blocks in 1 step condition. ANOVA revealed no main effect (P > 0.6 for dose; P > 0.4 for epoch). k Same as in j, but for Rule Switch-blocks. Significant main effect for epoch (P = 0.0038, F2,50 = 6.26) but not for dose (P > 0.3) with post hoc comparisons: *Pa = 0.00042, *Pb = 0.00016, Pc = 0.038, and *Pd = 0.013. n = 3 Rule Switch-blocks each for CNO and saline sessions (b, c). All pairwise comparisons were conducted using a two-sided paired t-test with n = 9 (df, hk) or 8 rats (g). Error bar, SEM (bk). Source data are provided as a Source Data file.
Fig. 3
Fig. 3. Anatomical projections from ACC to M2.
a Anatomical projections from ACC to M2 were visualized using a genetically modified rabies virus system. One to two weeks after helper virus injection in M2 (a cocktail solution of AAV1-synP-FLEX-sTpEpB and pENN.AAV.CaMKII.0.4.Cre.SV40), rabies virus (RVΔG-4mCherry) was injected at the same coordinate. b A coronal section of the virus injection site in M2 (this is a magnified view of a region pointed by the red arrow in panel no. 4 in Supplementary Fig. 8a). Neurons infected by helper virus expressed GFP (coded in green in the image). Scale bar, 0.5 mm. c ACC neurons that were retrogradely infected with rabies virus expressed mCherry (coded in red in the image). Scale bar, 0.5 mm. d Projections from ACC to M2 were validated using AAVretro virus. Sagittal view of rat brain. Rats were injected with AAVretro-pmSyn1-EBFP-cre and AAV5-hSyn-DIO-hM4Di-mCherry viruses in M2 and ACC, respectively. e ACC neurons that were infected with AAVretro virus expressed mCherry (coded in red in the image) after Cre recombination. Scale bar, 0.5 mm.
Fig. 4
Fig. 4. Chemogenetic silencing of ACC neuronal terminals in M2 disrupted animals’ choice performance.
a Group result of 2nd choice performance in 2 steps condition with a local infusion of either saline or CNO solution. b Same as in a, but %2nd choice omission error for trials in 1st block (i.e., non-rule switching block). c Same as in a and b, but %2nd choice omission error for trials in Rule Switch-blocks. d 2nd choice performance was plotted separately for three epochs in the 1st block for sessions with a local infusion of saline or CNO solution. Thick red and blue lines represent across-animal averages of CNO and saline conditions, respectively (n = 5 rats). Thin lines represent individual animals. 1st, 2nd, and 3rd epochs correspond to 1–18th, 19–36th, and 37–55th trials. Neither CNO dose nor epoch in 2 steps rule block showed a main effect (P > 0.2 for CNO dose and P > 0.9 for epoch). e Same format as in d, but for Rule Switch-blocks. CNO dose showed a significant main effect (P = 0.00402, F1,26 = 9,969) while epoch did not (P > 0.3). Post hoc comparisons were conducted using paired t-test (two-sided) with Bonferroni’s correction across epochs (such correction was not conducted for dose because there are only two conditions, i.e., saline and CNO conditions). *P = 0.0483. f 2nd choice performance in 2 steps condition (%2nd choice omission error) was plotted separately for 1–6th, 7–12th, and 13–18th trials in the 1st epoch of Rule Switch-blocks. *P = 0.0432. g Average number of 2nd choice commission error per trial was plotted separately for three epochs in Rule Switch-blocks of 1 step condition. Repeated measures two-way ANOVA with both CNO dose and epoch being within-subject factors revealed no main effect of CNO (P > 0.8). Epoch showed a moderate effect but did not reach statistical significance (P = 0.105, F2,26 = 2.461, n = 5 rats). All pairwise comparisons were conducted using a two-sided paired t-test with n = 5 rats (ac, e, f). Error bars, SEM (ag). Source data are provided as a Source Data file.
Fig. 5
Fig. 5. Chemogenetic silencing of ACC decreased firing rate during pre-choice period in M2 neurons.
a Ipsilateral and contralateral sides viewed from a rat’s cerebral hemisphere in which M2 single-unit activity was measured. Rats were implanted with Utah array electrodes in M2 of either left or right hemisphere and neural activity was measured during their task performance with IP injections of saline or CNO solutions (20 mg/kg). In the following analysis, trials were classified according to which side port (ipsilateral or contralateral) rats chose as their 1st choices. b Peri-event time histogram (PETH) of a representative single-unit showing rule selective responses before making a correct response to the side port that was located on the ipsilateral side of neural activity measurements (ipsilateral condition). In 1 step condition (blue line), the rat made a choice of the ipsilateral port while, in 2 steps condition (red line), the rat made its 1st choice of the ipsilateral port and then made its 2nd choice of the contralateral port. Only trials in Rule Switch-blocks were used for constructing the PETH. Orange bar at the top, a 1-s period immediately before rat’s entry to the ipsilateral port (pre-choice period). The center of the band, mean. c Same as in b, but PETH was calculated using trials in which the rat made a correct response to the side port that was located on the contralateral side of neural activity measurements (contralateral condition). d PETH of a single-unit measured in a session in which the rat received an IP injection of CNO solution. e Same as in d, but for contralateral condition. f Population result of firing rate during the pre-choice period (all the correct trials in 1 step and 2 steps conditions were combined). Box-and-whisker plots indicate the minimum, 25th, 50th, 75th percentiles, and maximum excluding outliers (i.e., 1.5 times greater than the interquartile range). *P = 4.8 × 10−7; Mann–Whitney test (two-sided; n = 594 and n = 306 single-units for saline and CNO conditions, respectively). Shaded bands, 95% confidence intervals (be). Source data are provided as a Source Data file.
Fig. 6
Fig. 6. Chemogenetic silencing of ACC decreased rule selectivity in M2 neurons.
a Time course of rule selectivity of a representative M2 single-unit (the same single-unit shown in Fig. 5b, c) for ipsilateral condition. Rule selectivity was quantified by applying ROC analysis to the distributions of mean firing rates during pre-choice period in trials of Rule Switch-blocks of 1 step and 2 steps conditions (see Methods for details). Gray line represents a 95% percentile level estimated by shuffled data in which we randomly shuffled rule labels for trials (1 step or 2 steps conditions) before calculating the area under ROC curve. Error bar, SEM. b Same as in a, but for contralateral condition. c Population-averaged time course of rule selectivity in ipsilateral condition. Blue, saline solution. Red, CNO solution. Shaded bands, SEM. d Same as in c, but for contralateral condition. Shaded bands, SEM. e Comparison of rule selectivity between CNO and saline conditions and across three epochs in Rule Switch-blocks (1st epoch, 1–18th trials; 2nd epoch, 17–36th trials; 3rd epoch, 37–55th trials). See Methods for details of calculating rule selectivity in each epoch. A repeated measures two-way ANOVA (with epoch being a within-subject factor) was conducted for the ipsilateral condition with rule switches from 1→2 steps conditions. No interaction was found between CNO dose and epoch in the ipsilateral choice (1→2 steps rules) condition (P > 0.4). A significant main effect of CNO dose was detected (F1,1833 = 12.7, P = 3.7 × 10−4), but not for epoch (P > 0.7). Post hoc comparison using two independent samples t-test showed significant differences between saline and CNO solutions in 1st and 2nd epochs. No significant interaction or main effect was detected for other three conditions (i.e., ipsilateral condition with rule switches from 2→1 steps conditions, contralateral condition with rule switches from 1→2 steps conditions, and contralateral condition with rule switches from 2→1 steps conditions). ***P = 4.4 × 10−4. *P = 0.036. n = 437 and n = 195 single-units for saline and CNO conditions, respectively. Error bar, SEM. Source data are provided as a Source Data file.
Fig. 7
Fig. 7. Chemogenetic silencing of ACC increased firing rate of negative outcome-encoding M2 neurons upon rule switches.
a Each M2 neuron (n = 594 neurons and 306 neurons for saline and CNO conditions, respectively) was classified based on its activity during the outcome feedback period, i.e., positive outcome-activated neurons, positive outcome-suppressed neurons, negative outcome-activated neurons, and positive negative-suppressed neurons (see Methods for details). The proportion of positive outcome-activated neurons was smaller in CNO condition than in saline condition (13.1% vs 20.3%, χ2 = 6.73, P = 0.009) while that of positive outcome-suppressed neurons was greater in CNO condition than in saline condition (48.4% vs 35.5%, χ2 = 13.9, P = 0.00019). Similarly, the proportion of negative outcome-activated neurons was smaller in CNO condition than in saline condition (6.9% vs 11.1%, χ2 = 4.17, P = 0.041) while that of negative outcome-suppressed neurons was smaller in CNO condition than in saline condition but was not statistically significant (19.9% vs 15.7%, χ2 = 2.61, P = 0.106). b Population-averaged PETHs of positive outcome-activated neurons (top left, n = 66), positive outcome-suppressed neurons (top right, n = 66), negative outcome-activated neurons (bottom left, n = 19), negative outcome-suppressed neurons (bottom right, n = 21). Red, CNO (IP, 20 mg/kg). Blue, saline. Thick and thin lines represent 1st and 2nd/3rd epochs in 2 steps condition, respectively. c Mean firing rate of each negative outcome-activated neuron was calculated for a 3 s period starting from the onset of error feedback tone presentation in incorrect 2nd choice trials, and was compared between 1st and 2nd/3rd epochs in Rule Switch-blocks of 2 steps condition. A significant difference was found between 1st and 2nd/3rd epochs in CNO condition (n = 19 neurons; median, 9.23 spikes s−1 vs 6.86 spikes s−1; *P = 0.018, two-sided signed rank test) while no difference was found in saline condition (n = 66 neurons; median, 5.41 spikes s−1 vs 5.17 spikes s−1; n.s., P = 0.53, two-sided signed rank test). Box-and-whisker plots indicate the minimum, 25th, 50th, 75th percentiles, and maximum. Source data are provided as a Source Data file.
Fig. 8
Fig. 8. Optogenetic silencing of ACC neurons during outcome feedback period following animals’ 2nd choices.
a Histological section for halorhodopsin (eNpHR3.0) expression in ACC. Green, eNpHR3.0-eYFP expression. Blue, DAPI. White dotted line shows reconstructed positions of fiberoptic implants. Scale bar, 500 μm. b Suppression of spiking activity by 561 nm light delivery. Top left, raster plot of a representative single-unit measured in ACC showing spiking activities before, during, and after laser light delivery. Top right, example waveforms of the representative single-unit. Bottom left, peri-event time histogram sorted by the timing of light onset. Bin width, 50 ms. c Optogenetic silencing of ACC after animal’s incorrect 2nd choices (i.e., 2nd choice omission errors). Light was delivered for 4 s after animals pushing the center lever instead of correctly poking the side port opposite to the 1st choice. d Optogenetic silencing of ACC after animal’s correct 2nd choices. Light was delivered for 4 s after a correct 2nd choice (i.e., animals poking the side port opposite to the 1st choice). Source data are provided as a Source Data file.
Fig. 9
Fig. 9. Optogenetic silencing of ACC neurons upon incorrect 2nd choices induced sequential choice errors in the immediately subsequent trials that followed rule switches.
a Task performance chart of a representative session in which light was delivered upon incorrect 2nd choices in Rule Switch-block. Green bar, light delivery. Small circle, correct trial. Asterisk, 1st choice error. Large circle filled with an asterisk, 2nd choice omission error. Blue and red represent two distinct tone cues. Gray dotted lines show borders separating three epochs in each block (1–18th, 19–36th, and 37–55 trials for 1st, 2nd and 3rd epochs, respectively). b 2nd choice performance was plotted for trials that immediately followed a 2nd choice omission error trial. On and Off represent trials in which light was delivered and not delivered, respectively. The performance was plotted for each of the three epochs separately. *P = 0.0201 for 1st epoch, P = 0.575 and 0.391 for 2nd and 3rd epochs, respectively (two-sided two samples t-test, n = 4 rats). Error bar, SEM. c Light was delivered for 4 s after correct 2nd choices instead of incorrect 2nd choices (see Fig. 8d). 2nd choice performance was plotted for trials that immediately followed a 2nd choice omission error trial. P = 0.544, 0.780 and 0.641 for each epoch, respectively. Two samples t-test (two-sided), n = 4 rats. Error bar, SEM. d Same as in b, but 1st choice performance was plotted for trials that immediately followed a 2nd choice omission error trial in which a light was delivered upon incorrect 2nd choices (On condition) or not delivered (Off condition). P = 0.212, 0.598 and 0.913 for each epoch, respectively. Two samples t-test (two-sided), n = 5 rats. Error bar, SEM. e Same as in c, but 1st choice performance was plotted for trials that immediately followed a 2nd choice omission error trial in which light was delivered upon correct 2nd choices (On condition) or not delivered (Off condition). P = 0.640, 0.503 and 0.587 for each epoch, respectively. Two samples t-test (two-sided), n = 5 rats. Error bar, SEM. Source data are provided as a Source Data file.
Fig. 10
Fig. 10. Possible mechanisms of how silencing of ACC neurons affects animals’ task-switching performance by modulating rule representations in M2 circuit.
a A possible ACC-M2 circuit in which silencing of ACC neurons decreases the activity of outcome-encoding M2 neurons (positive outcome-activated neurons, positive outcome-suppressed neurons, and negative outcome-suppressed neurons; see Fig. 7b for their activity profiles). Red down arrow indicates a decrease in activity. b A possible ACC-M2 circuit in which silencing of ACC neurons enhances the activity of negative outcome-activated M2 neurons (see Fig. 7b, c for its activity profile). In this circuit model, when ACC neurons are silenced, a disinhibition mechanism in M2 increases the activity of negative outcome-activated M2. Red upward or downward arrow indicates an increase or a decrease in activity, respectively. c An evidence accumulation model describing how silencing of ACC neurons can affect an animal’s rule switch performance. In this model, an animal updates the choice rule (i.e., 1 step or 2 steps rule) when the evidence for the new rule crosses a certain threshold level. The evidence for the new rule can increase stepwise every time the animal receives an outcome feedback after the animal makes 2nd choice. When ACC neurons are not silenced, after the animal experiences several error trials upon rule switches, the evidence for the new rule can cross the threshold, enabling the animal to make a rule switch (blue). In contrast, when ACC neurons are silenced, the step size of evidence accumulation for the new rule decreases, thus requiring more evidence accumulation (i.e., outcome feedback) before it crosses the threshold (red). Down arrows represent trial positions at which the evidence for the new rule crosses the threshold (blue, saline; red, CNO). d Format is the same as in c, but, in this model, instead of decreasing the step size of evidence accumulation, a silencing of ACC neurons pushes up the threshold for rule updating, thus requiring more evidence accumulation for threshold crossing. Blue and red dotted lines, threshold for rule updating in saline and CNO conditions, respectively.

References

    1. Lashley, K. S. The problem of serial order in behavior. In Cerebral Mechanisms in Behavior (ed. Jeffress, L. A.) 112–146 (Wiley, New York, 1951).
    1. Evarts, E. V., Shinoda, Y. & Wise, S.P. Neurophysiological Approaches to Higher Brain Functions (Wiley, New York, 1984).
    1. Passingham, R. The Frontal Lobes and Voluntary Action (Oxford University Press, Oxford, 1993).
    1. Wise SP, Weinrich M, Mauritz KH. Motor aspects of cue-related neuronal activity in premotor cortex of the rhesus monkey. Brain Res. 1983;260:301–305. doi: 10.1016/0006-8993(83)90685-6. - DOI - PubMed
    1. Tanji J, Shima K. Role for supplementary motor area cells in planning several movements ahead. Nature. 1994;371:413–416. doi: 10.1038/371413a0. - DOI - PubMed

Publication types