. 2022 Aug 4;13(1):4489.
doi: 10.1038/s41467-022-32235-x.

Homotypic and heterotypic immune responses to Omicron variant in immunocompromised patients in diverse clinical settings

Affiliations

Homotypic and heterotypic immune responses to Omicron variant in immunocompromised patients in diverse clinical settings

Victor H Ferreira et al. Nat Commun. .

Abstract

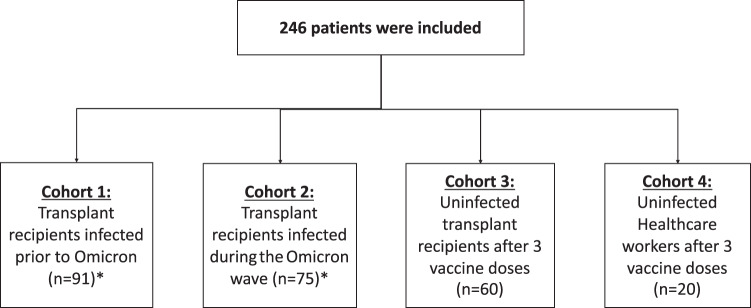
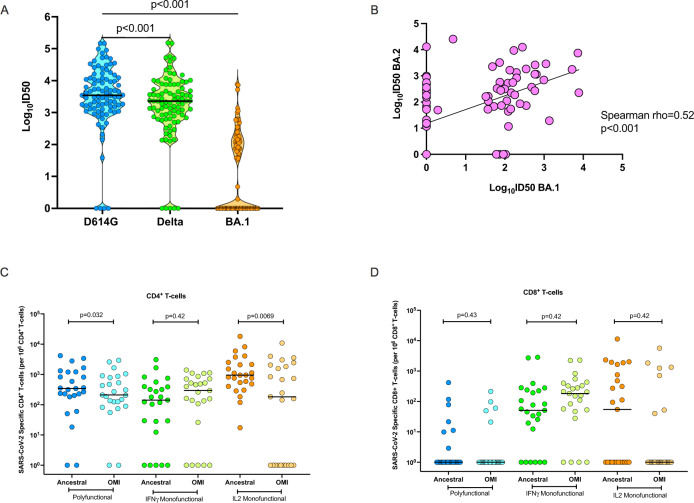
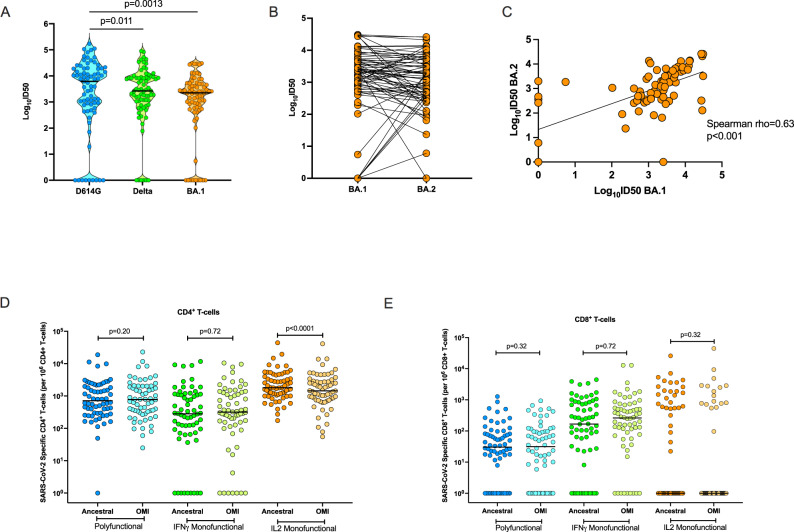
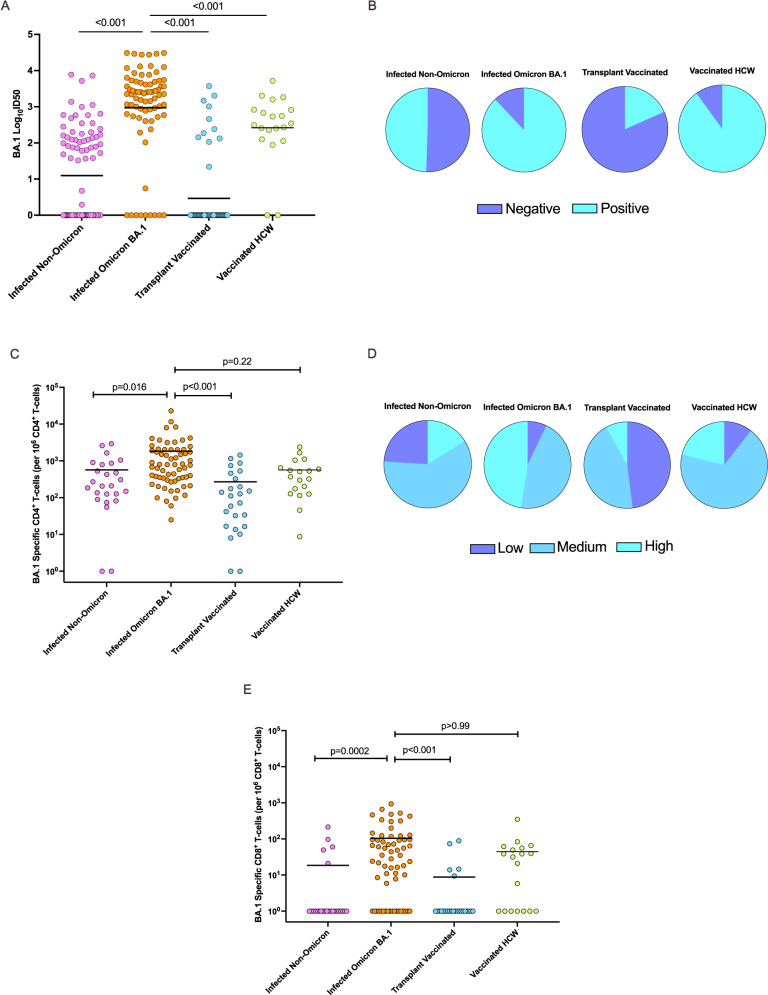
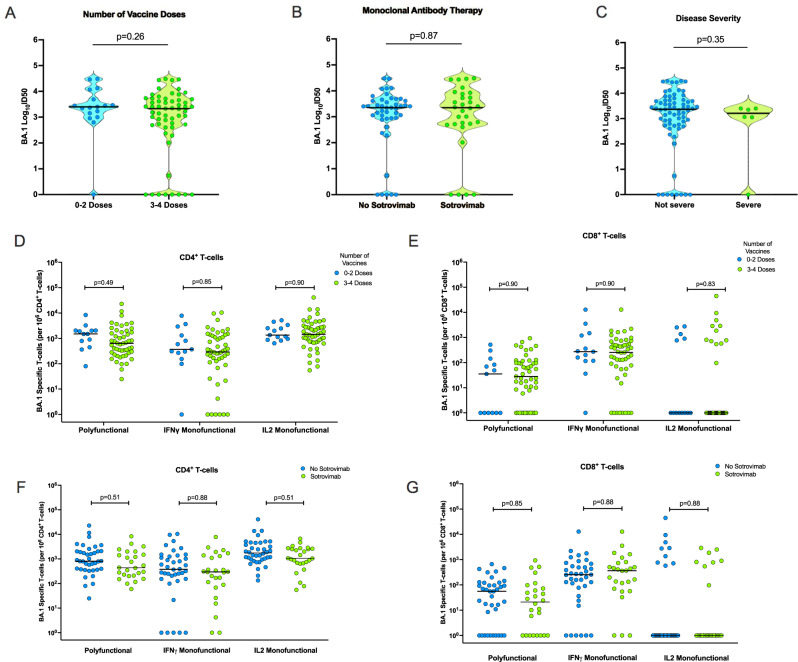
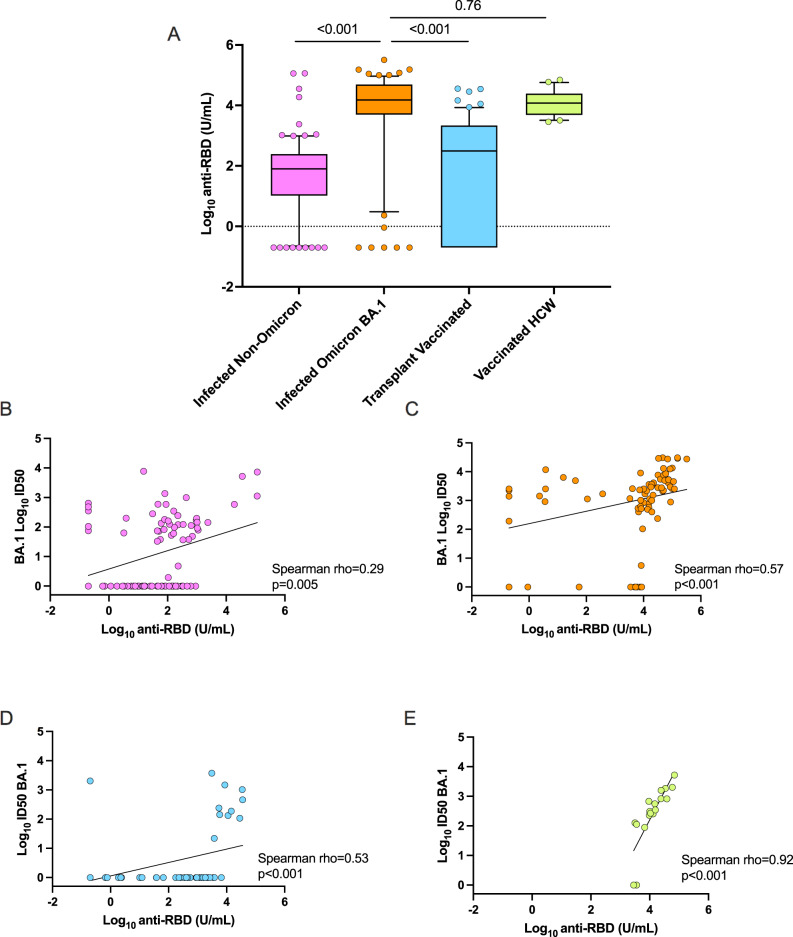
Immunocompromised patients are predisposed to severe COVID-19. Here we compare homotypic and heterotypic humoral and cellular immune responses to Omicron BA.1 in organ transplant patients across a diverse clinical spectrum. We perform variant-specific pseudovirus neutralization assays for D614G, and Omicron-BA.1, -BA.2, and Delta variants. We also measure poly-and monofunctional T-cell responses to BA.1 and ancestral SARS-CoV-2 peptide pools. We identify that partially or fully-vaccinated transplant recipients after infection with Omicron BA.1 have the greatest BA.1 neutralizing antibody and BA.1-specific polyfunctional CD4+ and CD8+ T-cell responses, with potent cross-neutralization against BA.2. In these patients, the magnitude of the BA.1-directed response is comparable to immunocompetent triple-vaccinated controls. A subset of patients with pre-Omicron infection have heterotypic responses to BA.1 and BA.2, whereas uninfected transplant patients with three doses of vaccine demonstrate the weakest comparative responses. These results have implications for risk of infection, re-infection, and disease severity among immune compromised hosts with Omicron infection.


Conflict of interest statement

D.K. has received research grant from Roche, GSK, and advisory fees from Roche, GSK, Sanofi, Merck and Exevir. A.H. has received research grants from Roche and Merck and advisory fees from Merck and Takeda. A.C.G. has received research funds from a research contract with Providence Therapeutics Holdings, Inc for other projects. No other authors have competing interests to disclose.

Figures

Fig. 1
Fig. 1. Flow diagram of the study.
A total of 246 participants were included in the study. Cohort 1 (n = 91) consisted of transplant recipients infected with ancestral SARS-CoV-2 (n = 71), Alpha (n = 17), Delta (n = 2), or unknown (n = 1). Cohort 2 (n = 75) includes transplant recipients recovered from natural infection during the Omicron-BA.1 wave. Cohort 3 (n = 60) consisted of uninfected transplant patients who received three doses of mRNA-1273 (Moderna) vaccine. Cohort 4 (n = 20) was included as a control group and included immunocompetent healthcare workers who received three doses of BNT162b2 (Pfizer–BioNTech) vaccine.
Fig. 2
Fig. 2. Immune response against ancestral SARS-CoV-2, Delta, and Omicron BA.1 in transplant recipients with non-Omicron SARS-CoV-2 infection (Cohort 1).
A Violin dot plots of the 50% neutralization titers (log10ID50) of neutralizing antibodies against D614G, Delta, and Omicron-BA.1 variants, in transplant recipients infected with non-Omicron variant (primarily ancestral SARS-CoV-2). Each circle represents an individual patient neutralization titer. Horizontal lines represent median values. P values were determined using a two-sided Wilcoxon matched-pairs signed-rank test (D614G vs. Delta p < 0.001, D614G vs. BA.1 p < 0.001). B Scatter plot correlation between the log10ID50 of neutralizing antibody titers against Omicron-BA.1 (x-axis) and Omicron-BA.2 (y-axis) in all patients in Cohort 1 (n = 91). A two-tailed Spearman correlation was performed p < 0.001). The diagonal line represents the best-fit linear regression line. C Proportions of polyfunctional (IFN-γ+ and IL-2+), IFN-γ monofunctional and IL-2 monofunctional CD4+ and D CD8+ T cells in transplant recipients recovered from non-Omicron variant infection (subset of Cohort 1, n = 25). Horizontal lines denote the median for each group. A two-sided Wilcoxon matched-pairs signed-rank test with Holm–Šídák correction for multiple comparisons was used. Adjusted P values are shown above each respective comparison. SARS-CoV-2 severe acute respiratory syndrome Coronavirus-2, OMI omicron, IFN-γ interferon gamma, IL-2 interleukin 2. Source data are provided as a Source Data file.
Fig. 3
Fig. 3. Immune response against ancestral SARS-CoV-2, Delta, and Omicron BA.1 in transplant recipients with Omicron-BA.1 infection.
A Violin dot plots of the 50% neutralization titers (log10ID50) of neutralizing antibodies against D614G, Delta, and Omicron BA.1, in transplant recipients post-BA.1 infection (n = 75). Each circle represents an individual patient antibody titer. Horizontal lines represent median values. The p value of the difference was estimated using a two-sided Wilcoxon matched-pairs signed-rank test. B Paired BA.1 and BA.2 directed neutralizing responses in all patients from the same cohort (n = 75). C Scatter plot showing two-tailed Spearman correlation between the log10ID50 of neutralizing antibody titers against Omicron BA.1 (x-axis) and BA.2 (y-axis) in cohort 2 (n = 75; p < 0.001). Diagonal line represents the best-fit linear regression line. Proportions of polyfunctional, IFN-γ monofunctional and IL-2 monofunctional CD4+ T cells (D) and E CD8+ T cells in a subset (n = 64) transplant recipients with Omicron-BA.1 infection. Horizontal lines denote the median for each group. A two-sided Wilcoxon matched-pairs signed-rank test with Holm–Šídák correction for multiple comparisons was used. Adjusted P values are shown above each respective comparison. SARS-CoV-2 severe acute respiratory syndrome Coronavirus-2, OMI omicron, IFN- γ interferon gamma, IL-2 interleukin 2. Source data are provided as a Source Data file.
Fig. 4
Fig. 4. Comparison of the immune response against Omicron variant between cohorts.
A Dot plots of the Omicron BA.1 50% neutralization titers (log10ID50) of neutralizing antibodies across cohorts. Each circle represents an individual participant’s neutralization titer. Cohort 1: n = 91, Cohort 2: n = 75, Cohort 3: n = 60, Cohort 4: n = 20. Horizontal lines represent median values. A two-sided Kruskal–Wallis test and post hoc Dunn’s pairwise test was used. P values are shown above each respective comparison: Cohort 1 vs. 2 p < 0.001, Cohort 1 vs. 3 p < 0.001, Cohort 2 vs. Cohort 4 p < 0.001. B Pie-graphs showing proportions of positive and negative BA.1 neutralization for each cohort. C Omicron BA.1-specific polyfunctional CD4+ T cells frequencies across groups. Each circle represents a participant’s T-cell frequency. Cohort 1 n = 25, Cohort 2 n = 64, Cohort 3 n = 25, Cohort 4 n = 19. Horizontal lines denote median values. A two-sided Kruskal–Wallis test with Dunn’s test for multiple comparisons was used. P values are shown above each respective comparison: Cohort 1 vs. 2 p = 0.016, Cohort 1 vs. 3 p < 0.001, Cohort 2 vs. Cohort 4 p = 0.22. D Pie-graphs showing proportions of low (<100 per 106), medium (100–1000 per 106), and high (>1000 per 106) BA.1-specific CD4+ T-cell frequencies for each cohort. E Omicron BA.1-specific polyfunctional CD8+ T cells frequencies across groups. Each circle represents a participant’s T-cell frequency. Cohort 1 n = 25, Cohort 2 n = 64, Cohort 3 n = 25, Cohort 4 n = 19. Horizontal lines denote median values. A two-sided Kruskal–Wallis test with Dunn’s test for multiple comparisons was used. P values are shown above each respective comparison: Cohort 1 vs. 2 p < 0.001, Cohort 1 vs. 3 p < 0.001, Cohort 2 vs. Cohort 4 p > 0.99. HCW healthcare worker. Source data are provided as a Source Data file.
Fig. 5
Fig. 5. Comparison of the immune response to Omicron BA.1 in transplant patients with BA.1 infection by vaccination status, monoclonal antibody therapy, and severity of disease.
A Violin dot plots of the 50% neutralization titers (log10ID50) of BA.1 specific neutralizing antibodies in transplant recipients with Omicron-BA.1 infection, organized according to number of vaccine doses, 0–2 vs. 3–4; (B) use of monoclonal antibody therapy (sotrovimab); and C severity of disease, defined as requiring oxygen therapy. Horizontal lines represent median values. The p value of the difference between subgroups was estimated using two-sided Mann–Whitney U test. D, F Proportions of BA.1-specific polyfunctional, IFN-γ monofunctional and IL-2 monofunctional CD4+ T cells, and E, G BA.1-specific CD8+ T cells in transplant recipients with Omicron-BA.1 infection (n = 64), organized according to number of vaccine doses received prior to infection (D, E) or use of sotrovimab (F, G). Horizontal lines denote the median for each group. A two-sided Mann–Whitney U test with Holm–Šídák correction for multiple comparisons was used. Adjusted P values are shown above each respective comparison. IFN-γ interferon gamma, IL-2 interleukin 2. Source data are provided as a Source Data file.
Fig. 6
Fig. 6. Anti-receptor binding domain (RBD) binding antibody level response by cohort.
A Box and whisker plots of the log10RBD binding antibody titer by cohort. In each box, the horizontal line represents the median value, with the bottom and the top of the box indicating the 25 and 75th percentile, respectively. Cohort 1: n = 90, Cohort 2: n = 75, Cohort 3: n = 60, Cohort 4: n = 20. Circles represent outside values (individual patients with antibody titers far from the rest). A two-sided Kruskal–Wallis test and post hoc Dunn’s pairwise test was used to compare the BA.1 infected cohort with the other cohorts. P values are shown above each respective comparison: Cohort 1 vs. 2 p < 0.001, Cohort 1 vs. 3 p < 0.001, Cohort 2 vs. 4 p = 0.76. BE Scatter plots showing two-tailed Spearman correlation between the log10ID50 of neutralizing antibody titers against Omicron BA.1 (y-axis) and the log10 anti-RBD level in U/mL (x-axis) in each cohort: (B) infected non-Omicron, p = 0.005; (C) infected BA.1, p < 0.001; (D) three-dose vaccinated transplant patients uninfected, p < 0.001; and E three-dose vaccinated healthcare workers, p < 0.001. Diagonal lines represent the best-fit linear regression line. Source data are provided as a Source Data file.

Similar articles

Cited by

References

    1. Goldman, J. D., Robinson, P. C., Uldrick, T. S. & Ljungman, P. COVID-19 in immunocompromised populations: implications for prognosis and repurposing of immunotherapies. J. Immunother. Cancer. 9, e002630 (2021). - PMC - PubMed
    1. Marinelli T, et al. Prospective clinical, virologic, and immunologic assessment of COVID-19 in transplant recipients. Transplantation. 2021;105:2175–83. doi: 10.1097/TP.0000000000003860. - DOI - PMC - PubMed
    1. Pereira MR, et al. Outcomes of COVID-19 in solid organ transplant recipients: a matched cohort study. Transpl. Infect. Dis. 2021;23:e13637. - PMC - PubMed
    1. Hall VG, et al. Randomized trial of a third dose of mRNA-1273 vaccine in transplant recipients. N. Engl. J. Med. 2021;385:1244–1246. doi: 10.1056/NEJMc2111462. - DOI - PMC - PubMed
    1. Werbel WA, et al. Safety and immunogenicity of a third dose of SARS-CoV-2 vaccine in solid organ transplant recipients: a case series. Ann. Intern. Med. 2021;174:1330–1332. doi: 10.7326/L21-0282. - DOI - PMC - PubMed

Publication types

Supplementary concepts