

Game-theoretic link relevance indexing on genome-wide expression dataset identifies putative salient genes with potential etiological and diapeutics role in colorectal cancer
- PMID: 35927308
- PMCID: PMC9352798
- DOI: 10.1038/s41598-022-17266-0
Game-theoretic link relevance indexing on genome-wide expression dataset identifies putative salient genes with potential etiological and diapeutics role in colorectal cancer
Abstract
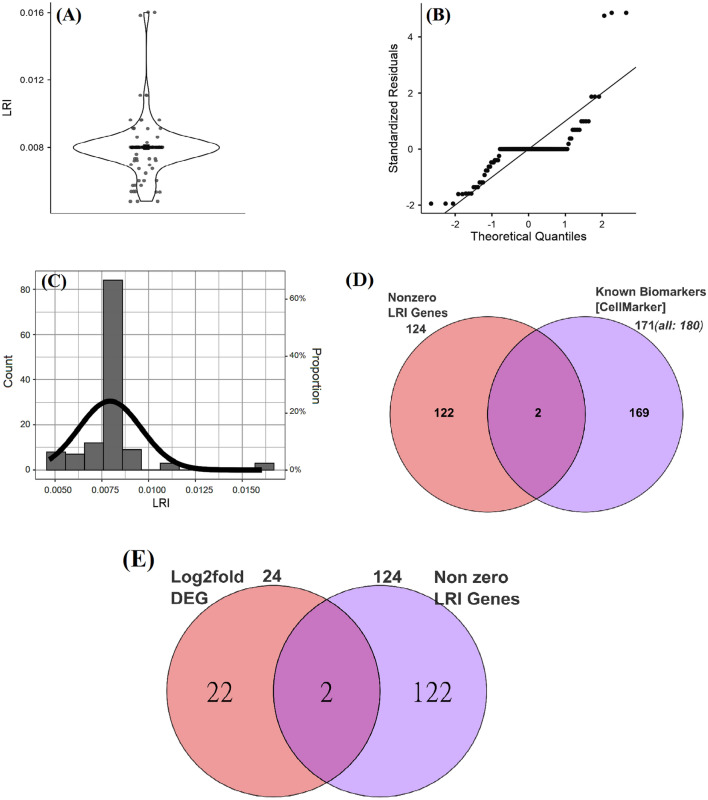
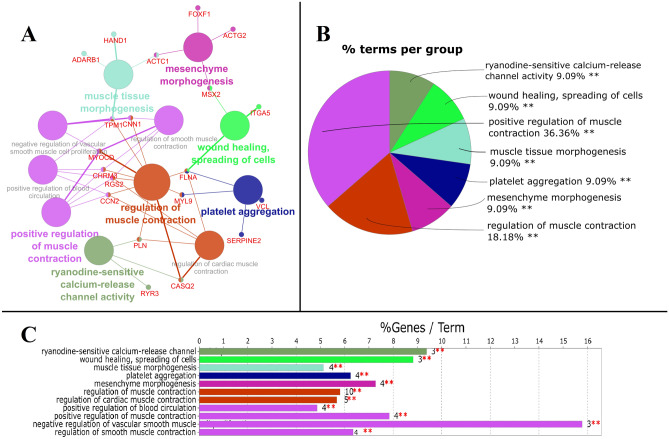
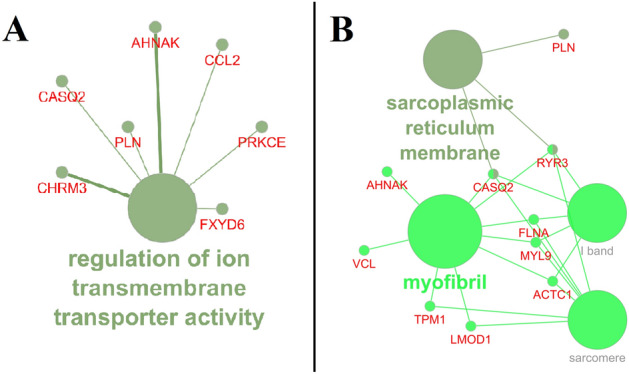
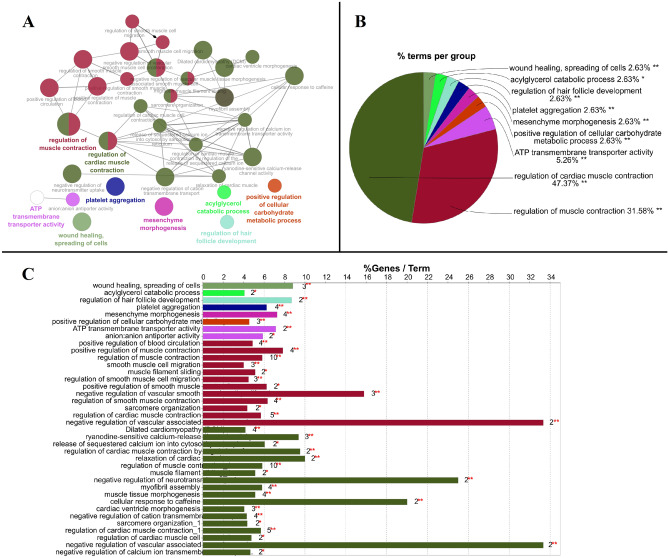
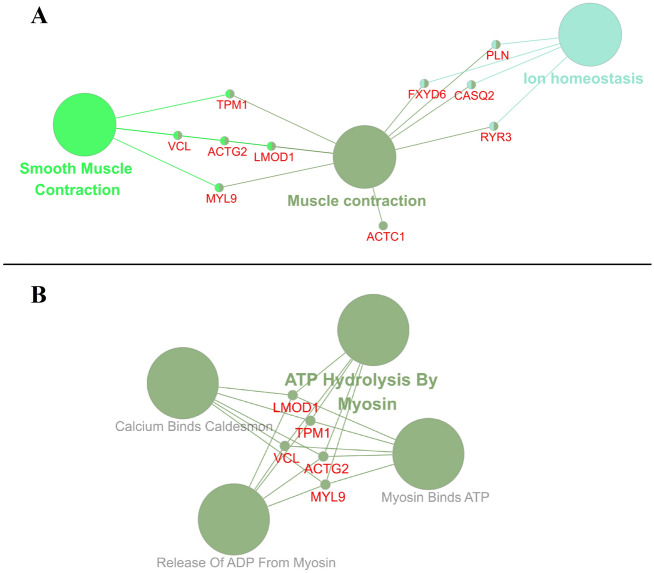
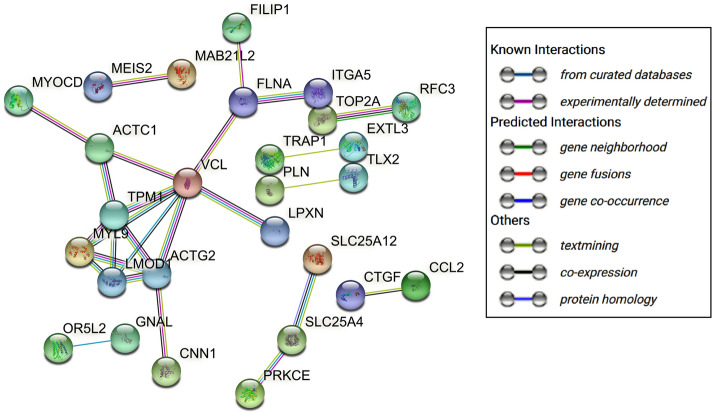
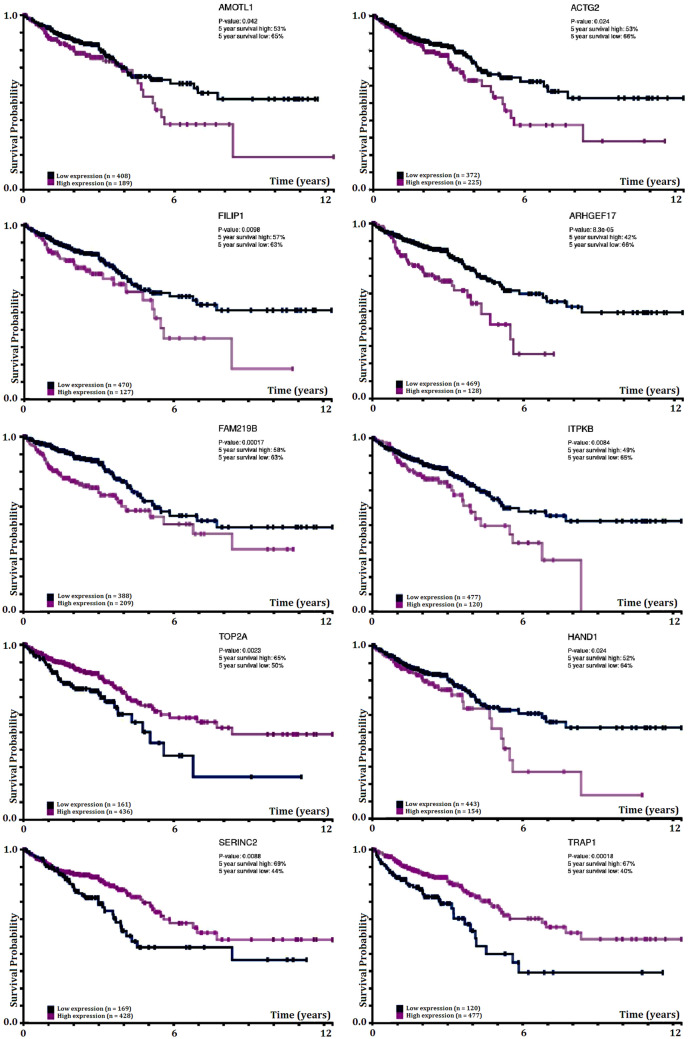
Diapeutics gene markers in colorectal cancer (CRC) can help manage mortality caused by the disease. We applied a game-theoretic link relevance Index (LRI) scoring on the high-throughput whole-genome transcriptome dataset to identify salient genes in CRC and obtained 126 salient genes with LRI score greater than zero. The biomarkers database lacks preliminary information on the salient genes as biomarkers for all the available cancer cell types. The salient genes revealed eleven, one and six overrepresentations for major Biological Processes, Molecular Function, and Cellular components. However, no enrichment with respect to chromosome location was found for the salient genes. Significantly high enrichments were observed for several KEGG, Reactome and PPI terms. The survival analysis of top protein-coding salient genes exhibited superior prognostic characteristics for CRC. MIR143HG, AMOTL1, ACTG2 and other salient genes lack sufficient information regarding their etiological role in CRC. Further investigation in LRI methodology and salient genes to augment the existing knowledge base may create new milestones in CRC diapeutics.
© 2022. The Author(s).
Conflict of interest statement
The authors declare no competing interests.
Figures
Similar articles
-
COADREADx: A comprehensive algorithmic dissection of colorectal cancer unravels salient biomarkers and actionable insights into its discrete progression.PeerJ. 2024 Oct 28;12:e18347. doi: 10.7717/peerj.18347. eCollection 2024. PeerJ. 2024. PMID: 39484215 Free PMC article.
-
Identification of a five-gene signature with prognostic value in colorectal cancer.J Cell Physiol. 2019 Apr;234(4):3829-3836. doi: 10.1002/jcp.27154. Epub 2018 Aug 21. J Cell Physiol. 2019. PMID: 30132881
-
Long non-coding RNA profile study identifies a metabolism-related signature for colorectal cancer.Mol Med. 2021 Aug 3;27(1):83. doi: 10.1186/s10020-021-00343-x. Mol Med. 2021. PMID: 34344319 Free PMC article.
-
Identification of Genes Related to Clinicopathological Characteristics and Prognosis of Patients with Colorectal Cancer.DNA Cell Biol. 2020 Apr;39(4):690-699. doi: 10.1089/dna.2019.5088. Epub 2020 Feb 6. DNA Cell Biol. 2020. PMID: 32027181
-
The clinical relevance of gene expression based prognostic signatures in colorectal cancer.Biochim Biophys Acta Rev Cancer. 2021 Apr;1875(2):188513. doi: 10.1016/j.bbcan.2021.188513. Epub 2021 Jan 22. Biochim Biophys Acta Rev Cancer. 2021. PMID: 33493614 Review.
Cited by
-
An Integrative Multi-Omics Random Forest Framework for Robust Biomarker Discovery.bioRxiv [Preprint]. 2025 Mar 6:2025.03.05.641533. doi: 10.1101/2025.03.05.641533. bioRxiv. 2025. PMID: 40093058 Free PMC article. Preprint.
References
-
- Sung H, et al. Global cancer statistics 2020: GLOBOCAN estimates of incidence and mortality worldwide for 36 cancers in 185 countries. CA Cancer J. Clin. 2021;71:209–249. - PubMed
Publication types
MeSH terms
Substances
LinkOut - more resources
Full Text Sources
Medical
