. 2022 Oct;6(10):1458-1470.
doi: 10.1038/s41559-022-01838-4. Epub 2022 Aug 4.

Global patterns and rates of habitat transitions across the eukaryotic tree of life

Affiliations

Global patterns and rates of habitat transitions across the eukaryotic tree of life

Mahwash Jamy et al. Nat Ecol Evol. 2022 Oct.

Abstract

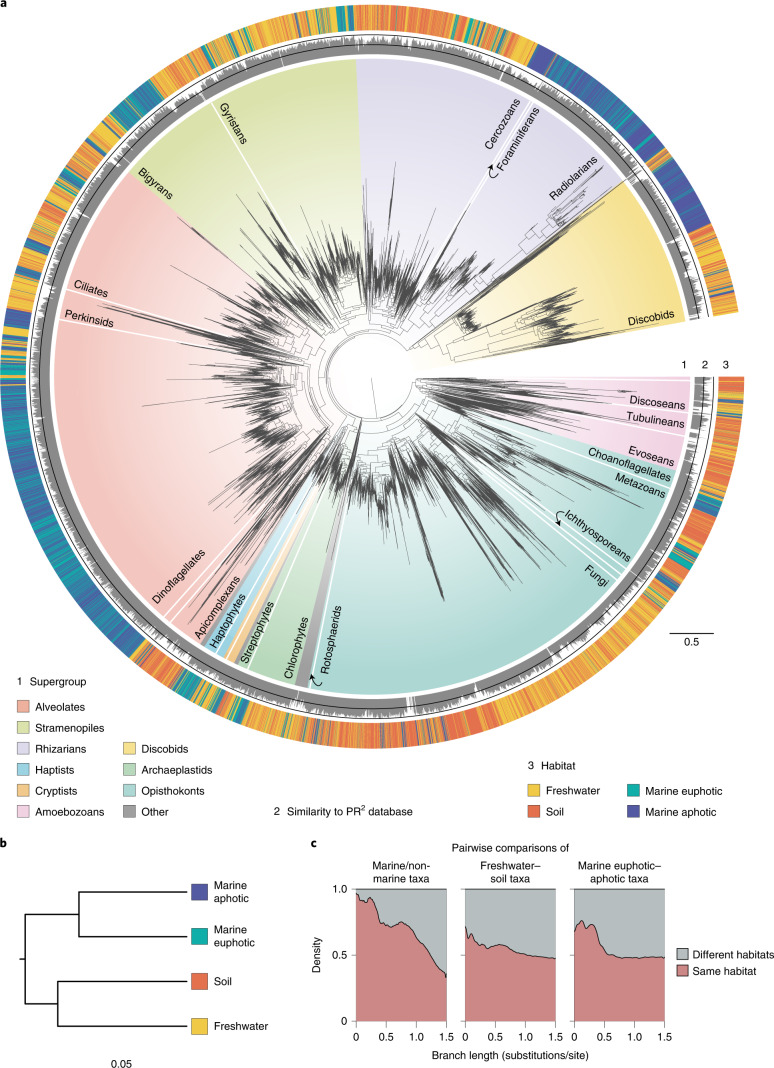
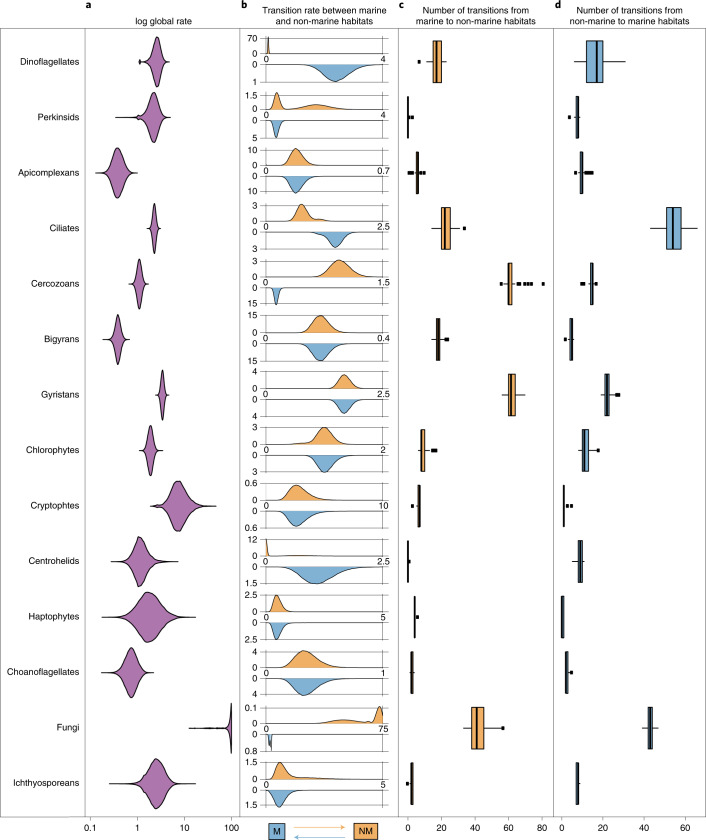
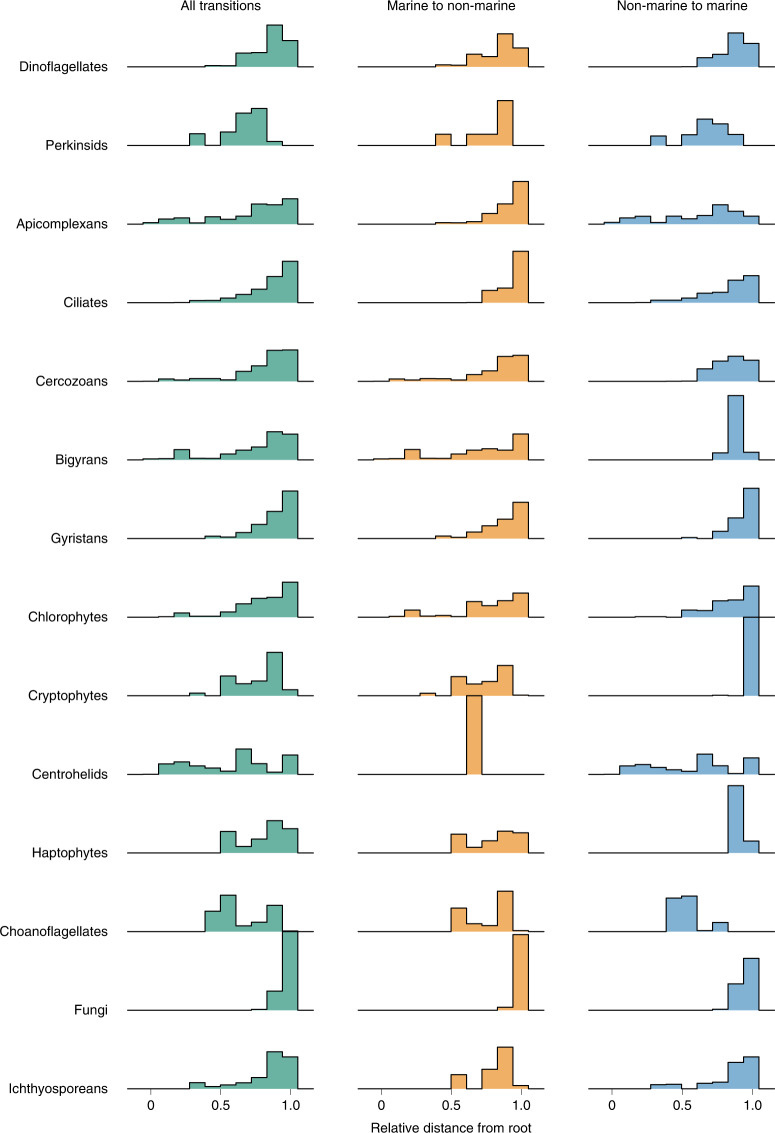
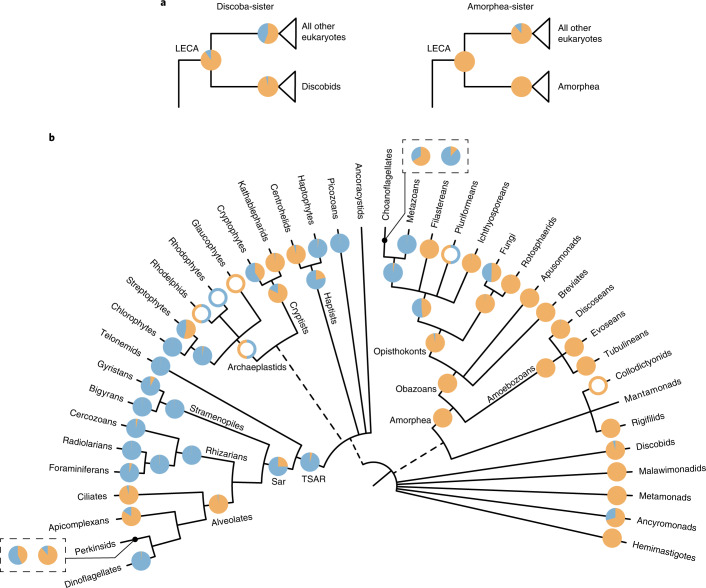
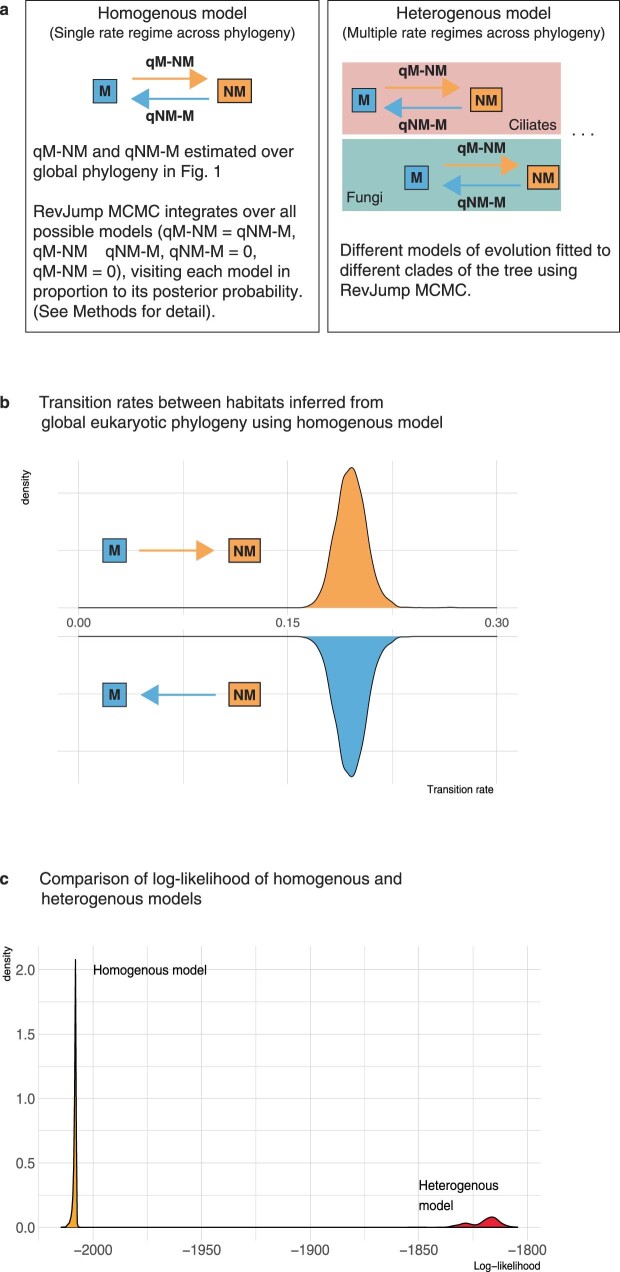
The successful colonization of new habitats has played a fundamental role during the evolution of life. Salinity is one of the strongest barriers for organisms to cross, which has resulted in the evolution of distinct marine and non-marine (including both freshwater and soil) communities. Although microbes represent by far the vast majority of eukaryote diversity, the role of the salt barrier in shaping the diversity across the eukaryotic tree is poorly known. Traditional views suggest rare and ancient marine/non-marine transitions but this view is being challenged by the discovery of several recently transitioned lineages. Here, we investigate habitat evolution across the tree of eukaryotes using a unique set of taxon-rich phylogenies inferred from a combination of long-read and short-read environmental metabarcoding data spanning the ribosomal DNA operon. Our results show that, overall, marine and non-marine microbial communities are phylogenetically distinct but transitions have occurred in both directions in almost all major eukaryotic lineages, with hundreds of transition events detected. Some groups have experienced relatively high rates of transitions, most notably fungi for which crossing the salt barrier has probably been an important aspect of their successful diversification. At the deepest phylogenetic levels, ancestral habitat reconstruction analyses suggest that eukaryotes may have first evolved in non-marine habitats and that the two largest known eukaryotic assemblages (TSAR and Amorphea) arose in different habitats. Overall, our findings indicate that the salt barrier has played an important role during eukaryote evolution and provide a global perspective on habitat transitions in this domain of life.


Conflict of interest statement

The authors declare no competing interests.

Figures

Fig. 1
Fig. 1. Global eukaryotic 18S–28S phylogeny from environmental samples and the distribution of habitats.
a, This tree corresponds to the best maximum-likelihood tree inferred using an alignment with 7,160 sites and the GTRCAT model in RAxML. The tree contains 16,821 OTUs generated from PacBio sequencing of 21 environmental samples (no reference sequences were included). Ring no. 1 around the tree indicates taxonomy of the environmental sequences, with all major eukaryotic lineages considered in this study labelled. Ring no. 2 depicts percentage similarity with the references in the PR2 database as calculated using BLAST and was set with a minimum of 70% with the two black lines in the middle indicating 85% and 100% similarity levels. Ring no. 3 depicts the habitat origin of each OTU. b, Hierarchical clustering of the four habitats based on a phylogenetic distance matrix generated using the unweighted UniFrac method (n = 7, n = 5, n = 4 and n = 5 samples for soil, freshwater, marine euphotic and marine aphotic, respectively). All communities were found to differ significantly from each other using Monte Carlo simulations (Bonferroni-adjusted P < 0.001). c, Stacked density plot of branch lengths between taxa pairs from the same or different habitats (n = 14,977,604 taxa pairs with a maximum patristic distance of 1.5 substitutions/site). Note that this plot should be interpreted with caution as taxa pairs do not represent independent datapoints due to phylogenetic relatedness.
Fig. 2
Fig. 2. Habitat transition rates and number of transition events estimated for each major eukaryotic lineage.
a, Posterior probability distributions of the global rate of habitat evolution, which indicate the overall speed at which transitions between marine and non-marine habitats have occurred in each clade regardless of direction. Rates were estimated along clade-specific phylogenies (Extended Data Fig. 6) using MCMC in BayesTraits with a normalized transition matrix. b, The posterior probability distribution of transition rates from marine to non-marine habitats (top in orange) and from non-marine to marine habitats (below in blue). c,d, Number of transitions from marine to non-marine habitats (c) and in the reverse direction (d) for each clade as estimated by PASTML using maximum likelihood (Methods). The boxplots in c and d show the median as centre line, box sizes indicate the lower (Q1) and upper (Q3) quartiles, whiskers indicate extreme values within 1.5× the interquartile range and dots beyond the whiskers indicate outliers.
Fig. 3
Fig. 3. Ridgeline histogram plots displaying the timing of transition events.
The plots were estimated from relative chronograms obtained with Pathd8 (ref. ). The x axis depicts the relative age for each clade.
Fig. 4
Fig. 4. Ancestral states of major eukaryotic clades as estimated by BayesTraits on a set of 100 global PacBio phylogenies.
Pie charts at each node indicate the posterior probabilities of likelihoods for the character states as follows: blue, marine; orange, non-marine. Nodes with empty circles indicate wherever there was insufficient taxon sampling to infer ancestral habitats but a reasonable estimate could be made from existing literature (Supplementary Note 3). a, Ancestral habitat of the LECA as inferred using two different roots. b, Ancestral states of major eukaryotic lineages. For the two cases where the incorporation of Illumina data inferred a different likely ancestral state, the results are shown in boxes. The pie chart on the right was obtained using the global eukaryotic phylogeny, while the pie chart on the left was obtained from clade-specific phylogenies. The tree is adapted from ref. .
Extended Data Fig. 1
Extended Data Fig. 1. Shared ASVs between PacBio and Illumina sequencing.
Comparison of PacBio and Illumina sequencing. PacBio amplicons were compared with metagenomes (mTags), V4 amplicons, and V9 amplicons from three marine samples corresponding to the pico size fraction from the Malaspina expedition. Station 76|Surface did not have V9 amplicon data. ASVs = Amplicon Sequence Variants. (a) Number of reads and ASVs for each sample for each marker. The mTags represent sequence length of ca. 100 bp, so no ASV level is available, as this short length does not give enough resolution. More PacBio sequences were generated for each sample compared to Illumina sequences. (b) Comparison of PacBio ASVs (that is de-noised, preclustered sequences) with the ones given by V4 amplicons. A similar comparison with V9 ASVs was not carried out as not all samples had V9 Illumina data available. Around half of the sequences were shared, which represented the majority of reads.
Extended Data Fig. 2
Extended Data Fig. 2. Metagenomes versus other sequencing efforts.
Comparison of the eukaryotic communities retrieved by PacBio and Illumina sequencing (V4, V9, and 18 S reads retrieved from metagenomic data) of three marine samples (See Extended Data Fig. 1). (a) Comparison of mTags (which should represent a snapshot of the community unbiased by PCR) with the other datasets. Groups explaining the majority of reads are detected at comparable abundances. Points at the margins represent taxa that are found in one dataset but not in the other; the line of dots along the y-axis represent groups not present in mTags, but present in other datasets; and along the x axis we see groups that are present in mTags but not in the other datasets. For instance in the 49|DCM panels, there are some groups recovered by mTags that V4/V9 amplicons cannot detect (blue and red points at the bottom). Groups detected by PacBio in 49|DCM but missed by V9 include: MAST-25, MOCH-1, Marine-Opisthokonts; whereas groups missed by V4 include: kinetoplastids, discoseans, diplonemids, pyrmnesiophytes, Marine-Opisthokonts, and Basal-Fungi. Fewer black points (PacBio) at the bottom of the panels, indicates that PacBio is detecting groups that are missed by metabarcoding with V4/V9 sequencing. (b) Overall comparison of the relative abundances at the group level (excluding Charophyta, Metazoa and Nucleomorphs). The primer pair used for long-read sequencing seem to preferentially amplify MALV-I, but the overall community structure that PacBio is retrieving is reasonable with the other sequencing approaches.
Extended Data Fig. 3
Extended Data Fig. 3. Percentage similarity of OTUs to references in PR2.
Percentage similarity of OTUs (18 S sequence only) against reference sequences in the PR2 database, as determined by vsearch global search. All sequences (OTU queries and references) were trimmed with primers 3NDF and 1510 R so that they spanned the same region.
Extended Data Fig. 4
Extended Data Fig. 4. Phylogenetic placement of short-read OTUs on global eukaryotic phylogeny.
Phylogenetic placement of short-read OTUs onto the long-read, global eukaryotic reference phylogenetic tree (in Fig. 1). The upper two panels represent marine environments (a, marine euphotic; b, marine aphotic), while the lower two panels showcase non-marine placements (c, freshwater; d, soil). Visualization of the placement files was done through the interactive Tree of Life, and the size of each circle represents the number of placements on that particular branch weighted by the likelihood weight ratios.
Extended Data Fig. 5
Extended Data Fig. 5. Testing models of habitat transitions on global eukaryotic phylogeny.
(a) A graphical representation of the homogenous and heterogeneous models tested. The homogenous model involves a single rate regime over the tree (that is qM−NM and qNM−M have constant values). No restrictions are placed on the parameters; so qM−NM and qNM−Mare allowed to be equal or unequal to each other. The heterogeneous model estimates a separate qM−NM and qNM−M for every major eukaryotic lineage (defined in this paper as rank 4 in the PR2-transitions database, for example Ciliates, Dinoflagellates, Fungi, etc.) that had at least 50 taxa and contained both marine and non-marine taxa. (b) Instantaneous transition rates from marine to non-marine habitats (qM−NM) and vice versa (qNM−M) when using a homogenous model over the global eukaryotic phylogeny (in Fig. 1). An equal rates model formulation (qM−NM = qNM−M) was found to have a higher posterior probability and was therefore sampled more frequently (100% of the time) by the reversible-jump Markov chain. (c) Comparison of the posterior probability of log-likelihoods when using the simple, homogenous model and the heterogeneous model. The plot shows that the heterogeneous model had a much better fit, indicating that rates of habitat evolution vary strongly across the eukaryotic tree of life.
Extended Data Fig. 6
Extended Data Fig. 6. Examples of transitions detected by the incorporation of short-read data.
Three examples of transitions detected by the incorporation of short-read data in our phylogenies that would otherwise have been missed. Shades of blue/purple represent marine sequences, while shades of orange/red represent non-marine taxa. (a) A clade of marine centrohelids is detected in purple (including sequences from the Malaspina expedition, Ocean Sampling Day, Tara Oceans, and Mariana Trench datasets). (b) A clade of marine chytrids is detected mainly from Ocean Sampling Day datasets. (c) A clade of non-marine haptophytes is detected mainly from the Swiss Soils and Neotropical soil datasets. Such cases were spread throughout the eukaryotic phylogeny.
Extended Data Fig. 7
Extended Data Fig. 7. Heterogeneity of habitat transition rates within clades.
Posterior probability distributions of the global habitat evolution rates of selected eukaryotic classes. In purple, are the global transition rates of three major eukaryotic lineages (Cercozoans, Ciliates, Gyristans) as shown in Fig. 2, and in green, are the global transition rates for selected clades within these lineages. From this analysis, we can see that Thecofilosea+Imbricatea tend to transition across the salt barrier faster than Cercozoans on the whole. Spirotrich ciliates have higher transition rates than ciliates on average, and chrysophtes (golden algae) and diatoms seem to have the highest transition rates across protists.

Similar articles

Cited by

References

    1. Simpson, G. G. The Major Features of Evolution (Columbia Univ. Press, 1953).
    1. Losos JB. Adaptive radiation, ecological opportunity, and evolutionary determinism: American Society of Naturalists E. O. Wilson award address. Am. Nat. 2010;175:623–639. doi: 10.1086/652433. - DOI - PubMed
    1. Osborn HF. The law of adaptive radiation. Am. Nat. 1902;36:353–363. doi: 10.1086/278137. - DOI
    1. Yoder JB, et al. Ecological opportunity and the origin of adaptive radiations. J. Evol. Biol. 2010;23:1581–1596. doi: 10.1111/j.1420-9101.2010.02029.x. - DOI - PubMed
    1. Robertson GP, et al. Soil resources, microbial activity, and primary production across an agricultural ecosystem. Ecol. Appl. 1997;7:158–170. doi: 10.1890/1051-0761(1997)007[0158:SRMAAP]2.0.CO;2. - DOI

Publication types