. 2022 Oct;14(10):1165-1173.
doi: 10.1038/s41557-022-01004-0. Epub 2022 Aug 4.

The ribosome stabilizes partially folded intermediates of a nascent multi-domain protein

Affiliations

The ribosome stabilizes partially folded intermediates of a nascent multi-domain protein

Sammy H S Chan et al. Nat Chem. 2022 Oct.

Abstract

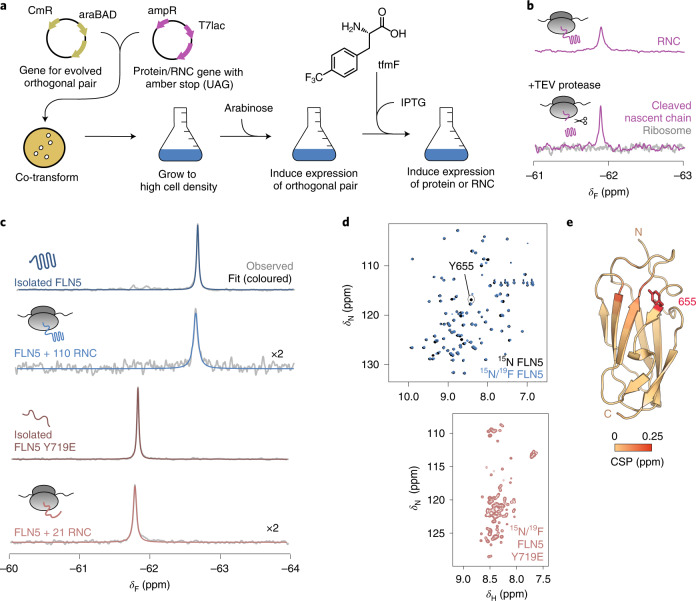
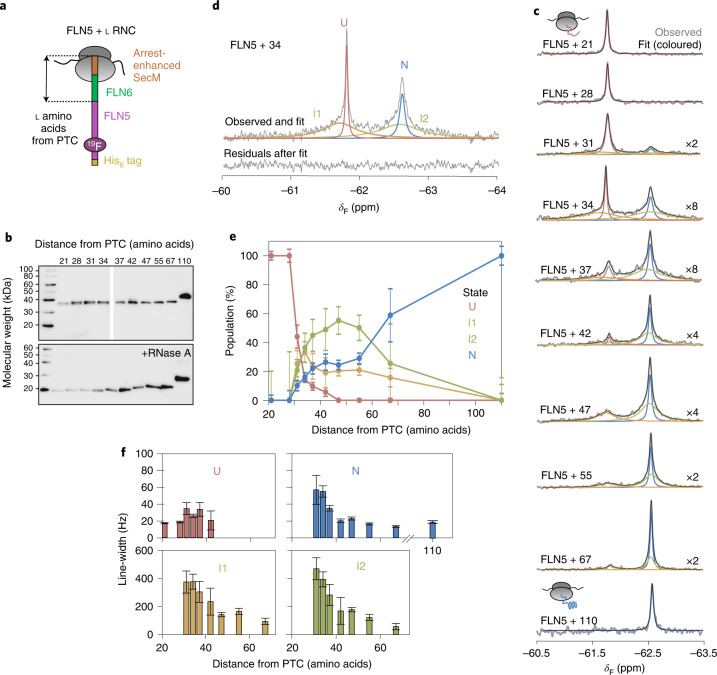
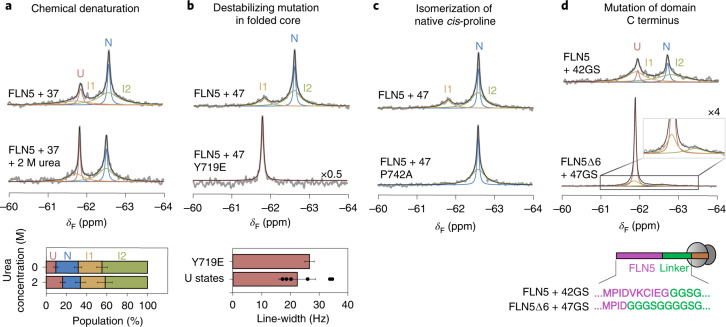
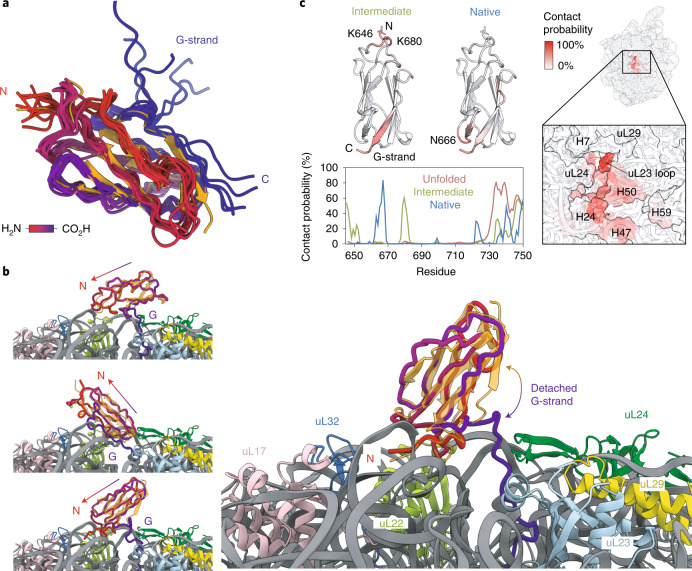
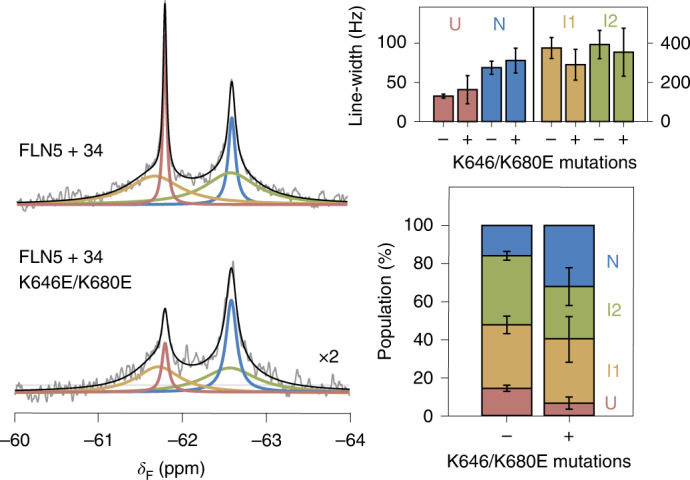
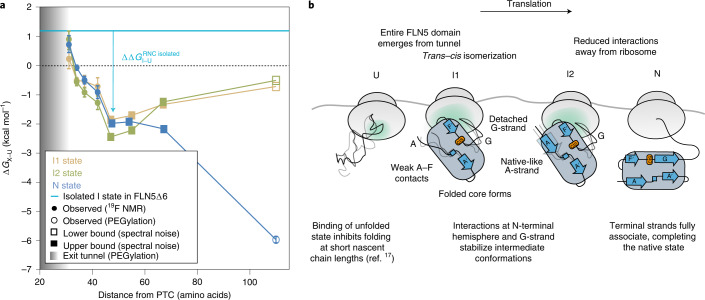
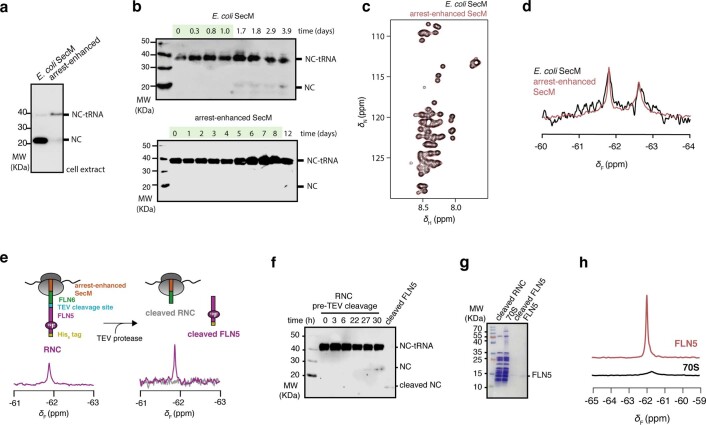
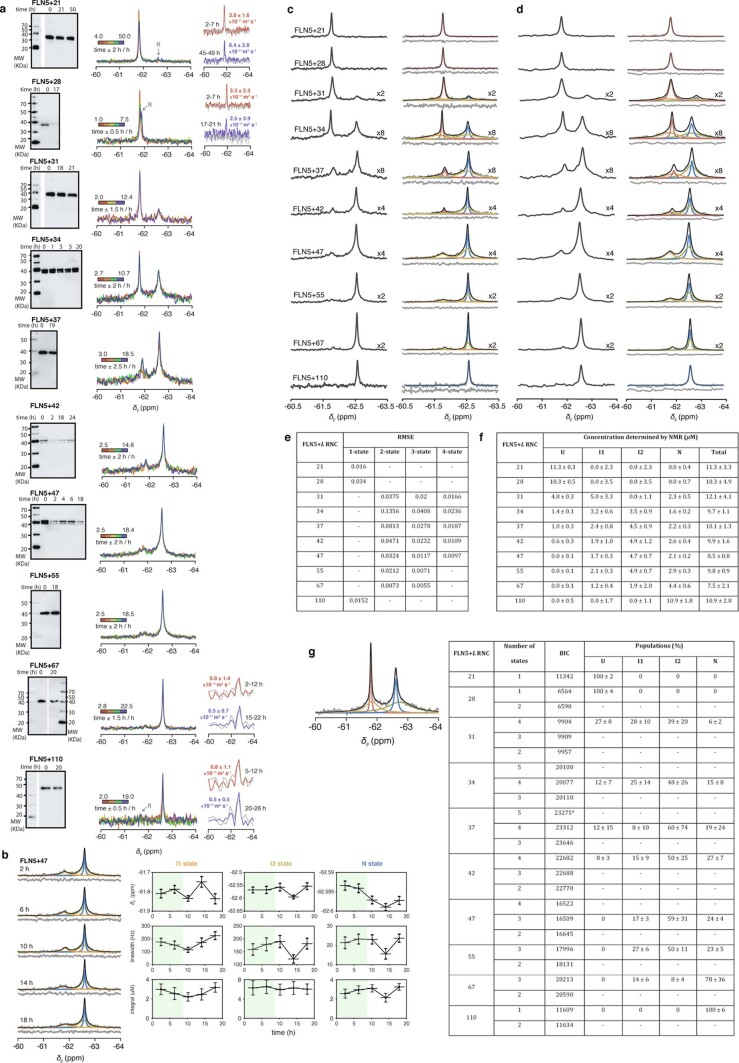
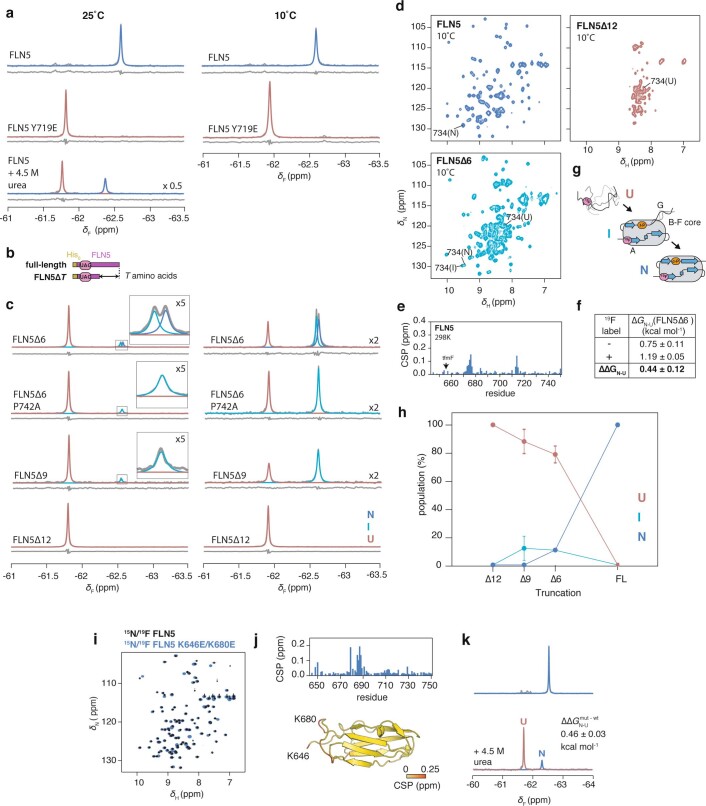
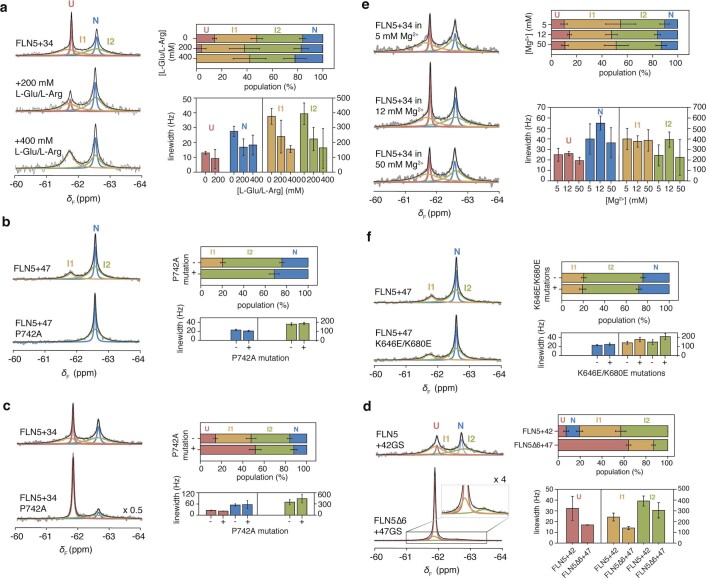
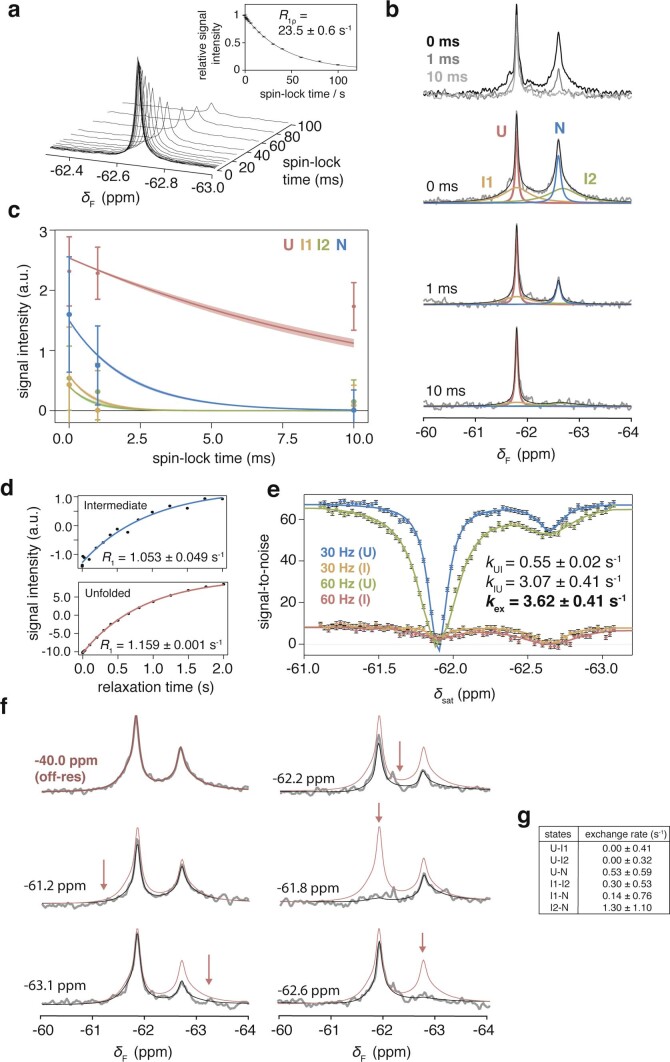
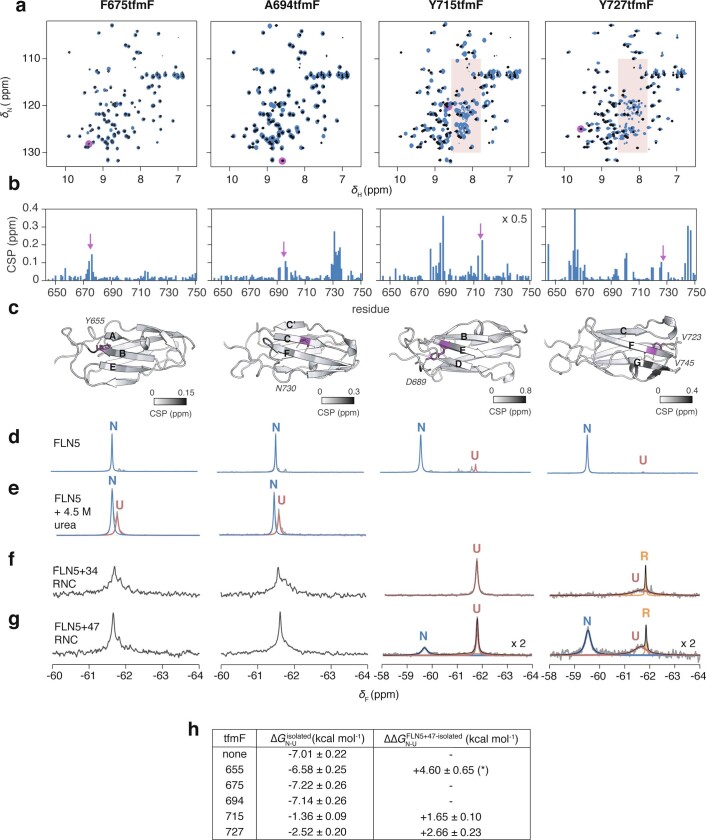
Co-translational folding is crucial to ensure the production of biologically active proteins. The ribosome can alter the folding pathways of nascent polypeptide chains, yet a structural understanding remains largely inaccessible experimentally. We have developed site-specific labelling of nascent chains to detect and measure, using 19F nuclear magnetic resonance (NMR) spectroscopy, multiple states accessed by an immunoglobulin-like domain within a tandem repeat protein during biosynthesis. By examining ribosomes arrested at different stages during translation of this common structural motif, we observe highly broadened NMR resonances attributable to two previously unidentified intermediates, which are stably populated across a wide folding transition. Using molecular dynamics simulations and corroborated by cryo-electron microscopy, we obtain models of these partially folded states, enabling experimental verification of a ribosome-binding site that contributes to their high stabilities. We thus demonstrate a mechanism by which the ribosome could thermodynamically regulate folding and other co-translational processes.


Conflict of interest statement

The authors declare no competing interests.

Figures

Fig. 1
Fig. 1. Site-specifically 19F-labelled RNCs report on the folding of FLN5 on and off the ribosome.
a, Schematic of production of 19F-labelled RNCs (Methods). CmR, cloramphenicol resistance gene; araBAD, l-arabinose operon; ampR, ampicillin resistance gene; T7lac, T7 promoter inducible by isopropyl ß-d-1-thiogalactopyranoside (IPTG). b, The 19F NMR spectra of a RNC with a cleavable FLN5 domain, before and after addition of tobacco etch virus (TEV) protease and purification of component parts (Extended Data Fig. 1). c, The 19F NMR spectra of isolated FLN5 and FLN5 + 110 RNC, and isolated FLN5 Y719E and FLN5 + 21 RNC. Observed and fitted spectra are shown in grey and red/blue respectively (298 K, 500 MHz). δF, 9F chemical shift. RNC spectra magnified by a factor of ×2. d, The 2D 1H,15N NMR (selective optimized flip angle short transient (SOFAST) heteronuclear multiple quantum coherence (HMQC)) spectra of 15N-labelled and 15N/19F-labelled isolated FLN5 and FLN5 Y719E (298 K and 283 K, respectively; 800 MHz). δN, 15N chemical shift; δH, 1H chemical shift. e, Crystal structure of FLN5 (Protein Data Bank (PDB) no. 1QFH) coloured by residue-specific 1H,15N amide backbone chemical shift perturbations (CSP) observed following 19F incorporation at position 655 (Extended Data Fig. 3). The N and C termini are shown. Source data
Fig. 2
Fig. 2. Co-translational folding of FLN5 monitored by 19F NMR spectroscopy.
a, Design of FLN5 RNCs in which FLN5 is tethered to the PTC via a linker sequence comprising a variable number of FLN6 residues and an arrest-enhanced SecM stalling motif. b, Anti-hexahistidine western blot of purified FLN5 RNCs, with and without ribonuclease A (RNase A) treatment. Representative data shown from two independent repeats. c, The 19F NMR spectra of FLN5 RNCs with increasing distance from the PTC. Observed spectra shown in grey were fitted and peaks assigned to U, I1, I2 or N states (coloured), with the sum of the fits shown in black. NMR data were multiplied with an exponential window function (10 Hz line broadening factor) before Fourier transformation. d, The 19F NMR spectrum of FLN5 + 34 RNC, processed with a line broadening factor of 5 Hz. Residual spectrum after fitting is shown below. e, Folding of FLN5 on the ribosome, measured using 19F NMR line-shape fits. f, Line-widths measured by line-shape fits of spectra as shown in c. All error bars indicate errors calculated by bootstrapping of residuals from NMR line-shape fittings. Source data
Fig. 3
Fig. 3. The ribosome-bound intermediate states are partially folded.
a, The 19F NMR spectra of FLN5 + 37 RNC in the absence and presence of 2 M urea. Fractional populations shown below. b, The 19F NMR spectra of FLN5 + 47 and FLN5 + 47 Y719E RNC. Below, the line-width of FLN5 + 47 Y719E is compared against the line-widths of U determined for other RNCs (mean ± s.d.; Fig. 2f). c, The 19F NMR spectra of FLN5 + 47 and FLN5 + 47 P742A RNC. Analysis shown in Extended Data Fig. 4. d, The 19F NMR spectra of tfmF655-labelled FLN5∆6 + 47GS and FLN5 + 42GS RNCs (283 K, 500 MHz). Schematic depicts RNC construct design. Analysis shown in Extended Data Fig. 4. Unless stated otherwise, error bars indicate errors propagated from bootstrapping of residuals from NMR line-shape fittings. Source data
Fig. 4
Fig. 4. Structural ensemble of the FLN5 co-translational intermediate state determined by MD simulations.
a, Structural ensemble of the FLN5 + 34 intermediate from CG models. The 10 most populated intermediate conformations are superimposed with the native FLN5 crystal structure (orange; PDB no. 1QFH) and coloured from N terminus (red) to C terminus (blue). Ribosome and linker are not shown for clarity. b, Examples of the FLN5 + 34 intermediate structures, with the FLN5 crystal structure aligned. Colours as in a. Arrow indicates axis from C to N terminus. c, The bottom left plot shows the contact probability between the FLN5 + 34 in its unfolded, intermediate and native states and the ribosome from CG models. Contact probabilities of the intermediate and native states are coloured on the FLN5 structures (above) with regions of highest probability highlighted. The right depicts the contact probability between the FLN5 + 34 intermediate and the ribosome, mapped onto the ribosome surface. Source data
Fig. 5
Fig. 5. Electrostatic interactions with the ribosome surface stabilize partially folded nascent chains.
The 19F NMR spectra of FLN5 + 34 and FLN5 + 34 K646E/K680 RNCs. Line-widths and populations of each RNC state determined by analysis of the spectra are shown on the right. Error bars indicate errors (propagated) from bootstrapping of residuals from NMR line-shape fittings. Source data
Fig. 6
Fig. 6. Free energy landscape and proposed model of co-translational folding of FLN5.
a, Free energy landscape of the co-translational folding of FLN5. Fractional populations determined by 19F NMR (Fig. 2e) were used to determine the difference in free energy between X (I1, I2 or N) and U (∆GX–U); in RNCs where U was not populated, an upper or lower bound of ∆GX–U was determined based on the spectral noise. The ∆GN–U of FLN5 + 110, and emergence from the tunnel (by solvent accessibility of the native, C-terminal C747 of FLN5; shaded region) were determined by PEGylation,. Error bars indicate errors propagated from bootstrapping of residuals from NMR line-shape fittings. b, Schematic of a proposed model for the co-translational folding mechanism of FLN5. Source data
Extended Data Fig. 1
Extended Data Fig. 1. Development of in vivo site-selective 19F-labelling of arrest-enhanced RNCs using amber suppression.
a, Anti-histidine western blot of cell extracts following expression without further purification of FLN5 + 31 RNC translationally stalled using SecM deriving from E. coli, and an arrest-enhanced variant of SecM based on the sequence deriving from Mannheimia succiniciproducens with the sequence ‘FSTPVWIWWWPRIRGPP’. A higher amount of released nascent chain relative to ribosome-bound (that is tRNA-bound) nascent chain (NC-tRNA) is interpreted as higher ribosome turnover/read-through, and thus weaker translation arrest. b, Anti-histidine western blot of samples of purified FLN5 + 31 A3A3 RNC with E. coli SecM (upper) and arrest-enhanced SecM (lower) incubated at 10˚C. Green shading indicates time during which exclusively ribosome-bound (tRNA-bound) nascent chain is detected. c, 2D 1H,15N-SOFAST HMQC spectra of a non-ribosome interacting FLN5 + 31 RNC variant with E. coli SecM (black) and arrest-enhanced SecM (red); no discernible difference was found. d, 1D 19F NMR spectra of FLN5 + 34 RNC with E. coli SecM (black) and arrest-enhanced SecM (red). No discernible difference was found, notwithstanding the significantly higher effective signal-to-noise provided by longer available data acquisition of the arrest-enhanced RNC. e, (left) 1D 19F spectrum of FLN5, 19F-labelled at position 691 and translationally stalled by the arrest-enhanced SecM motif, linked together with a linker comprising FLN6 residues and a TEV protease cleavage site. (right) 1D 19F spectrum following cleavage by TEV protease and purification of the two component parts to produce the cleaved RNC and cleaved FLN5. f, Anti-histidine western blot of RNC sample during NMR data acquisition and following TEV protease cleavage. g, Coomassie-stained SDS-PAGE of purified samples. h, 1D 19F spectra of purified (upper) FLN5, and (lower) 70S ribosomes purified from E. coli transformed with the plasmid encoding the orthogonal pair and exclusively grown in cultures supplemented with tfmF to achieve 100% tfmF labelling. Spectra are normalised to molar concentrations and number of experimental scans. These data demonstrate that even with 100% background labelling of the ribosome, its signal intensity remains substantially lower than that of FLN5. Western blots and gels show representative data from two independent repeats. Source data
Extended Data Fig. 2
Extended Data Fig. 2. Assessment of sample integrity and lineshape fitting of FLN5 RNCs.
a, For each RNC construct, the sample was subjected to (left) anti-histidine western blot analysis following SDS-PAGE of aliquots of a sample incubated in parallel to NMR experiments, evaluated by the observation of the tRNA-bound (that is ribosome-bound) form of the nascent chain, representative data shown from two independent repeats; (middle) an assessment of its 1D 19F NMR spectra recorded in timed succession; and where sensitivity was permissible, (right) 19F STE experiments were recorded, in an interleaved manner with 1D 19F experiments, with a diffusion delay of 100 ms and at gradient strengths of 5% (coloured) and 95% (grey) of the maximum gradient strength Gmax of 0.54 T m-1, and summed to gain sufficient signal-to-noise to determine its diffusion coefficient. b, As a representative example of the assessment of 1D 19F NMR spectra over time, (left) spectra of FLN5 + 47 are shown (grey), fitted to Lorentzian lineshapes (coloured), with residuals after fitting shown below. (right) Quantitative analysis of the chemical shift, linewidth and integrals for each RNC state, taken from fittings of spectra over time; green shading indicates the time in which the RNC sample was deemed to be stable and intact. Data from these times were summed together and used for the final spectrum. Error bars indicate errors calculated from bootstrapping of residuals from NMR line shape fittings. 1D 19F NMR spectra of the FLN5 RNCs were fitted to line shapes using exponential line broadening functions prior Fourier transformation to compare spectroscopic sensitivity of broad lines (increases with stronger line broadening) and resolution between different peaks (improves with weaker line broadening). Shown in the figure are exponential line broadenings at c 10 Hz, and d 40 Hz. Analysis using either exponential function results in the same quantifications. e, Root-mean-square errors (RMSE) obtained for the fitting of different numbers of lineshapes to 1D 19F NMR spectra of the FLN5 RNCs. f, Concentrations of each state were determined by lineshape fitting of spectra, and normalised to a sample concentration of 10 µM as measured by its absorbance at a wavelength of 280 nm, and to which the total summed NMR integral was compared against. No significant deviation was found between the concentration determined by NMR integration and by absorbance, indicating that the lineshape fits did not significantly over- or underfit the data. g, Time domain analysis of FLN5 RNCs of varying lengths. NMR data, shown in Fig. 2, were fitted in the time domain using exponential functions, combined with fits for zero-order phase and baseline correction in the frequency domain. An example of NMR data fitted using time domain analysis is shown (in the frequency domain, that is following Fourier transformation). The Bayesian information criterion (BIC) value was calculated for each RNC, as an indication of the number of resonances, and thus states, which are most likely to represent the data. The model with the lowest BIC was chosen for analysis in the frequency domain. (*) Fitting with an additional state accounting for <1.5% population. Populations determined for each state by time domain analysis are consistent with those obtained by frequency domain analysis. Source data
Extended Data Fig. 3
Extended Data Fig. 3. NMR spectroscopy of isolated variants of 19F-labelled FLN5.
a, 1D 19F NMR spectra of isolated FLN5, FLN5 Y719E and FLN5 in the presence of 4.5 M urea, recorded at 25˚C and 10˚C. No intermediate state population (>5%) was detectable under denaturing conditions. b, Design of C-terminal truncations of FLN5. c, 1D 19F NMR spectra of FLN5∆6, FLN5∆6 P742A, FLN5∆9, and FLN5∆12, recorded at 25˚C and 10˚C. Observed spectra (in grey) were fitted to Lorentzian line shapes and assigned to the various isolated states: natively folded (N, blue), intermediate (I, cyan), and unfolded (U, red). Residuals after fitting are shown below each spectrum. The P742A mutation results in destabilisation of the ∆6 N state, enabling us to attribute the intermediate state as having a cisP742 conformation. d, 2D 1H,15N-SOFAST HMQC spectra of FLN5, FLN5∆6, and FLN5∆12, recorded at 10˚C. Assignment of residue R734 is shown as an example of resonances in N, I, and U states. e, 1H,15N SOFAST-HMQC chemical shift perturbations of isolated FLN5 following introduction of Y655tfmF, at 298 K. f, Incorporation of tfmF results in a small destabilisation in the natively folded state, as determined by integration of FLN5∆6 peak shown in c, and compared against previous measurements of non-fluorinated protein. Errors propagated from bootstrapping of residuals from NMR line shape fittings. g, Schematic summarising length-dependent folding pathway of isolated FLN5. h, Length-dependent folding of isolated, 19F-labelled FLN5, determined by integration of spectra shown in a and d. Error bars indicate errors propagated from bootstrapping of residuals from NMR line shape fittings.i, 1H,15N-correlated NMR spectra of isolated 15N/19F-labelled FLN5 and FLN5 K646E/K680E. j, 1H,15N- chemical shift perturbations of FLN5 upon introduction of K646E/K680E mutations from analysis of spectra shown in a shown per residue in the plot, and coloured onto the FLN5 crystal structure below. k, 19F NMR spectra of FLN5 K646E/K680E in 0 and 4.5 M urea. The folded/unfolded populations of the latter were determined by lineshape fitting, and compared against those obtained for wild-type FLN5 (shown in a) to obtain its change in thermodynamic stability. Source data
Extended Data Fig. 4
Extended Data Fig. 4. Characterisation of co-translational folding intermediates.
a, 1D 19F NMR spectra of FLN5 + 34 in the presence of increasing concentrations of equimolar arginine glutamate. Line shape fittings were used to determine the populations and line widths, as shown by the plots on the right. Reductions in linewidths are indicative of loss of ribosome interactions. Decreased population of U is consistent with destabilisation of its ribosome interactions. b, 1D 19F NMR spectra of FLN5 + 47 and FLN5 + 47 P742A. Line shape fittings were used to determine the populations and line widths, as shown by the plots on the right. c, As in b but with FLN5 + 34 and FLN5 + 34 P742A. d, As in b but with FLN5 + 42GS and FLN5∆6 + 47GS (283 K, 500 MHz). e, As in b but with FLN5 + 34 in 5, 12, and 50 mM magnesium ion concentration. f, As in b but with FLN5 + 47 and FLN5 + 47 K646E/K680E. Similar populations are obtained for the RNC despite the destabilisation of the native state in isolation, indicating an effective stabilisation of N on the ribosome. All error bars indicate errors (propagated) from bootstrapping of residuals from NMR line shape fittings. Source data
Extended Data Fig. 5
Extended Data Fig. 5. Characterisation of dynamic processes on and off the ribosome by 19F NMR spectroscopy.
a, On-resonance 19F R1ρ measurements of isolated FLN5 using a high spin-lock field (7500 Hz). Inset shows plot of relative signal intensities from fitted spectra as a function of spin-lock time. The R1ρ determined is consistent with R2 measured using lineshape analysis of the 1D 19F NMR spectrum (23.3 ± 0.8 s-1, Fig S3), indicating the absence of chemical exchange processes. b, On-resonance 19F R1ρ measurements of FLN5 + 34 RNC. Due to limitations in sensitivity, we selected three spin-lock times. Observed spectra are shown above. Spectra shown below were globally fitted, with shared chemical shifts and linewidths, but independent signal intensities. c, Signal intensities determined from a global fit of spectra shown in b were plotted against spin-lock times, and compared against the expected signal decay from R2 measurements determined by lineshape analysis of the 1D 19F NMR spectrum as shown in the shaded regions. Error bars indicate errors determined by bootstrapping of residuals from NMR line shape fittings. d, 19F longitudinal relaxation rate (R1) measurements for the unfolded and intermediate states in FLN5∆6 P742A, used in the CEST measurement fittings. Error determined from data fits. e, 19F CEST profiles for FLN5∆6 P742A measuring exchange between the unfolded and isolated intermediate states using different B1 field strengths (30, 60 Hz). Error determined from data fits. f, 19F CEST measurements of FLN5 + 34 RNC. Due to limitations in sensitivity, we selected six frequencies at which to irradiate (of which one was off-resonance from all NMR peaks and shown in red, with remaining irradiation frequencies indicate d by arrows) with the 15-Hz B1 field. The frequencies were chosen to either saturate N/U states and intermediates (-62.2, -61.8, and -62.6 ppm), or only one intermediate state (-61.2 and -63.1 ppm). In the case of the latter, saturation of I1 (that is at -61.2 ppm) did not result in significant perturbation of the I2 state, and vice versa; this result indicates that the I1 and I2 resonances are distinct, in slow exchange, and therefore provides further evidence that four states are populated by FLN5 + 34. Observed spectra (grey) were fitted (black) by analysing in the time domain using the Bloch-McConnell equations. g, Exchange rates between FLN5 + 34 nascent chain states determined by CEST measurements, using an estimated R1 of 1.1 s-1 for all RNC states. Error determined from data fits. Source data
Extended Data Fig. 6
Extended Data Fig. 6. 19F NMR spectroscopy of FLN5 with tfmF incorporation at positions F675, A694, Y715, and Y727.
a, 2D 1H,15N-SOFAST HMQC spectra of FLN5 without (black) and with tfmF-incorporation (blue). Resonance corresponding to incorporation site is absent in each tfmF-labelled FLN5 construct, as highlighted in magenta. Red shading indicates disordered resonances resulting from destabilisation by tfmF-incorporation in solvent-inaccessible positions (see h). b, 1H,15N-correlated chemical shift perturbations measured from spectra shown in a upon tfmF-incorporation. c, Location of tfmF-incorporation (magenta) on the crystal structure of FLN5 (1qfh), coloured according to chemical shift perturbations. Contacts made by non-fluorinated FLN5 at the label site are shown by dashed lines and the contacted residues labelled. d, 1D 19F NMR spectra of tfmF-incorporated FLN5. Arrows indicate the appearance of a disordered resonance, consistent with 1H,15N-correlated NMR observations. e, 19F NMR spectra of tfmF-incorporated FLN5 incubated in 4.5 M urea, used to determine the ∆∆G of tfmF-incorporation by comparison with 19F NMR spectra of FLN5 labelled at position 655 and incubated in 4.5 M urea, as shown in Extended Data Fig. 5. f, 19F NMR spectra of tfmF-incorporated FLN5 + 34 RNC. g, 19F NMR spectra of tfmF-incorporated FLN5 + 47 RNC. Ribosome-released species are indicated by orange arrows. For spectra with well-resolved resonances, the data were fitted to Lorentzian line shapes. The broad linewidth of the unfolded state for tfmF727 FLN5 + 47 is consistent with its position in the ribosome-interacting segment of the domain, and is reduced by ~25% relative to its linewidth in FLN5 + 34. The spectra of RNCs tfmF-labelled at positions 675 and 694 show highly overlapped resonances and so we were unable to accurately fit the peaks. h, Gibb’s free energies of tfmF-incorporated isolated FLN5, determined by quantification of native state peak integrals of spectra shown in d and e, and free energy differences (∆∆GN-U) between the ribosome-bound (with 47-residue linker) and isolated native states. The ∆∆GN-U for tfmF655-labelled FLN5 (labelled *) is estimated based on a population of U determined from the spectral noise. 19F-labelling at positions 715 and 727 show reduced destabilisation of N on the ribosome relative to when labelled at position 655 for FLN5 + 47 RNC (similar results are obtained when including I1 and/or I2 states); tfmF side chains in positions 715 and 727 therefore form native-like tertiary contacts before those in 655 are formed in the intermediate states, consistent with a folded core comprising the B-F strands. Source data
Extended Data Fig. 7
Extended Data Fig. 7. Coarse-grained molecular dynamics simulations of the co-translational folding of FLN5.
a, CG structure-based model MD simulations of isolated FLN5 and its C-terminal truncations (FLN5∆6 and FLN5∆9) used to calibrate all subsequent MD simulations. We introduced non-bonded interactions in the form of native contacts generated from the FLN5 crystal structure (1qfh) as they dominate the folding landscape based on the principle of minimal frustration. We used Parallel Biased Metadynamics to enhance sample transitions between different states using ten collective variables: fraction of all native contacts, radius of gyration, and the fraction of the native contacts between each pair of strands (A-B, A’-G, B-E, C-F, C-C’, D-E, F-F’, and F-G). Shown in the plots are the free energy landscapes of folding in 1D (top) and 2D (against the radius of gyration); the middle plot shows convergence of the free energy of folding calculated across the whole trajectory based on the block analysis. b, Populations of FLN5 states determined by CG models (by analysis of free energy landscapes shown in a) and by 19F NMR, showing good agreement at the chosen temperature for MD simulations. The CG models do not simulate cis-trans isomerisation (and thus cannot model the transP742 in the intermediates), and therefore, as an approximation, all folded states were compared against the summed total of native and intermediate state populations from experimental data instead. c, Top plot shows free energy landscapes of folding determined for 6 RNCs by CG models. Bottom plot shows convergence of the free energy of folding calculated across the whole trajectory based on the block analysis. d, Free energy landscapes of folding plotted against radius of gyration for each RNC. e, Free energy landscapes of folding plotted against fraction of contacts between pairs of β-strands or loop regions (as indicated on the right of each plot) for each RNC. f, Populations of unfolded, intermediate and native states obtained for each RNC by the CG models. g, Contact probability between the unfolded, intermediate, and native states of the RNC and the ribosome from CG models with (red) and without electrostatic interactions (grey), plotted per residue. Source data
Extended Data Fig. 8
Extended Data Fig. 8. Models of the co-translational intermediates of FLN5 by all-atom, cryo-EM density-driven MD simulations.
a, Examples of structural models of FLN5 co-translational intermediates fitted to previously obtained cryo-EM densities of FLN5 + 45 and FLN5 + 47 RNCs. Two major orientations are observed, in which the N-terminus of the FLN5 domain points towards (left) or away (right) from the ribosome. The FLN5 domain is coloured from its N- (red) to C-terminus (blue), with its N-terminus (N) and G-strand labelled (G). Cryo-electron densities are shown in grey, and at a contour level of two sigma. b, Cross-correlation values for cryo-EM density-guided MD simulations of native and intermediate state RNCs. For each of the 10 density-guided simulations obtained using the three electron density maps, we generated final models for the intermediate state, from which electron density maps were simulated and compared against the nascent chain experimental maps. The resulting cross-correlation values, calculated as in ChimeraX, for the intermediate state are shown alongside cross-correlations using the same approach as previously for the native state (Javed et al, submitted). c, Contact probabilities of FLN5 residues with the ribosome surface by analysis of models of the intermediate as shown in a for the two main orientations observed (N-terminus of FLN5 towards and away from the ribosome, left and right, respectively). Regions of highest contact probability, residues K646 and K680 and G-strand, labelled. d, As in b, but for models of the native state from previous all-atom cryo-EM density-driven MD simulations using the same cryo-EM map. Source data
Extended Data Fig. 9
Extended Data Fig. 9. Stabilisation of co-translational intermediates by the ribosome.
Free energy landscape for the length-dependent co-translational folding of FLN5, plotted relative to N, from analysis of spectra shown in Fig. 2. Error bars indicate errors propagated from bootstrapping of residuals from NMR line shape fittings. Source data
Extended Data Fig. 10
Extended Data Fig. 10. Effect of neighbouring domains on the co-translational folding of FLN5.
a, Anti-hexahistidine western blot of the tandem FLN4 + FLN5 + 34 RNC with and without RNase A treatment. Representative data shown from two independent repeats. b, 1D 19F NMR spectra of FLN5 + 34 and FLN4 + FLN5 + 34 RNCs. c, Analysis of linewidths and populations from lineshape fittings of spectra shown in b. d, 1D 19F NMR spectra of FLN5 + 42 RNC with linker residues deriving from FLN6 and with a poly(GS) linker; the line shape fittings were used to determine the populations and line widths as shown in e. All error bars indicate errors (propagated) from bootstrapping of residuals from NMR line shape fittings. Source data

Similar articles

Cited by

References

    1. Waudby CA, Dobson CM, Christodoulou J. Nature and regulation of protein folding on the ribosome. Trends Biochem. Sci. 2019;44:914–926. doi: 10.1016/j.tibs.2019.06.008. - DOI - PMC - PubMed
    1. Cassaignau AME, Cabrita LD, Christodoulou J. How does the ribosome fold the proteome? Annu. Rev. Biochem. 2020;89:389–415. doi: 10.1146/annurev-biochem-062917-012226. - DOI - PubMed
    1. Chiti F, Dobson CM. Protein misfolding, functional amyloid, and human disease. Annu. Rev. Biochem. 2006;75:333–366. doi: 10.1146/annurev.biochem.75.101304.123901. - DOI - PubMed
    1. Hartl FU, Bracher A, Hayer-Hartl M. Molecular chaperones in protein folding and proteostasis. Nature. 2011;475:324–332. doi: 10.1038/nature10317. - DOI - PubMed
    1. Deckert, A. et al. Common sequence motifs of nascent chains engage the ribosome surface and trigger factor. Proc. Natl Acad. Sci. USA118, e2103015118. - PMC - PubMed

Publication types