. 2022 Aug 4;12(1):13437.
doi: 10.1038/s41598-022-17062-w.

The focused quantitative EEG bio-marker in studying childhood atrophic encephalopathy

Affiliations

The focused quantitative EEG bio-marker in studying childhood atrophic encephalopathy

Sungura Richard et al. Sci Rep. .

Abstract

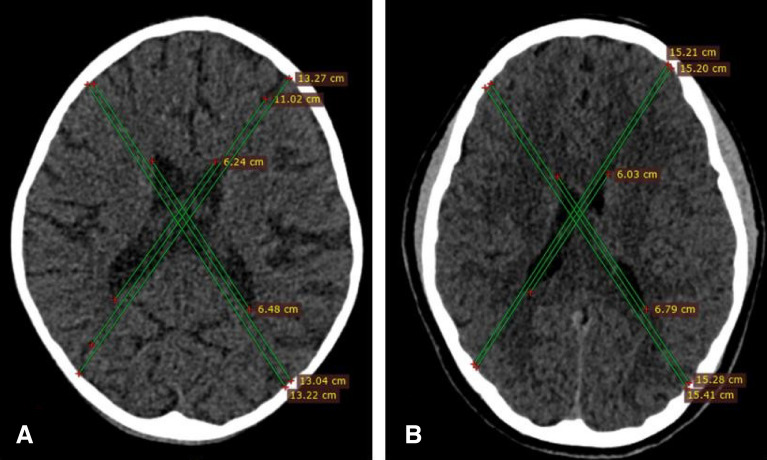
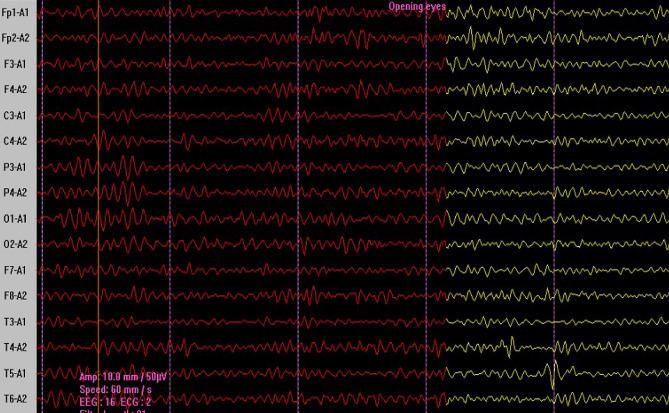
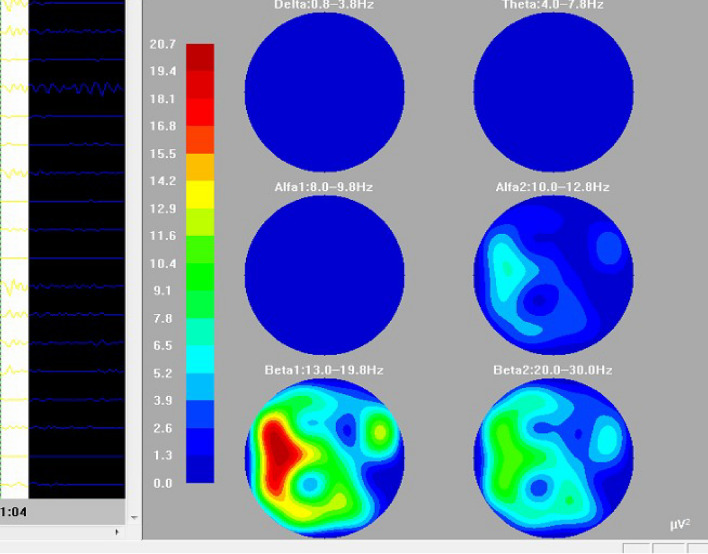
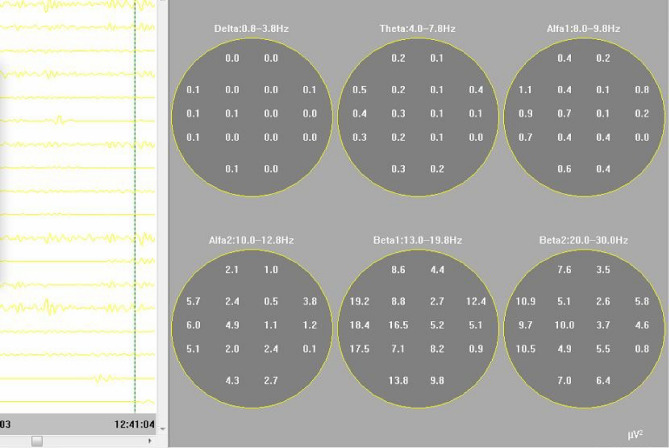
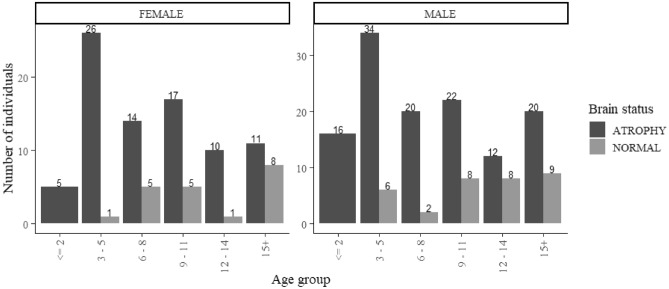
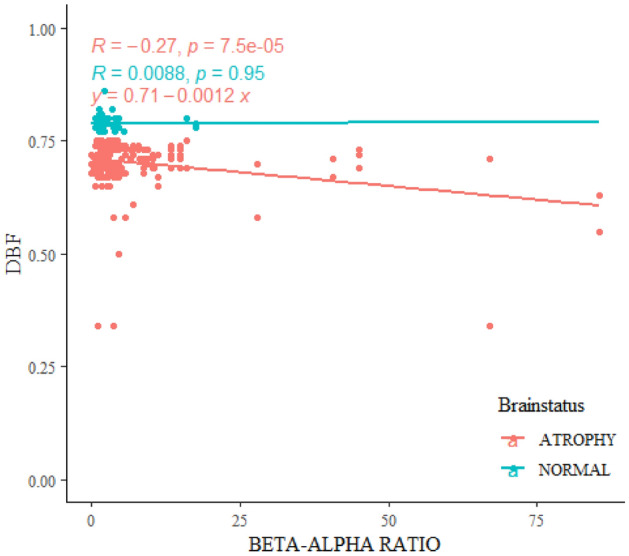
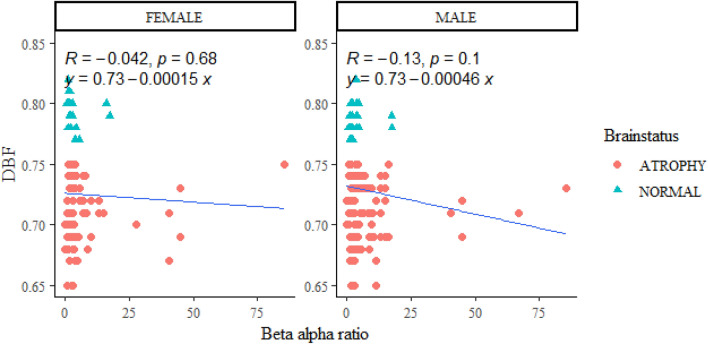
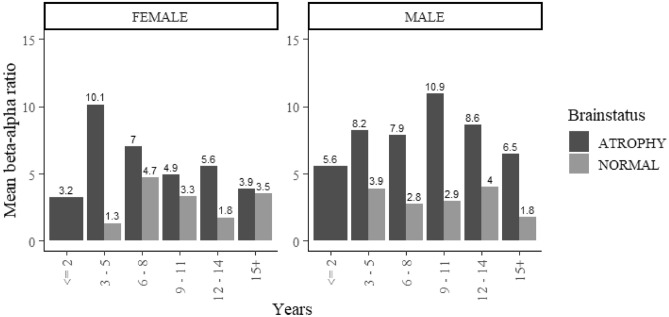
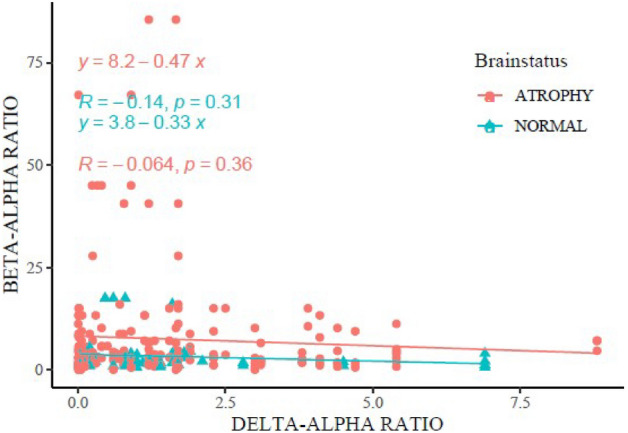
Although it is a normal involution process in advanced age, brain atrophy-also termed atrophic encephalopathy-can also occur prematurely in childhood as a consequential effect of brain tissues injury through trauma or central nervous system infection, though in both normal and premature occurrences this condition always presents with loss of volume relative to the skull. A common tool for the functional study of brain activities is an electroencephalogram, but analyses of this have reportedly identified mismatches between qualitative and quantitative forms, particularly in the use of Delta-alpha ratio (DAR) indices, meaning that the values may be case dependent. The current study thus examines the value of Focused Occipital Beta-Alpha Ratio (FOBAR) as a modified biomarker for evaluating brain functional changes resulting from brain atrophy. This cross-sectional design study involves 260 patients under 18 years of age. Specifically, 207 patients with brain atrophy are compared with 53 control subjects with CT scan-proven normal brain volume. All the children underwent digital electroencephalography with brain mapping. Results show that alpha posterior dominant rhythm was present in 88 atrophic children and 44 controls. Beta as posterior dominant rhythm was present in an overwhelming 91.5% of atrophic subjects, with 0.009 p-values. The focused occipital Beta-alpha ratio correlated significantly with brain volume loss presented in diagonal brain fraction. The FOBAR and DAR values of the QEEG showed no significant correlation. This work concludes that QEEG cerebral dysfunctional studies may be etiologically and case dependent from the nature of the brain injury. Also, the focused Beta-alpha ratio of the QEEG is a prospective and potential biomarker of consideration in studying childhood atrophic encephalopathy.


Conflict of interest statement

The authors declare no competing interests.

Figures

Figure 1
Figure 1
Brain CT scan sections at the widest part of the lateral ventricular body. (A) A case of brain atrophy from a 6-year-old male child showing prominent sulci and enlarged lateral ventricular body with a DBF value of 0.58 consistent with grade-II brain atrophy. (B) A normal brain volume of a 13-year-old male child showing effaced sulci intimately related to the calvarium, normal size lateral ventricular body with a DBF value of 0.81.
Figure 2
Figure 2
Normal EEG wave pattern. Normal alpha rhythm dominant at O1-A1 and O2-A2 posterior electrodes showing attenuation on eye opening in a pediatric subject. The waves recording show 10–11 ripples (Hz), implying brain cortical waves in alpha bad frequency. Amplitude suppression (yellow) after the opening of eye evidences reactivity that implies normal alpha waves. The posterior dominance is marked by prominent wave amplitude in the posterior electrodes (O1 and O2).
Figure 3
Figure 3
Brain colour spectral mapping of EEG power waves. EEG brain mapping showing signals in all frequency ranges with Delta and Theta being very minimal and Beta signals being the dominant rhythm in a male child.
Figure 4
Figure 4
Numerical power intensity of the EEG wave form.
Figure 5
Figure 5
Participants’ age and gender demographics.
Figure 6
Figure 6
Beta-Alpha Ratio relation to brain volume.
Figure 7
Figure 7
Gender relation of focused occipital bar. No significant difference between male and female subjects was found, despite an increased trend towards male children.
Figure 8
Figure 8
Varying trend of Focused Occipital BAR with gender. There is varying age in the peak values of the mean BAR with a constantly increasing trend in male children with brain atrophy.
Figure 9
Figure 9
Correlation between Focused Occipital BAR versus DAR. In both atrophy and normal subjects, BAR shows insignificant correlation despite a trend towards children with normal brain volume.

Similar articles

References

    1. Encha-Razavi F, Sonigo P. Features of the developing brain. Childs Nerv. Syst. 2003;19(7):426–428. doi: 10.1007/s00381-003-0765-6. - DOI - PubMed
    1. Madan CR, Kensinger EA. Cortical complexity as a measure of age-related brain atrophy. Neuroimage. 2016;134:617–629. doi: 10.1016/j.neuroimage.2016.04.029. - DOI - PMC - PubMed
    1. Becker JT, Sanders J, Madsen SK, Ragin A, Kingsley L, Maruca V, et al. Subcortical brain atrophypersists even in HAART-regulated HIV disease. Brain Imaging Behav. 2011;5(2):77–85. doi: 10.1007/s11682-011-9113-8. - DOI - PMC - PubMed
    1. Gardner, A. J., & Zafonte, R. Chapter 12—Neuroepidemiology of traumatic brain injury. In: Aminoff, M. J.,Boller, F., Swaab, D.F., editors. Handbook of Clinical Neurology [Internet]. Neuroepidemiology. 138, 207–23 (2016). http://www.sciencedirect.com/science/article/pii/B9780128029732000124. - PubMed
    1. Ng K, Mikulis DJ, Glazer J, Kabani N, Till C, Greenberg G, et al. Magnetic resonance imaging evidence of progression of subacute brain atrophy in moderate to severe traumatic brain injury. Arch. Phys. Med. Rehabil. 2008;89:35–44. doi: 10.1016/j.apmr.2008.07.006. - DOI - PubMed