. 2022 Aug;7(8):1141-1150.
doi: 10.1038/s41564-022-01179-9. Epub 2022 Aug 4.

Single mutation makes Escherichia coli an insect mutualist

Affiliations

Single mutation makes Escherichia coli an insect mutualist

Ryuichi Koga et al. Nat Microbiol. 2022 Aug.

Abstract

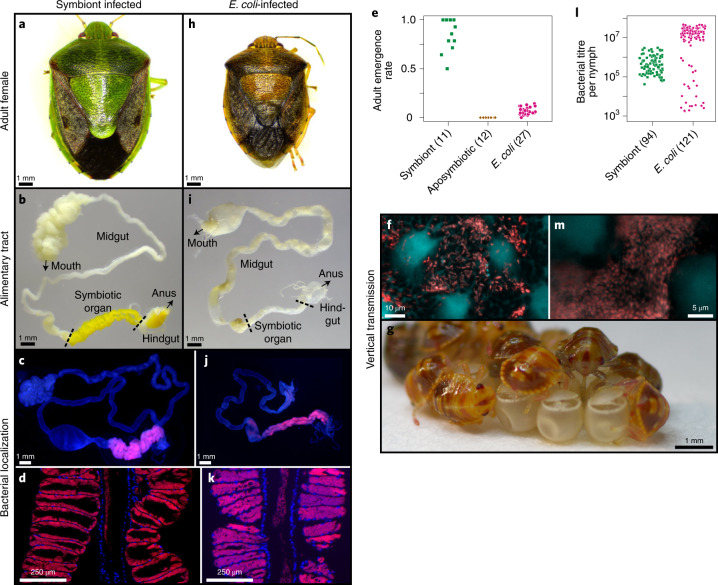
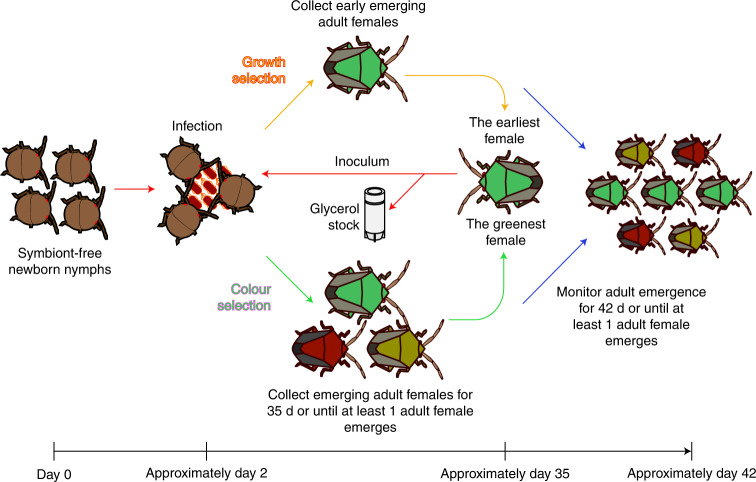
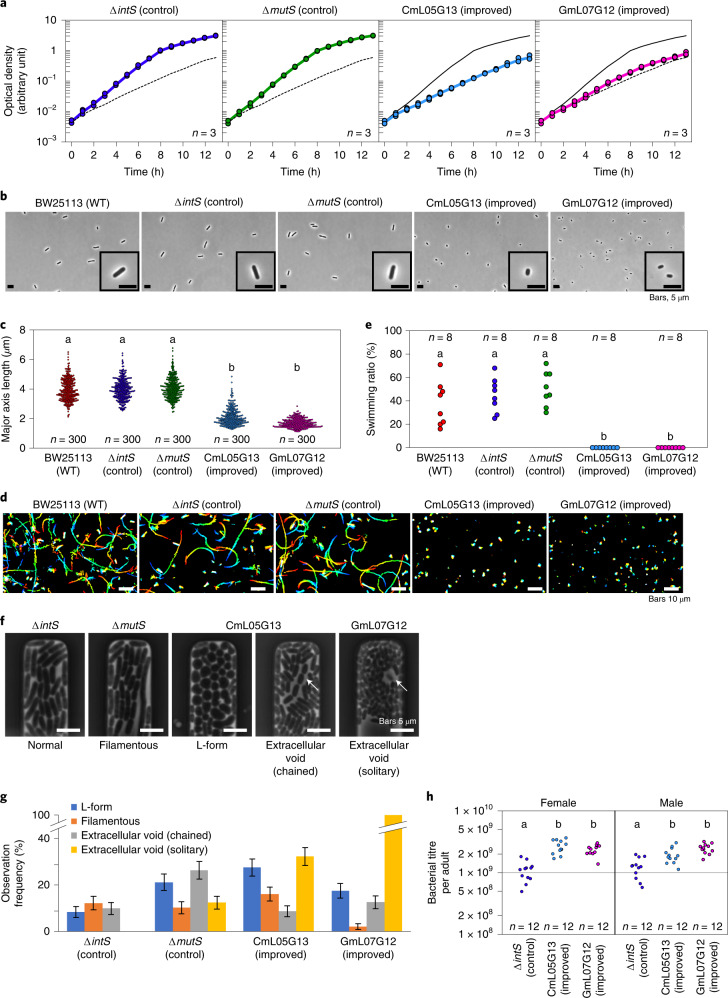
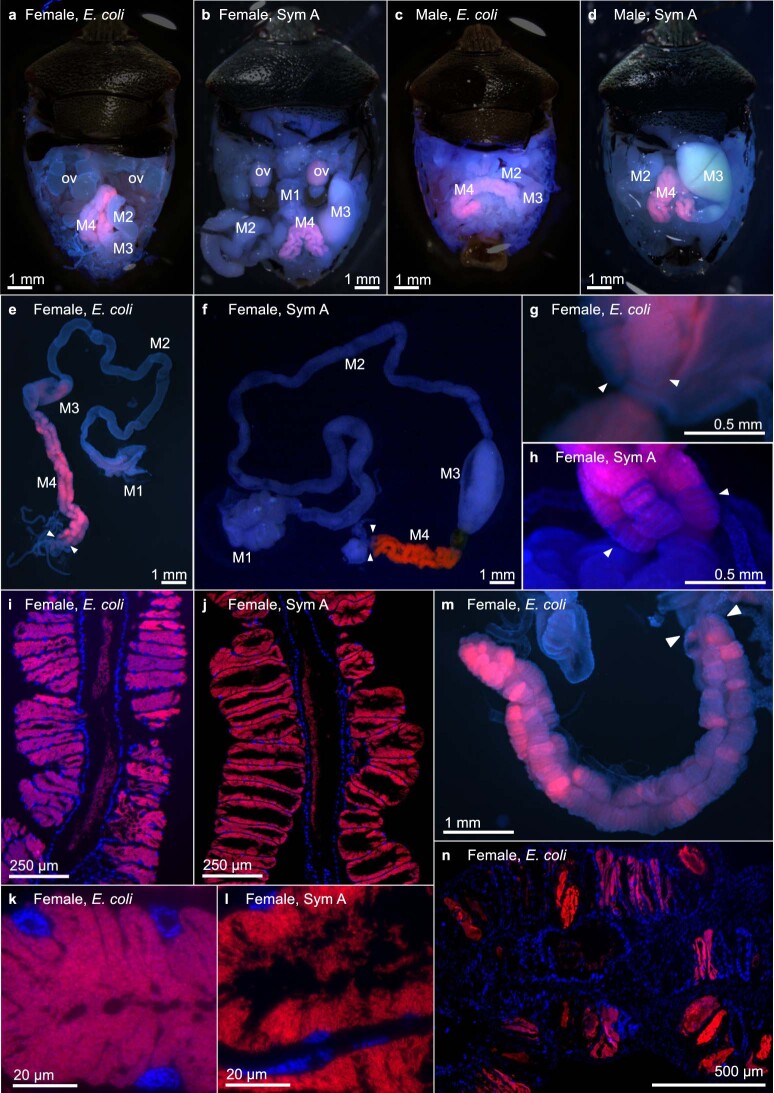
Microorganisms often live in symbiosis with their hosts, and some are considered mutualists, where all species involved benefit from the interaction. How free-living microorganisms have evolved to become mutualists is unclear. Here we report an experimental system in which non-symbiotic Escherichia coli evolves into an insect mutualist. The stinkbug Plautia stali is typically associated with its essential gut symbiont, Pantoea sp., which colonizes a specialized symbiotic organ. When sterilized newborn nymphs were infected with E. coli rather than Pantoea sp., only a few insects survived, in which E. coli exhibited specific localization to the symbiotic organ and vertical transmission to the offspring. Through transgenerational maintenance with P. stali, several hypermutating E. coli lines independently evolved to support the host's high adult emergence and improved body colour; these were called 'mutualistic' E. coli. These mutants exhibited slower bacterial growth, smaller size, loss of flagellar motility and lack of an extracellular matrix. Transcriptomic and genomic analyses of 'mutualistic' E. coli lines revealed independent mutations that disrupted the carbon catabolite repression global transcriptional regulator system. Each mutation reproduced the mutualistic phenotypes when introduced into wild-type E. coli, confirming that single carbon catabolite repression mutations can make E. coli an insect mutualist. These findings provide an experimental system for future work on host-microbe symbioses and may explain why microbial mutualisms are omnipresent in nature.


Conflict of interest statement

The authors declare no competing interests.

Figures

Fig. 1
Fig. 1. Infection, localization and vertical transmission of E. coli in the gut symbiotic system of P. stali.
a, Normal symbiotic adult female, large in size and green in colour. b, Dissected alimentary tract, in which the symbiotic organ is well developed and yellow in colour. c, FISH localization of symbiont cells to the symbiotic organ. d, Magnified FISH image showing symbiont localization to crypt cavities of the symbiotic organ. The image is reconstructed by merging three microscopic images. e, Adult emergence rates of newborn nymphs inoculated with normal symbiont (Pantoea sp. A), no bacteria (aposymbiotic) and E. coli. f, Symbiont cells smeared on egg surface. g, Newborn nymphs sucking symbiont cells from the eggshell (Supplementary Video 1). h, E. coli-infected adult female, dwarf in size and brown in colour. i, Dissected alimentary tract, in which the symbiotic organ is atrophied. j, FISH localization of E. coli to the symbiotic organ. k, Magnified FISH image visualizing E. coli localization to crypt cavities of the symbiotic organ. l, Bacterial titres in symbiont-inoculated and E. coli-inoculated nymphs 1 d after second instar moult in terms of groEL and nptII gene copies per insect, respectively. m, E. coli cells smeared on the egg surface. e,l, The numbers of biological replicates are shown after the strain names. Level adjustments without non-linear change were applied to c, d, f, j, k and m. Source data
Fig. 2
Fig. 2. Experimental scheme for the evolution of mutualistic E. coli with P. stali.
Evolutionary lines of E. coli were inoculated to sterilized newborn nymphs of P. stali and subjected to either host growth selection or host colour selection in this way.
Fig. 3
Fig. 3. Evolution of mutualistic traits for P. stali in hypermutating E. coli lines.
a, Evolutionary E. coli lines subjected to the host’s body colour selection. Data of adult emergence rate and body colour are displayed by heatmaps. The white asterisks indicate missing data of body colour measurement. b, Evolutionary E. coli lines subjected to the host’s growth speed selection. Data of adult emergence rate and days to the first adult emergence are displayed by heatmaps. a,b, When an evolutionary line produced no adult insect and recovery from the freeze stock failed twice consecutively, the evolutionary line was terminated due to shortage of inoculum. From generation 10 and onwards, selected evolutionary lines were maintained. c, Host’s body colour and colony morphology of evolutionary E. coli lines. Red colonies are due to rich extracellular matrix produced on the agar plates containing Congo red. d,e, Adult emergence patterns of P. stali infected with the representative E. coli lines, CmL05, GmL07, GmL02 and GmL04, in the original evolutionary experiments (d) and those in the confirmation experiments using frozen E. coli stocks (e). d, Pink lines represent the emergence rates of the original E. coli evolutionary lines, whereas the red lines in e represent the mean emergence rates (n = 3 biological replicates shown with brown dots) of the frozen E. coli stock infection experiments. c,e, The magenta and blue lines highlight ‘non-improved’ and ‘improved’ generations, respectively. Source data
Fig. 4
Fig. 4. Microbial traits of evolutionary E. coli lines CmL05 and GmL07 in comparison with the original E. coli strains BW25113, ΔintS and ΔmutS cultured in liquid medium.
a, Growth curves (three replicates each). The upper solid line is the trace of the ΔintS growth curve, whereas the lower dotted line is the trace of the CmL05 growth curve (Supplementary Video 2). b, Morphology of bacterial cells. c, Quantification of cell size in terms of major axis length. d, Motility of bacterial cells visualized by rainbow plot for 2 s (Supplementary Video 3). e, Quantification of bacterial motility in terms of the number of swimming cells per 100 cells observed. f, Characteristic cellular shape and growth mode in microfluidic channels. From left to right, the micrographs show the microchannels harbouring E. coli cells with normal rod-like shape (ΔintS), filamentation shape (ΔmutS), L form-like round shape (CmL05), extracellular void space and chained growth (CmL05) and extracellular void space and solitary growth (GmL07). The arrows indicate the cells showing the extracellular void space (Supplementary Video 4). g, Frequency of the microchannels in which E. coli cells exhibited characteristic cell shape and growth mode. The total numbers of microchannels observed in the time-lapse measurements (N) were 131 (ΔintS), 137 (ΔmutS), 149 (CmL05G13) and 143 (GmL07G12). The error bars represent the s.e. for the mean of binomially distributed samples, that is,P1P/N, where P = C/N and C is the number of microchannels in which the cells with the indicated phenotype appeared. h, Bacterial titres in adult females 35 d after emergence in terms of ntpII gene copies per insect. a,c,e,h, The numbers of biological replicates are shown. c,e,h, Different alphabetical letters indicate statistically significant differences (two-sided pairwise Wilcoxon rank-sum test with Bonferroni correction: P < 0.05). The exact P values are provided with the source data. Source data
Fig. 5
Fig. 5. Transcriptomics and genomics of evolutionary E. coli lines.
a,b, Clustering dendrograms and heatmaps based on gene expression levels across generations of evolutionary E. coli lines subjected to colour (left, 3,401 genes) (a) and growth selection (right, 3,360 genes) (b). The dendrograms represent the hierarchical clustering of the E. coli RNA-seq libraries. The grey and coloured areas depict non-improved and improved generations, respectively. c, Mutations identified in the genomes of CmL05 and GmL07 as coincident with the improvement of host phenotypes. SNV, single nucleotide variant. d, Candidate mutations disrupting the carbon catabolite repression: a frame shift mutation in cyaA of CmL05 (top) and a non-synonymous mutation causing change from leucine to proline at a functionally important cAMP binding domain in crp of GmL07 (bottom). e, Schematic presentation as to how the carbon catabolite repression pathway is disrupted by the cyaA and crp mutations. Source data
Fig. 6
Fig. 6. Single mutations disrupting CCR make E. coli mutualistic to P. stali.
a, Small, convex and white colonies of ΔcyaA and crp221T>C. b, Adult emergence rates of P. stali infected with ΔcyaA and crp221T>C. The numbers of biological replicates are shown in the figure. Different alphabetical letters indicate statistically significant differences (two-sided pairwise Wilcoxon rank-sum test with Bonferroni correction: P < 0.05). The exact P values are provided with the source data. c, Adult insects infected with ΔcyaA and crp221T>C, which are larger in size and green in colour in comparison with those infected with control ΔintS. Note that the revertant of crp221T>C, crp-rev, exhibits ΔintS-like inferior phenotypes. Source data
Extended Data Fig. 1
Extended Data Fig. 1. Phenotypes of P. stali adults infected with laboratory strains of E. coli.
a, Adult emergence rate. b, Body colour (greenish hue) of females (left) and males (right). (c) Body size (thorax width) of females (left) and males (right). Sym A is Pantoea sp. A, the original, uncultivable and essential gut symbiont of P. stali. BW25113, EPI300, DH5a, JM109 and BL21 are commonly used laboratory strains of E. coli. The numbers of biological replicates are shown after the strain names. Source data
Extended Data Fig. 2
Extended Data Fig. 2. FISH localization of E. coli and original symbiont Pantoea sp. A (=Sym A) in P. stali.
ad, Localization in abdominal body cavity of adult insects: (a) E. coli in adult female, (b) Sym A in adult female, (c) E. coli in adult male, and (d) Sym A in adult male. FISH signals are localized to the midgut M4 region. Signals in oocytes are due to autofluorescence. Abbreviations: M1, M2, M3, and M4, midgut regions M1, M2, M3, and M4 (=symbiotic organ); ov, ovary. e,f, Localization of E. coli (e) and Sym A (f) in dissected alimentary tract of adult females. Arrowheads indicate female-specific enlarged end crypts at the posterior end of the symbiotic organ, which are presumably involved in vertical symbiont transmission by storing bacteria-containing secretion. g,h, Magnified images of the end crypts infected with E. coli (g) and Sym A (h). Note that E. coli-infected end crypts are atrophied in comparison with Sym A-infected ones. i,j, Localization of E. coli (i) and Sym A (j) in the crypt cavities of the symbiotic organ. k,l, Magnified images of E. coli cells (k) and Sym A cells (l) packed in the crypt cavity. m,n, Patchy localization patterns of E. coli in the symbiotic organ, which are often found with E. coli but seldom observed with Sym A. Red signals represent the distribution of bacteria, except for red autofluorescence of ovaries in (a) and (b). j is reconstructed by merging five microscopic images. The level adjustment without non-linear change is applied to the images.
Extended Data Fig. 3
Extended Data Fig. 3. Effects of evolutionary E. coli lines on body size and colour of P. stali.
a, Evolutionary E. coli lines subjected to host’s body colour selection. Data of host’s body width are displayed by heat maps. Also see Fig. 3a. b, Evolutionary E. coli lines subjected to host’s growth speed selection. Data of host’s body width and colour are displayed by heat maps. Also see Fig. 3b. Source data
Extended Data Fig. 4
Extended Data Fig. 4. Adult phenotypes of P. stali infected with the evolutionary E. coli lines CmL05, GmL07, GmL02 and GmL04.
a,b, Nymphal period. c,d, Nymphal period of the earliest adult females. e,f, Body colour. g,h, Thorax width. a,c,e,g, Phenotypes of the adult females used for inoculation to the next generation and preparation of glycerol stocks of the original evolutionary E. coli lines. b,d,f,h, Phenotypes of the adult insects inoculated with the frozen E. coli stocks. In b, f and h, line charts show mean values while dots indicate individual data points. Note that, corresponding to each original evolutionary E. coli line, three insect groups were inoculated with the frozen E. coli stock. In b, f and h, the yellow bands indicate the typical phenotypic ranges of the control insects infected with the original symbiont. Source data
Extended Data Fig. 5
Extended Data Fig. 5. FISH localization of the improved evolutionary E. coli lines CmL05G13 and GmL07G12 in P. stali.
a, CmL05G17. b, GmLG12. FISH signals are localized to the midgut M4 region. Abbreviations: M1, M2, M3, and M4, midgut regions M1, M2, M3, and M4 (=symbiotic organ). Arrowheads indicate female-specific enlarged end crypts at the posterior end of the symbiotic organ, which are presumably involved in vertical symbiont transmission by storing bacteria-containing secretion. The level adjustment without non-linear change is applied to the images.
Extended Data Fig. 6
Extended Data Fig. 6. Gene expression changes of evolutionary E. coli lines GmL07 and CmL05 before and after improvement of host phenotypes.
a,b, Venn diagrams showing down-regulated genes (a) and up-regulated genes (b) after the improvement of host phenotypes. c, Expression levels of genes involved in extracellular matrix (Curli fimbriae) production before and after the improvement of host phenotypes. Asterisks indicate statistically significant differences (FDR q-value < 0.01). The numbers of the biological replicates and exact FDR q-values are provided with the source data. Source data
Extended Data Fig. 7
Extended Data Fig. 7. Mutations in the genomes of evolutionary E. coli lines CmL05, GmL02, GmL04 and GmL07 in the experimental evolutionary course.
Frequencies of 1,052 variants identified in the experimental evolution lines and generations are colour-coded. Vertical axis represents the generations of the experimental evolution lines whereas horizontal axis represents an array of 1,052 variants. Source data
Extended Data Fig. 8
Extended Data Fig. 8. Carbon catabolite repression (CCR) pathway and Crp-cAMP regulon of E. coli.
a, CCR pathway repressed in the presence of glucose. b, CCR pathway activated in the absence of glucose. c, Number of genes constituting the Crp-cAMP regulon of E. coli estimated by RegulonDB. Source data
Extended Data Fig. 9
Extended Data Fig. 9. Genes commonly down-regulated in GmL07 and CmL05 after the improvement of host phenotypes, and also down-regulated by disruption of Crp-cAMP in E. coli.
a, Venn diagram showing the commonly down-regulated genes. bi, Expression levels of the commonly down-regulated genes in GmL07 and CmL05 after the improvement of host phenotypes. (b) Transporter genes. (c) Carbohydrate metabolism genes. (d) Amino acid metabolism genes. (e) Lipid metabolism genes. (f) Quorum sensing genes. (g) Transcription factor genes. (h) Biofilm (= Curli fimbriae) formation genes. (i) Other genes. The inset figure at the bottom right represents the explanations of the elements in the plots. The numbers of the biological replicates and exact FDR q-values are provided with the source data. Source data
Extended Data Fig. 10
Extended Data Fig. 10. Phenotypic traits of ∆cyaA and crp221T>C mutants of E. coli.
a, Growth curves (3 replicates each). Upper solid line is the trace of ΔintS growth curve, whereas lower dotted line is the trace of CmL05 growth curve. b, Morphology of bacterial cells. c, Quantification of cell size in terms of major axis length. d, Motility of bacterial cells visualized by rainbow plot for 2 sec. e, Quantification of bacterial motility in terms of number of swimming cells per 100 cells observed. f, Bacterial titres in adult females 35 days after emergence in terms of ntpII gene copies per insect. In a, c, e and f, the numbers of biological replicates are shown in the plots. In c, e and f, different alphabetical letters indicate statistically significant differences (two-sided pairwise Wilcoxon rank sum test with Bonferroni correction: P < 0.05). The exact P-values are provided with the source data. Source data

Comment in

  • Fast track to mutualism.
    Kaltenpoth M. Kaltenpoth M. Nat Microbiol. 2022 Aug;7(8):1104-1105. doi: 10.1038/s41564-022-01188-8. Nat Microbiol. 2022. PMID: 35927447 No abstract available.

Similar articles

Cited by

References

    1. McFall-Ngai M, et al. Animals in a bacterial world, a new imperative for the life sciences. Proc. Natl Acad. Sci. USA. 2013;110:3229–3236. doi: 10.1073/pnas.1218525110. - DOI - PMC - PubMed
    1. Gilbert SF, Bosch TCG, Ledón-Rettig C. Eco-Evo-Devo: developmental symbiosis and developmental plasticity as evolutionary agents. Nat. Rev. Genet. 2015;16:611–622. doi: 10.1038/nrg3982. - DOI - PubMed
    1. Hoang KL, Moran LT, Gerardo NM. Experimental evolution as an underutilized tool for studying beneficial animal–microbe interactions. Front. Microbiol. 2016;7:1444. doi: 10.3389/fmicb.2016.01444. - DOI - PMC - PubMed
    1. King KC, et al. Rapid evolution of microbe-mediated protection against pathogens in a worm host. ISME J. 2016;10:1915–1924. doi: 10.1038/ismej.2015.259. - DOI - PMC - PubMed
    1. Pankey MS, et al. Host-selected mutations converging on a global regulator drive an adaptive leap towards symbiosis in bacteria. eLife. 2017;6:e24414. doi: 10.7554/eLife.24414. - DOI - PMC - PubMed

Publication types

LinkOut - more resources