. 2022 Aug;24(8):1252-1264.
doi: 10.1038/s41556-022-00965-1. Epub 2022 Aug 4.

Nucleotide imbalance decouples cell growth from cell proliferation

Affiliations

Nucleotide imbalance decouples cell growth from cell proliferation

Frances F Diehl et al. Nat Cell Biol. 2022 Aug.

Abstract

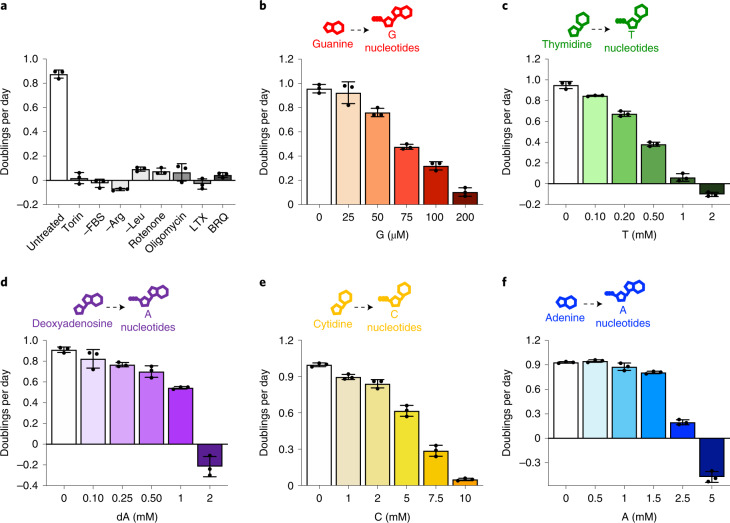
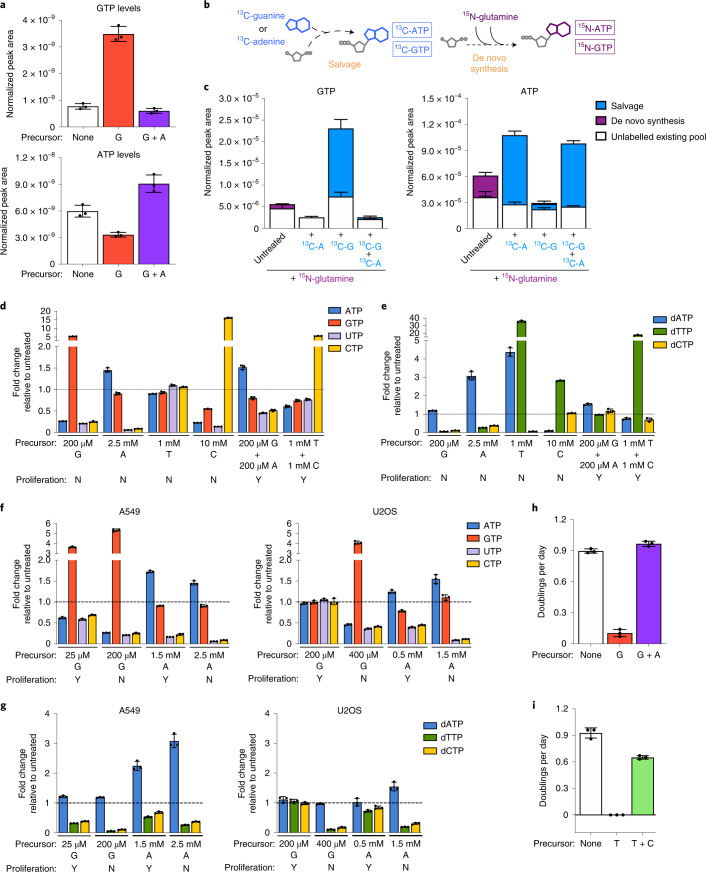
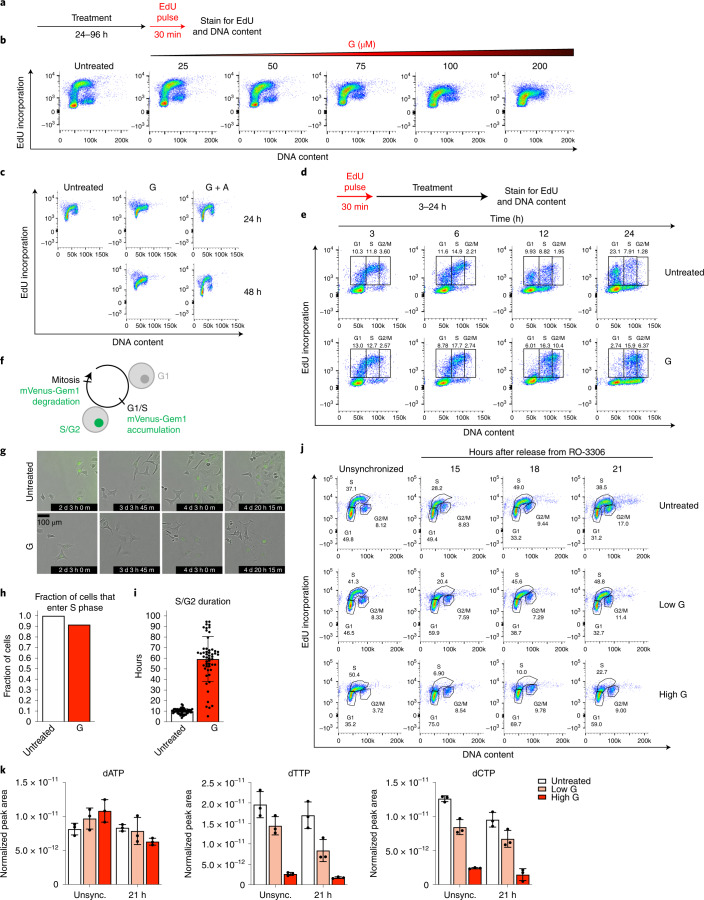
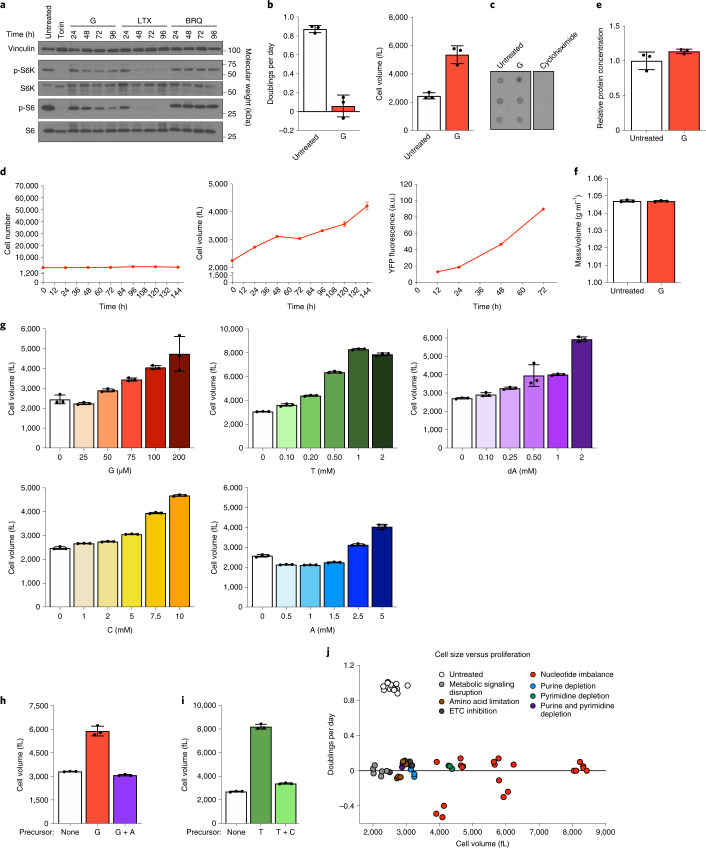
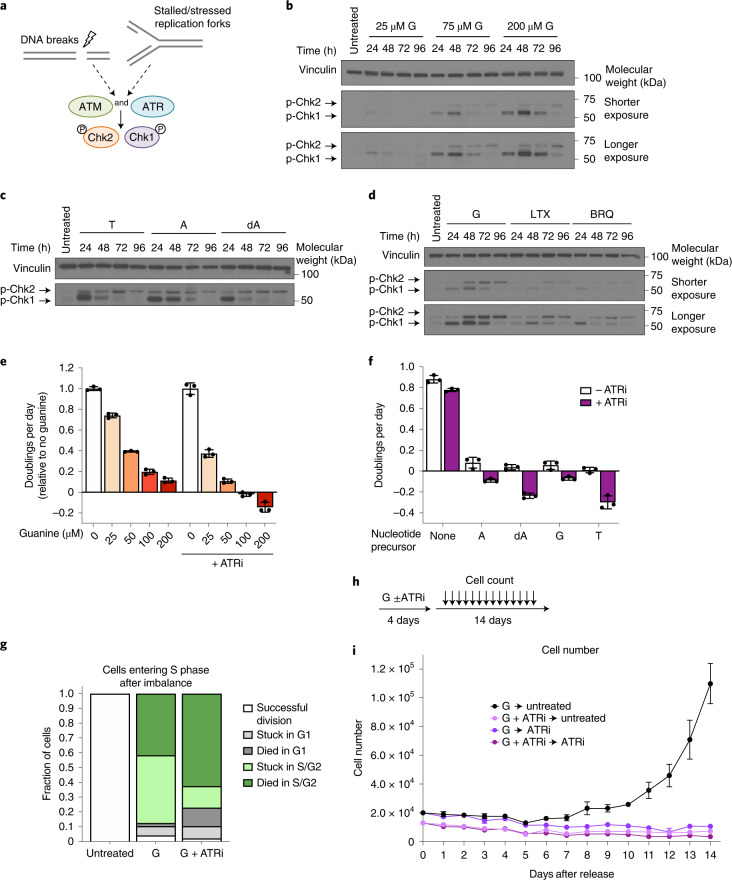
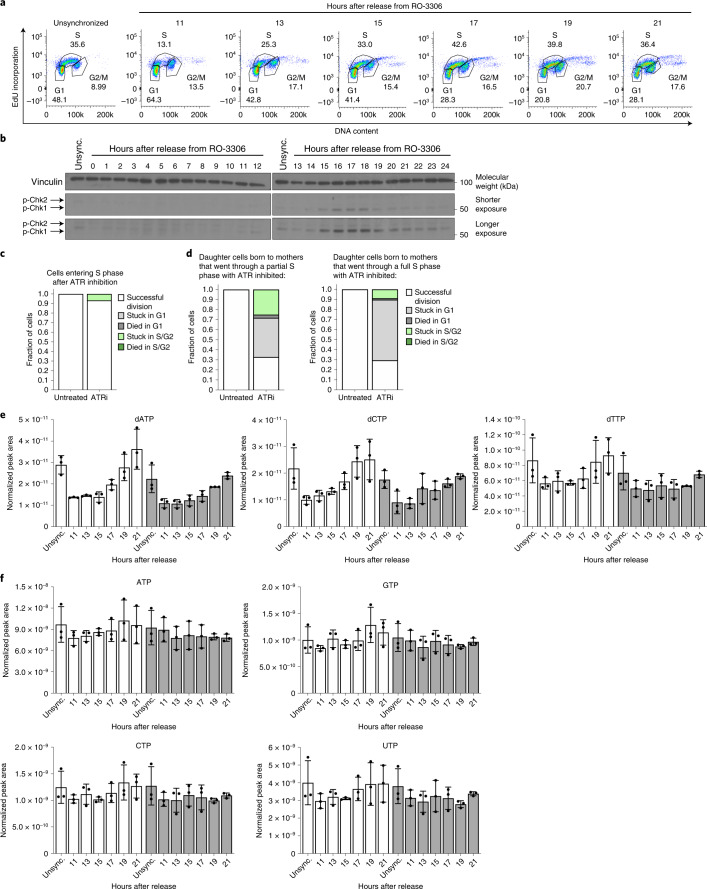
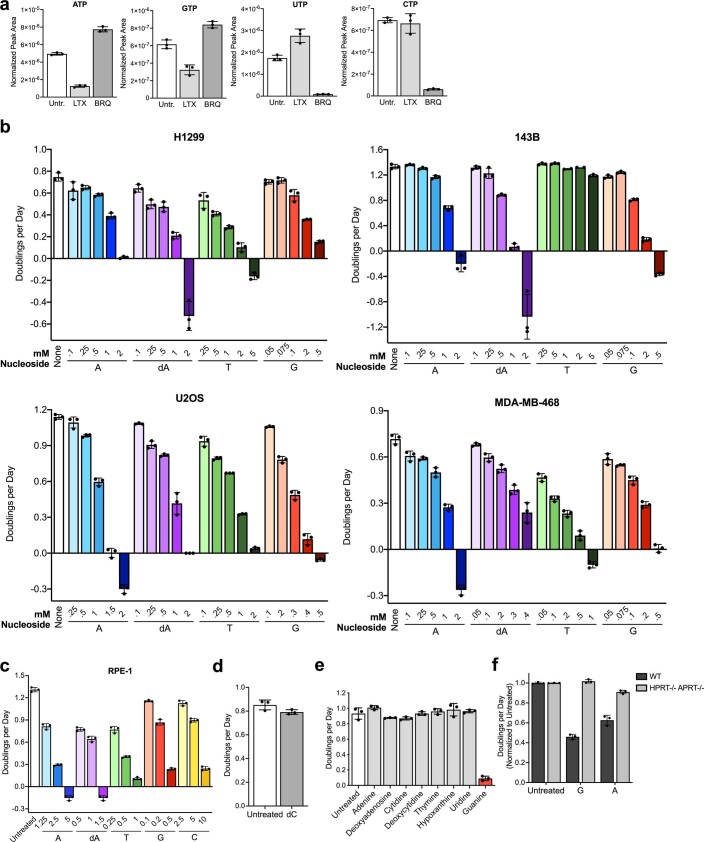
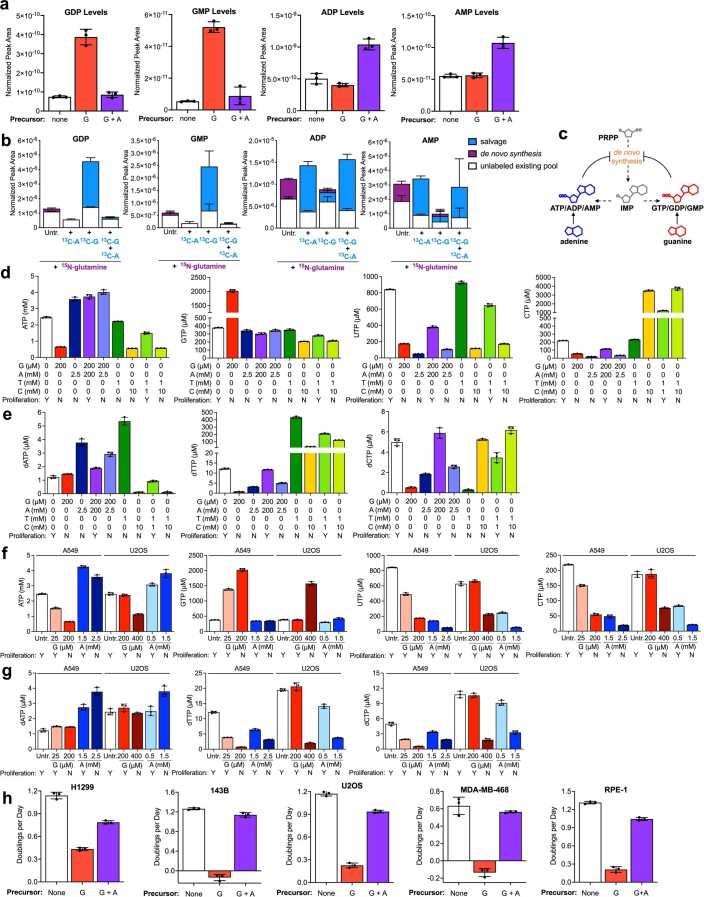
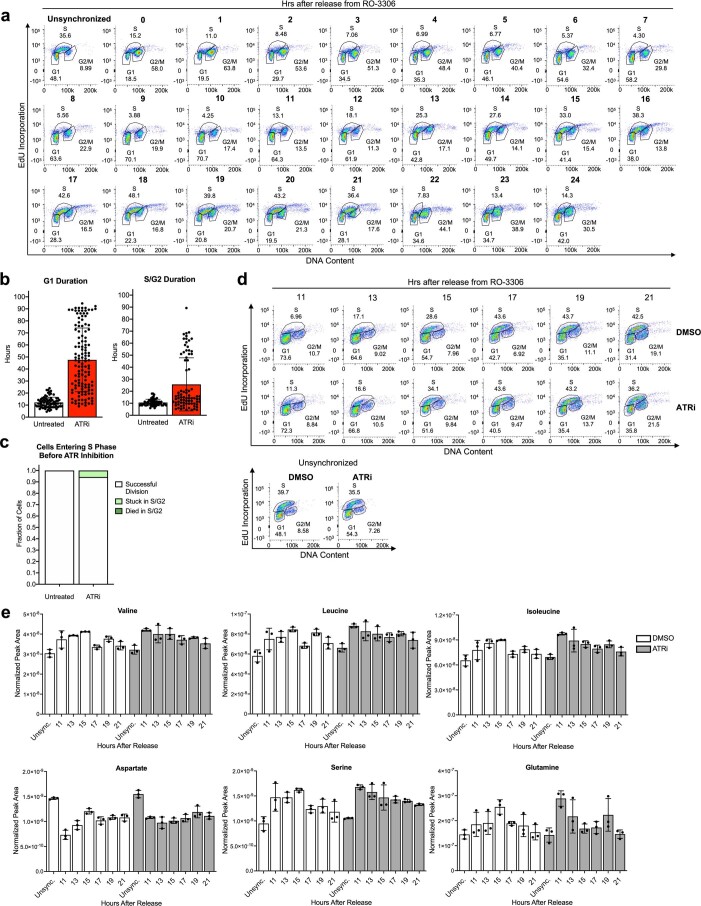
Nucleotide metabolism supports RNA synthesis and DNA replication to enable cell growth and division. Nucleotide depletion can inhibit cell growth and proliferation, but how cells sense and respond to changes in the relative levels of individual nucleotides is unclear. Moreover, the nucleotide requirement for biomass production changes over the course of the cell cycle, and how cells coordinate differential nucleotide demands with cell cycle progression is not well understood. Here we find that excess levels of individual nucleotides can inhibit proliferation by disrupting the relative levels of nucleotide bases needed for DNA replication and impeding DNA replication. The resulting purine and pyrimidine imbalances are not sensed by canonical growth regulatory pathways like mTORC1, Akt and AMPK signalling cascades, causing excessive cell growth despite inhibited proliferation. Instead, cells rely on replication stress signalling to survive during, and recover from, nucleotide imbalance during S phase. We find that ATR-dependent replication stress signalling is activated during unperturbed S phases and promotes nucleotide availability to support DNA replication. Together, these data reveal that imbalanced nucleotide levels are not detected until S phase, rendering cells reliant on replication stress signalling to cope with this metabolic problem and disrupting the coordination of cell growth and division.


Conflict of interest statement

The authors are aware of no direct conflicts with the topic of the study; however, F.F.D. and M.G.V.H. are included on a patent application regarding impact of nucleotide imbalance on cell state. S.R.M. declares he is a co-founder of Affinity Biosensors and Travera, and M.G.V.H. declares he is an advisory board member for Agios Pharmaceuticals, Aeglea Biotherapeutics, Faeth Therapeutics, Drioa Ventures and iTeos Therapeutics, and a co-founder of Auron Therapeutics. The other authors declare no competing interests.

Figures

Fig. 1
Fig. 1. Excess individual nucleotides can impair proliferation.
a, Proliferation rates of A549 cells cultured in standard conditions (untreated) or with 1 µM Torin1, without serum (−FBS), without arginine (−Arg), without leucine (−Leu), with 100 nM rotenone, with 5 nM oligomycin, with 1 µM lometrexol (LTX) or with 1 µM brequinar (BRQ). bf, Proliferation rates of A549 cells treated with the indicated concentration of guanine (G), thymidine (T), deoxyadenosine (dA), cytidine (C) or adenine (A). Each of these nucleobases/nucleosides can be salvaged to produce intracellular nucleotides as shown. Data are presented as mean ± standard deviation (s.d.) of three biological replicates. Source numerical data are available in source data. Source data
Fig. 2
Fig. 2. Nucleotide salvage leading to imbalanced nucleotide pools inhibits cell proliferation.
a, GTP and ATP levels in A549 cells cultured in standard conditions (none) or treated for 24 h with 200 µM guanine (G) with or without 200 µM adenine (A) as indicated. b, Schematic showing how stable isotope tracing was used to determine the source of intracellular purines. Salvage of 13C-guanine or 13C-adenine produces 13C-labelled GTP and ATP. The 15N label from amide-15N-glutamine is incorporated in de novo purine synthesis, producing 15N-labelled ATP and GTP. c, Total levels and labelling of GTP and ATP in A549 cells cultured for 24 h in medium containing amide-15N-glutamine with or without 200 µM 13C-guanine and/or 13C-adenine as indicated. d, Fold change in the specified intracellular NTP levels in A549 cells cultured with the indicated concentrations of nucleotide precursors compared with those found in cells cultured in standard conditions. e, Fold change in the specified intracellular dNTP levels in A549 cells cultured with the indicated concentrations of nucleotide precursors compared with those found in cells cultured in standard conditions. f, Fold change in the specified intracellular NTP levels in A549 or U2OS cells cultured with the indicated concentrations of nucleotide precursors compared with those found in cells cultured in standard conditions. g, Fold change in the specified intracellular dNTP levels in A549 or U2OS cells cultured with the indicated concentrations of nucleotide precursors compared with those found in cells cultured in standard conditions. h, Proliferation rates of A549 cells cultured in standard conditions (none) or treated with 200 µM G with or without 200 µM A. i, Proliferation rates of A549 cells cultured in standard conditions (none) or treated with 1 mM T with or without 1 mM C. All nucleotide levels were measured using LCMS. Fold changes in nucleotide levels were calculated from absolute concentrations presented in Extended Data Fig. 2d–g. Data are presented as mean + /- SD of 3 biological replicates. Source numerical data are available in source data. Source data
Fig. 3
Fig. 3. Nucleotide imbalance impairs S phase progression.
a, Approach using flow cytometry to assess cell cycle phase by DNA content (as determined by propidium iodide staining) and EdU incorporation. b, Cell cycle distribution of A549 cells cultured with the indicated concentration of guanine (G) for 24 h. c, Cell cycle distribution of A549 cells treated with or without 200 µM G with or without 200 µM adenine (A) for 24 or 48 h. d, Approach to assess S phase progression. After pulsing cells with EdU, cell cycle progression of EdU-positive and EdU-negative populations was monitored. e, Cell cycle distribution of A549 cells pulsed with EdU, then cultured with or without 200 µM G for the indicated time. Percentage of total cells that are EdU-positive and in G1, S or G2/M phase is shown. f, mVenus-Gem1 fluorescent reporter to assess cell cycle dynamics in live cells. g, Representative images from live-cell imaging of A549 cells expressing mVenus-Gem1 cultured with or without 200 µM G (see also Supplementary Videos 1–3). h, Fraction of cells cultured with or without 200 µM G that began the experiment in G1 phase and entered S phase (assessed by live-cell imaging of A549 cells expressing mVenus-Gem1; 76 cells were analysed). i, Duration of S/G2 phase in cells cultured with or without 200 µM G (assessed by live-cell imaging of A549 cells expressing mVenus-Gem1; 115 cells were analysed). j, Cell cycle distribution of A549 cells synchronized in G2 phase with 4.5 µM RO-3306 for 18 h, then released from arrest and treated with standard culture media (untreated), 25 µM G (low G) or 200 µM G (high G) as indicated. k, dNTP levels in A549 cells 21 h after release from RO-3306 and subsequent treatment with or without low G or high G as indicated. dNTP levels in unsynchronized cells cultured with or without low G or high G for 24 h are also shown. dNTPs were measured using LCMS. Data are presented as mean ± s.d. of three biological replicates. Source numerical data are available in source data. Source data
Fig. 4
Fig. 4. Nucleotide imbalance causes continued cell growth without division.
a, Phosphorylation of ribosomal protein S6 and S6 kinase (S6K) in A549 cells cultured with or without 1 µM Torin 1, or 200 µM guanine (G), 1 µM lometrexol (LTX) or 1 µM brequinar (BRQ) for the indicated time. Levels of vinculin, total S6K and total S6 are also shown. b, Proliferation rate (left) and mean volume (right) of A549 cells cultured with or without 200 µM G. c, Global protein synthesis measured by puromycin incorporation into nascent peptides in A549 cells cultured with or without 200 µM G for 96 h. Cycloheximide treatment was used as a negative control. d, Cell number (left), mean volume (centre) and protein accumulation (right) in A549 cells treated with 200 µM G. Protein accumulation was determined using a YFP reporter (Extended Data Fig. 4e). e, Protein concentration in A549 cells cultured with or without 200 µM G, calculated by dividing total protein by cell number and volume. f, Density of A549 cells cultured with or without 200 µM G for 72 h, calculated by dividing cell mass by cell volume. g, Mean volume of A549 cells treated for 96 h with the indicated concentrations of G, thymidine (T), deoxyadenosine (dA), cytidine (C) or adenine (A). h, Mean volume of A549 cells cultured with or without 200 µM G with or without 200 µM A for 96 h. i, Mean volume of A549 cells cultured with or without 1 mM T with or without 1 mM C for 96 h. j, Proliferation rate and size of A549 cells cultured in conditions that perturb cell metabolism. Data are compiled from experiments shown in Figs. 1a–f, 2h,i and 4g–i, and Extended Data Fig. 4j. Conditions are grouped into signalling disruption (Torin treatment or serum withdrawal), amino acid limitation (leucine or arginine starvation), electron transport chain (ETC) inhibition (oligomycin or rotenone treatment), purine or pyrimidine depletion (using LTX or BRQ), or nucleotide imbalance. Data are presented as mean ± s.d. of three biological replicates. Source numerical data and unprocessed blots are available in source data. Source data
Fig. 5
Fig. 5. Replication stress signalling promotes cell survival and recovery from nucleotide imbalance.
a, ATR and ATM kinases respond to replication stress and DNA damage. ATR and ATM phosphorylate Chk1 and Chk2, respectively. b, Phosphorylation of Chk1 and Chk2 in A549 cells treated for the indicated time with the indicated concentration of guanine (G). c, Phosphorylation of Chk1 and Chk2 in A549 cells treated for the indicated amount of time with 1 mM thymidine (T), 2.5 mM adenine (A) or 1.5 mM deoxyadenosine (dA). d, Phosphorylation of Chk1 and Chk2 in A549 cells treated for the indicated time with 200 µM G, 1 µM LTX or 1 µM BRQ. Levels of vinculin are also shown in all western blots as a loading control. e, Proliferation rates of A549 cells treated with the indicated concentration of guanine with or without 50 nM of the ATR kinase inhibitor AZ20 (ATRi) as indicated. f, Proliferation rates of A549 cells cultured with or without 2 mM A, 1.5 mM dA, 200 µM G or 1 mM T, with or without 50 nM ATRi as indicated. g, Cell fate of A549 cells expressing the mVenus-Gem1 reporter that were in G1 phase at the time of addition of 200 µM G with or without 50 nM ATRi, as assessed using live-cell imaging. The fate of cells in that were in G1 at the beginning of the experiment and were not exposed to excess G is also shown (untreated). In total, 124 cells were analysed. h, Approach to assess how cells recover from treatment with excess G. Cells were cultured in medium containing 200 µM G with or without 50 nM ATRi for 4 days. Medium was then changed to untreated medium or medium containing 50 nM ATRi, and cell number was determined every 24 h for 14 days thereafter. i, A549 cell number over time after release from treatment with G with or without ATRi treatment as outlined in h. Data are presented as mean ± s.d. of three biological replicates. Source numerical data and unprocessed blots are available in source data. Source data
Fig. 6
Fig. 6. ATR signalling promotes dNTP availability during unperturbed S phases.
a, Cell cycle distribution of A549 cells corresponding to western blots in b. Cells were treated with 9 µM RO-3306 for 18 h to arrest cells in G2 phase, then released for the indicated time. b, Phosphorylation of Chk1 and Chk2 in A549 cells treated with 9 µM RO-3306 for 18 h to arrest cells in G2 phase, then released for the indicated time. Levels of vinculin are also shown. c, Cell fate assessed using live-cell imaging of A549 mother cells expressing mVenus-Gem1 that were in G1 phase at the time of 50 nM AZ20 (ATRi) addition. The fate of mother cells in G1 not exposed to ATRi is also shown (untreated). Fifty-five cells were analysed. d, Cell fate of A549 daughter cells expressing the mVenus-Gem1 reporter born to mother cells either in S/G2 phase (left) or G1 phase (right) at the time of 50 nM ATRi addition. Mother cells that were in S/G2 phase when ATRi was added went through a partial S phase with ATR inhibited, whereas mother cells that were in G1 phase went through a full S phase with ATR inhibited. The fate of daughter cells not exposed to ATRi is also shown (untreated). For left and right graphs, 104 and 107 cells were analysed, respectively. e, dNTP levels in A549 cells synchronized in G2 phase by treating with 4.5 µM RO-3306 for 18 h, then released from RO-3306 and treated with DMSO or 50 nM ATRi for the indicated times. Unsynchronized cells (unsync.) were treated with DMSO or 50 nM ATRi for 24 h as indicated. f, NTP levels in A549 cells synchronized in G2 phase by treating with 4.5 µM RO-3306 for 18 h, then released and treated with DMSO or 50 nM ATRi for the indicated times. Unsync. cells were treated with DMSO or 50 nM ATRi for 24 h as indicated. Nucleotide levels were measured using LCMS. Data are presented as mean ± s.d. of three biological replicates. Source numerical data and unprocessed blots are available in source data. Source data
Extended Data Fig. 1
Extended Data Fig. 1. Salvage of different nucleobases and nucleosides can inhibit proliferation in different cell types.
a, Intracellular nucleotide levels in A549 cells cultured in standard conditions (Untr.) or treated with 1 µM lometrexol (LTX) or 1 µM brequinar (BRQ) as indicated. b, Proliferation rates of the indicated cells in standard culture conditions (None) or treated with the indicated concentrations of adenine (A), deoxyadenosine (dA), thymidine (T), or guanine (G). Of note, 143B cells are deficient in thymidine kinase, and therefore cannot salvage thymidine to produce dTMP. c, Proliferation rates of RPE-1 cells in standard culture (Untreated) or treated with the indicated concentrations of A, dA, T, G, or cytidine (C). d, Proliferation rates of A549 cells in standard culture conditions (Untreated) or treated with 14 mM deoxycytidine (dC). e, Proliferation rates of A549 cells in standard culture conditions (Untreated) or treated with 200 µM of the indicated nucleobase/nucleoside. f, Normalized proliferation rates of A9 cells that are wild type (WT) or deficient (HPRT-/- APRT-/-) for hypoxanthine-guanine phosphoribosyltransferase and adenine phosphoribosyltransferase in standard culture conditions (Untreated) or treated with 200 µM G or A. Data are presented as mean + /- SD of 3 biological replicates. Source numerical data are available in source data. Source data
Extended Data Fig. 2
Extended Data Fig. 2. Salvage of excess nucleotide precursors can induce nucleotide imbalance and impair proliferation.
a, Levels of the indicated nucleotides in A549 cells cultured in standard conditions (none) or treated for 24 hours with 200 µM guanine (G) with or without 200 µM adenine (A) as indicated. b, Total levels and labeling of the indicated nucleotides in A549 cells cultured for 24 hours in media containing 15N-amide-glutamine with or without 200 µM 13C-guanine (13C-G) and/or 13C-adenine (13C-A) as indicated. c, Diagram showing feedback regulation of purine synthesis. Adenylate and guanylate purines can allosterically inhibit enzymes involved in de novo purine synthesis. PRPP, phosphoribosyl pyrophosphate; IMP, inosine monophosphate. d, Absolute quantification of intracellular NTPs in A549 cells treated with the indicated concentrations of G, A, thymidine (T), or cytidine (C). Also indicated is whether supplementing culture media with that concentration of G, A, T and/or C does (Y) or does not (N) allow cell proliferation. e, Absolute quantification of intracellular dNTPs in A549 cells treated with the indicated concentrations of G, A, T, or C. Also indicated is whether supplementing culture media with that concentration of G, A, T and/or C does (Y) or does not (N) allow cell proliferation. f, Absolute quantification of intracellular NTPs in A549 cells and U2OS cells treated with the indicated concentrations of G or A. Also indicated is whether supplementing culture media with that concentration of G or A does (Y) or does not (N) allow cell proliferation. The data from A549 Untreated (Untr.), 200 µM G, and 2.5 mM A samples are the same as shown in panel d. g, Absolute quantification of intracellular dNTPs in A549 cells and U2OS cells treated with the indicated concentrations of G or A. Also indicated is whether supplementing culture media with that concentration of G or A does (Y) or does not (N) allow cell proliferation. The data from A549 Untr., 200 µM G, and 2.5 mM A samples are the same as shown in panel e. h, Proliferation rates of H1299, 143B, U2OS, MDA-MB-468, and RPE-1 cells in standard culture conditions (None) or treated with 200 µM G with or without 200 µM A, or 500 µM G with or without 500 µM A for RPE-1 cells, as indicated. All nucleotide levels were measured using LCMS. Data are presented as mean + /- SD of 3 biological replicates. Source numerical data are available in source data. Source data
Extended Data Fig. 3
Extended Data Fig. 3. Nucleotide imbalance and depletion differentially alter cell cycle progression.
a, Gating strategy for live cells based on forward scatter (FSC) and side scatter (SSC). b, Cell cycle distribution as assessed by propidium iodide staining and EdU incorporation of A549 cells cultured for 24 hours in standard media (Untreated), in media lacking FBS (Serum-starved), or with 10 µM Taxol. Cells were pulsed with EdU for 30 minutes after each treatment and analyzed as outlined in Fig. 3a. c, Cell cycle distribution of H1299 cells cultured for 24 hours in standard conditions (Untreated) or treated with 500 µM guanine (G) with or without 500 µM adenine (A) as indicated. Cells were pulsed with EdU for 30 minutes after each treatment and analyzed as outlined in Fig. 3a. d, Cell cycle distribution of A549 cells cultured in standard conditions (Untreated) or treated for the indicated amount of time with 200 µM G, 1 µM lometrexol (LTX), or 1 µM brequinar (BRQ) as indicated. Cells were pulsed with EdU for 30 minutes after each treatment and analyzed as outlined in Fig. 3a. e, Cell cycle distribution of A549 cells cultured in standard conditions (Untreated) or treated with 1 mM thymidine for the indicated amount of time. As EdU is a thymidine analog, thymidine supplementation is expected to blunt EdU incorporation. Cells were pulsed with EdU for 30 minutes after each treatment and analyzed as outlined in Fig. 3a. f, Cell cycle distribution of the indicated cells cultured in standard conditions (Untreated) or treated with the following concentrations of nucleotide precursors: A549 - 200 µM G, 1 mM T, 2.5 mM A, or 10 mM C; H1299 - 500 µM G, 1 mM T, 2.5 mM A, or 10 mM C; RPE-1 - 500 µM G, 1 mM T, 2.5 mM A, or 10 mM C. Cells were pulsed with EdU for 30 minutes after each treatment and analyzed as outlined in Fig. 3a. g, Cell cycle distribution of A549 cells pulsed with EdU (as outlined in Fig. 3d) and then cultured for the indicated amount of time in standard conditions (Untreated), in media lacking FBS (Serum-starved), or with 10 µM Taxol as indicated. The percentage of total cells that are EdU-positive and in G1, S, or G2/M phase is also shown. The Untreated samples shown are from the same experiment shown in Fig. 3e. h, Duration of G1 phase in A549 cells expressing an mVenus-Gem1 reporter (see Fig. 3f) cultured in standard conditions (Untr.) or with 200 µM G as assessed using live-cell imaging. 87 cells were analyzed. Data are presented as mean + /- SD. Source numerical data are available in source data. Source data
Extended Data Fig. 4
Extended Data Fig. 4. Under nucleotide imbalance, continued cell growth and S phase entry do not correlate with changes in growth signaling.
a, Western blot assessing phosphorylation of ribosomal protein S6 and S6 kinase (S6K) in A549 cells cultured in standard conditions (Untreated) or treated with 1 mM thymidine (T), 2.5 mM adenine (A), or 1.5 mM deoxyadenosine (dA) for the indicated time. Levels of vinculin, total S6K, and total S6 are also shown as controls. b, Western blots assessing phosphorylation of Akt in 143B cells (top) and H1299 cells (bottom) cultured in standard conditions (Untreated) or treated with 1 µM Torin, 200 µM guanine (G), 1 µM lometrexol (LTX), 1 µM brequinar (BRQ), 1 mM T, 2.5 mM A, or 1.5 mM dA for the indicated time. Levels of vinculin and total Akt are also shown as controls. c, Western blots assessing phosphorylation of AMPK in A549, H1299, or 143B cells cultured in standard conditions (Untreated) or treated with 1 µM Torin or 200 µM G for the indicated time. Levels of vinculin and total AMPK are also shown as controls. d, Western blots assessing phosphorylation of ribosomal protein S6 and S6K in H1299 cells cultured in standard conditions (Untreated) or treated with 1 µM Torin, 200 µM G, 1 µM LTX, 1 µM BRQ, 1 mM T, 2.5 mM A, or 1.5 mM dA for the indicated time. Levels of vinculin, total S6K, and total S6 are also shown as controls. e, Schematic of a protein synthesis reporter construct where a CMV promoter drives expression of YFP fused to an engineered unstable E. coli dihydrofolate reductase that acts as a degron (dhfr-DD). f, Mean volume of the indicated cells cultured in standard conditions (None) or treated for 96 hours with the indicated concentration of A, dA, T, or G. 143B cells are deficient for thymidine kinase, and therefore cannot salvage thymidine to produce dTMP. g, Mean volume of RPE-1 cells cultured in standard conditions (None) or treated for 96 hours with the indicated concentration of A, dA, T, G, or cytidine (C). h, Mean volume of A549 cells cultured in standard conditions (Untreated) or treated with 200 µM of the indicated nucleobase/nucleoside for 96 hours. i, Mean volume of A549 cells cultured for 96 hours in standard culture conditions (Untreated), or with 1 µM Torin1, without serum (-FBS), without arginine (-Arg), without leucine (-Leu), with 100 nM rotenone, with 5 nM oligomycin, with 1 µM LTX, or with 1 µM BRQ as indicated. j, Proliferation rate (top) and mean volume (bottom) of A549 cells cultured in standard conditions (Untr.) or treated for 96 hours with 1 µM LTX, 1 µM BRQ, or both LTX and BRQ as indicated. k, Proliferation rate (top) and mean volume (bottom) of H1299, 143B, and RPE-1 cells cultured in standard conditions (Untr.) or treated for 96 hours with 1 µM LTX or 1 µM BRQ as indicated. l, Phosphorylation of ribosomal protein S6 in A549 cells cultured for 16 hours in standard conditions (Untreated) or with 1 µM LTX, then supplemented for 1 hour with the indicated concentrations in µM of hypoxanthine (H), G, or A. Levels of vinculin and total S6 are also shown as controls. m, Phosphorylation of ribosomal protein S6 in A549 cells cultured for 24 hours in standard conditions (Untreated) or treated with 1 µM LTX with or without the indicated concentrations in µM of H, G, or A. Levels of vinculin and total S6 are also shown as controls. n, Proliferation rates of A549 cells cultured in media with or without 1 µM LTX, and with or without the indicated concentrations of G, A, or H. o, Cell cycle distribution of A549 cells cultured in standard conditions (Untreated), or with 1 µM LTX with or without 200 µM G, 200 µM H, or 200 µM A as indicated, or with 10 µM Torin, 200 µM G, or both Torin and G for the indicated time. Cells were pulsed with EdU for 30 minutes after each treatment and then analyzed as outlined in Fig. 3a. Data are presented as mean ± SD of 3 biological replicates. Source numerical data and unprocessed blots are available in source data. Source data
Extended Data Fig. 5
Extended Data Fig. 5. Imbalanced nucleotides induce replication stress signaling.
a, Western blot assessing phosphorylation of Chk1 and Chk2 in A549 cells cultured for the indicated time in standard media (Untreated) or media lacking leucine, or with addition of 200 µM guanine or 20 µM deoxyguanosine, with or without addition of 200 µM adenine as indicated. Levels of vinculin are also shown as a loading control. b, Western blot assessing phosphorylation of Chk1 and Chk2 in 143B cells cultured in standard conditions (Untreated) or treated with 200 µM guanine (G), 1 µM lometrexol (LTX), 1 µM brequinar (BRQ), 1 mM thymidine (T), 2.5 mM adenine (A), or 1.5 mM deoxyadenosine (dA) for the indicated time, or treated with 1 µM Torin for 24 hours. Levels of vinculin are also shown as a loading control. c, Western blot assessing phosphorylation of Chk1 and Chk2 in H1299 cells cultured in standard conditions (Untreated), treated with 200 µM G, 1 mM T, 2.5 mM A, or 1.5 mM dA for the indicated time, treated with 1 µM Torin for 24 hours, or treated with 1 µM LTX or 1 µM BRQ for 96 hours. Levels of vinculin are also shown as a loading control. d, Western blot showing levels of p53 and p21 in A549 cells in standard media (Untreated) or cultured for the indicated time with the indicated concentration of G. Levels of vinculin are also shown as a loading control. e, Comet assay to assess the presence of both single-stranded DNA and double-stranded DNA breaks (DNA damage) in A549 cells treated without (Untreated) or with 200 µM guanine for 24 hours. 529 cells were analyzed. Data are presented as mean + /- SD. Numerical source data and unprocessed blots are available in source data. Source data
Extended Data Fig. 6
Extended Data Fig. 6. ATR signaling impacts the fate of cells with imbalanced nucleotides.
a, Schematic outlining how ATR and ATM kinases respond to replication stress and DNA damage. The ATR and ATM targets Chk1 and Chk2 activate downstream effectors that halt cell cycle progression. AZ20 is an inhibitor of ATR kinase activity. b, Western blot assessing phosphorylation of Chk1 and Chk2 in A549 cells cultured in standard media (Untreated) or treated for the indicated time with 200 µM guanine (G) with or without 50 nM AZ20. Levels of vinculin are also shown as a control. c, Proliferation rates of 143B and H1299 cells treated with the indicated concentration of G with or without 50 nM AZ20 (ATRi). d, Cell death measured in A549 cells cultured for 96 hours in standard conditions (Untreated) or treated with 200 µM G with or without 50 nM ATRi as indicated. e, Proliferation rates of H1299 cells cultured in standard conditions (none) or treated with 2 mM adenine (A), 1.5 mM deoxyadenosine (dA), 200 µM G, or 1 mM thymidine (T), with or without 50 nM ATRi as indicated. f. Proliferation rates (left) and Western blot assessing phosphorylation of Chk1 (right) in A549 cells treated with or without 200 µM G with or without 0.6 µM of the ATR inhibitor VE821. Levels of vinculin are also shown as a control. g, Proliferation rates of A549 cells cultured in standard conditions (Untreated) or treated with 1 µM lometrexol (LTX) or 1 µM brequinar (BRQ) with or without 50 nM AZ20 (ATRi) as indicated. h, Cell fate as assessed using live-cell imaging of A549 mother cells expressing the mVenus-Gem1 reporter that were in S/G2 phase at the time of addition of 200 µM G with or without 50 nM AZ20 (ATRi). The fate of mother cells in S/G2 not exposed to excess G is also shown (Untreated). 83 cells were analyzed. i, Cell fate as assessed using live-cell imaging of A549 daughter cells expressing the mVenus-Gem1 reporter that were born after the addition of 200 µM G with or without 50 nM AZ20 (ATRi). The fate of daughter cells not exposed to excess G is also shown (Untreated). 158 cells were analyzed. j. SA-β-galactosidase activity was assayed in A549 cells cultured in standard conditions (Untreated), treated with 200 µM G for 96 hrs, or treated with 200 µM G with or without 50 nM AZ20 (ATRi) for 96 hrs and then switched to untreated media for 7 days (Recovery). Cells treated with Palbociclib for 7 days were included as a control. k, Mean volume of A549 cells measured over time after release from treatment with G with or without AZ20 (ATRi) as described in Fig. 5h. l, Cell cycle distribution as assessed by DNA content of A549 cells treated with 200 µM G with or without 50 nM AZ20 (ATRi) for the indicated time. Data are presented as mean ± SD of 3 biological replicates. Source numerical data and unprocessed blots are available in source data. Source data
Extended Data Fig. 7
Extended Data Fig. 7. Amino acid levels remain relatively constant during unperturbed cell cycles and are not impacted by loss of ATR signaling.
a, Cell cycle distribution of A549 cells corresponding to Western blots shown in Fig. 6b. Cells were arrested in G2 phase by treating with 9 µM RO-3306 for 18 hours, then RO-3306 was removed to release from cell cycle arrest for the indicated time. A549 cells in standard culture are also shown (Unsynchronized). Cells were pulsed with EdU for 30 minutes prior to each time point and analyzed as outlined in Fig. 3a. b, Duration of G1 phase and S/G2 phases in A549 cells expressing the mVenus-Gem1 reporter cultured in standard conditions (Untreated) or with 50 nM AZ20 (ATRi), as assessed using live-cell imaging. 87 cells were analyzed. c, Cell fate as assessed using live-cell imaging of A549 mother cells expressing the mVenus-Gem1 reporter that were in S/G2 phase when 50 nM ATRi was added. The fate of mother cells in S/G2 not exposed to ATRi is also shown (Untreated). 55 cells were analyzed. d, Cell cycle distribution of A549 cells corresponding to the metabolite measurements shown in panel e, and in Fig. 6e and 6f. Cells were arrested in G2 phase by treating with 4.5 µM RO-3306 for 18 hours, then RO-3306 was removed to release from cell cycle arrest for the indicated time. Cells were pulsed with EdU for 30 minutes prior to each time point and analyzed as outlined in Fig. 3a. Unsynchronized cells were treated with DMSO or 50 nM ATRi for 24 hours as indicated. e, Levels of the indicated amino acids in A549 cells synchronized in G2 phase by treating with 4.5 µM RO-3306 for 18 hours, then released into the cell cycle for the indicated time. At the time of release from RO-3306, cells were either treated with DMSO or 50 nM ATRi as indicated. Unsynchronized cells (Unsync.) were treated with DMSO or 50 nM ATRi for 24 hours as indicated. All metabolite levels were measured by LCMS. Data are presented as mean ± SD of 3 biological replicates. Source numerical data are available in source data. Source data

Similar articles

Cited by

References

    1. Zhu J, Thompson CB. Metabolic regulation of cell growth and proliferation. Nat. Rev. Mol. Cell Biol. 2019;20:436–450. doi: 10.1038/s41580-019-0123-5. - DOI - PMC - PubMed
    1. Vander Heiden MG, DeBerardinis RJ. Understanding the intersections between metabolism and cancer biology. Cell. 2017;168:657–669. doi: 10.1016/j.cell.2016.12.039. - DOI - PMC - PubMed
    1. Lane AN, Fan TW-M. Regulation of mammalian nucleotide metabolism and biosynthesis. Nucleic Acids Res. 2015;43:2466–2485. doi: 10.1093/nar/gkv047. - DOI - PMC - PubMed
    1. Liu Q, et al. Chk1 is an essential kinase that is regulated by Atr and required for the G2/M DNA damage checkpoint. Genes Dev. 2000;14:1448–1459. doi: 10.1101/gad.14.12.1448. - DOI - PMC - PubMed
    1. Forey R, et al. Mec1 is activated at the onset of normal S phase by low-dNTP pools impeding DNA replication. Mol. Cell. 2020;78:396–410.e4. doi: 10.1016/j.molcel.2020.02.021. - DOI - PubMed

Publication types

Substances