. 2022 Aug 4;12(1):13443.
doi: 10.1038/s41598-022-17575-4.

Revealing four decades of snow cover dynamics in the Hindu Kush Himalaya

Affiliations

Revealing four decades of snow cover dynamics in the Hindu Kush Himalaya

K Naegeli et al. Sci Rep. .

Abstract

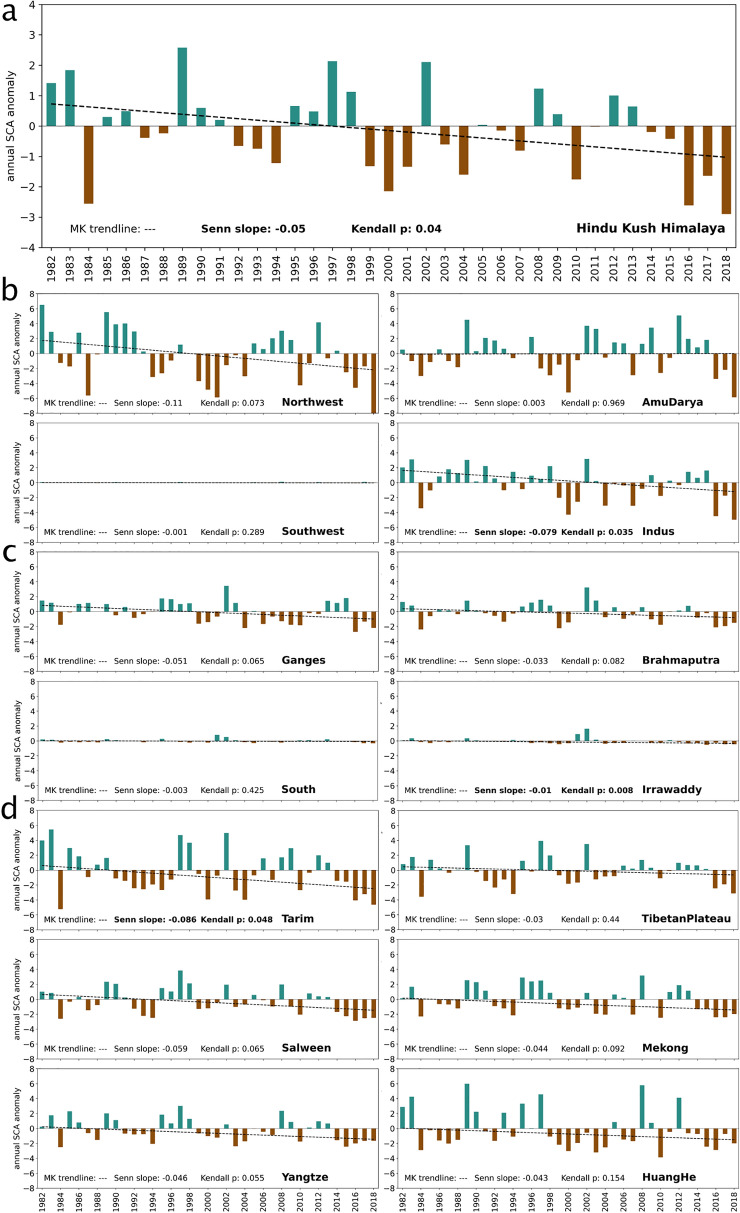
Knowledge about the distribution and dynamics of seasonal snow cover (SSC) is of high importance for climate studies, hydrology or hazards assessment. SSC varies considerably across the Hindu Kush Himalaya both in space and time. Previous studies focused on regional investigations or the influence of snow melt on the local hydrological system. Here, we present a systematic assessment of metrics to evaluate SSC dynamics for the entire HKH at regional and basin scale based on AVHRR GAC data at a 0.05° spatial and daily temporal resolution. Our findings are based on a unique four-decade satellite-based time series of snow cover information. We reveal strong variability of SSC at all time scales. We find significantly decreasing SSC trends in individual summer and winter months and a declining tendency from mid-spring to mid-fall, indicating a shift in seasonality. Thanks to this uniquely spatio-temporally resolved long-term data basis, we can particularly highlight the unique temporally variable character of seasonal snow cover and its cross-disciplinary importance for mountain ecosystems and downstream regions.


Conflict of interest statement

The authors declare no competing interests.

Figures

Figure 1
Figure 1
The Hindu Kush Himalaya region and its spatial seasonality of snow cover occurrence. (a) The map shows the entire HKH extent and the subdivision into 14 major river basins. Please not some individual basins are cut by the HKH outline applied. (b) Snow Cover Area Percentage time series, including monthly standard deviation (grey shaded area), for the HKH and the entire study period 1982–2018. (c) Monthly median of SCA % averaged over the entire study period for the whole HKH region (black) and all individual basins (coloured lines) over the course of the year. SCA values are given in numbers relative to the size of the respective region. Boxplots show median and IQR, whiskers the quartile to extreme ranges, and outliers are shown as crosses for the time series of the whole HKH region. All numeric details of c can be found in the Supplementary Table S2.
Figure 2
Figure 2
Seasonal Snow Cover regime and its variability over time (a) Mean snow cover duration (left). (b) Mean early season snow cover duration, SCDes (left). (c) Mean late season snow cover duration, SCDls (left). Standard deviations of mean SCD, SCDes and SCDls are given in the right column. All displays present averaged data between 1982 and 2018. Early season is defined as between 1 September and 15 January of a given hydrological year, while late season is defined as between 16 January and 31 August. Permanent ice is displayed in pink, masked water bodies in orange. Geolocation and scale according to Fig. 1.
Figure 3
Figure 3
Seasonal changes in snow cover extent. Monthly SCA anomalies for the entire HKH region with respect to the 1982–2010 reference period. Teal and brown dots denote positive and negative yearly anomalies, respectively. Solid black lines denote 3-year running mean, dashed lines denote the MK trendline and statistics (Senn slope and Kendall p) are given at the top of each box (bold indicates significant values). Missing data from November 1994 to February 1995 are visible. All numeric details can be found in the Supplementary Table S3.
Figure 4
Figure 4
Interannual and spatial variability in snow cover extent. Annual SCA % anomalies for the entire HKH region (a), or one of the 14 basins; arranged in greater regions west (b), central (c) and east (d), with respect to the 1982–2010 reference period. Note different y-axis range for the top HKH region figure. Dashed lines denote the MK trendline and statistics (Senn slope and Kendall p) are given at the bottom of each graph. All numeric details can be found in the Supplementary Table S4.
Figure 5
Figure 5
Long-term seasonal snow cover variability in the HKH. Heat map of daily SCA anomalies over the study period 1982–2018 with respect to the 1982–2010 reference period. Missing data from November 1994 to February 1995, and some individual days, are marked in grey.

References

    1. The Hindu Kush Himalaya Assessment . The Hindu Kush Himalaya Assessment: Mountains, Climate Change, Sustainability and People. Springer; 2019.
    1. Rana N, et al. A preliminary assessment of the 7th February 2021 flashflood in lower Dhauli Ganga valley, Central Himalaya, India. J. Earth Syst. Sci. 2021;130:1608.
    1. Tahir AA, Adamowski JF, Chevallier P, Haq AU, Terzago S. Comparative assessment of spatiotemporal snow cover changes and hydrological behavior of the Gilgit, Astore and Hunza River basins (Hindukush–Karakoram–Himalaya region, Pakistan) Meteorol. Atmos. Phys. 2016;128:793–811. doi: 10.1007/s00703-016-0440-6. - DOI
    1. Zhou H, Aizen E, Aizen V. Deriving long term snow cover extent dataset from AVHRR and MODIS data: Central Asia case study. Remote Sens. Environ. 2013;136:146–162. doi: 10.1016/j.rse.2013.04.015. - DOI
    1. Bookhagen B, Burbank DW. Toward a complete Himalayan hydrological budget: Spatiotemporal distribution of snowmelt and rainfall and their impact on river discharge. J. Geophys. Res. Earth Surf. 2010;115:1–25. doi: 10.1029/2009JF001426. - DOI

Publication types