. 2022 Nov;54(11):1664-1674.
doi: 10.1038/s41588-022-01140-w. Epub 2022 Aug 4.

Molecular map of chronic lymphocytic leukemia and its impact on outcome

Affiliations

Molecular map of chronic lymphocytic leukemia and its impact on outcome

Binyamin A Knisbacher et al. Nat Genet. 2022 Nov.

Abstract

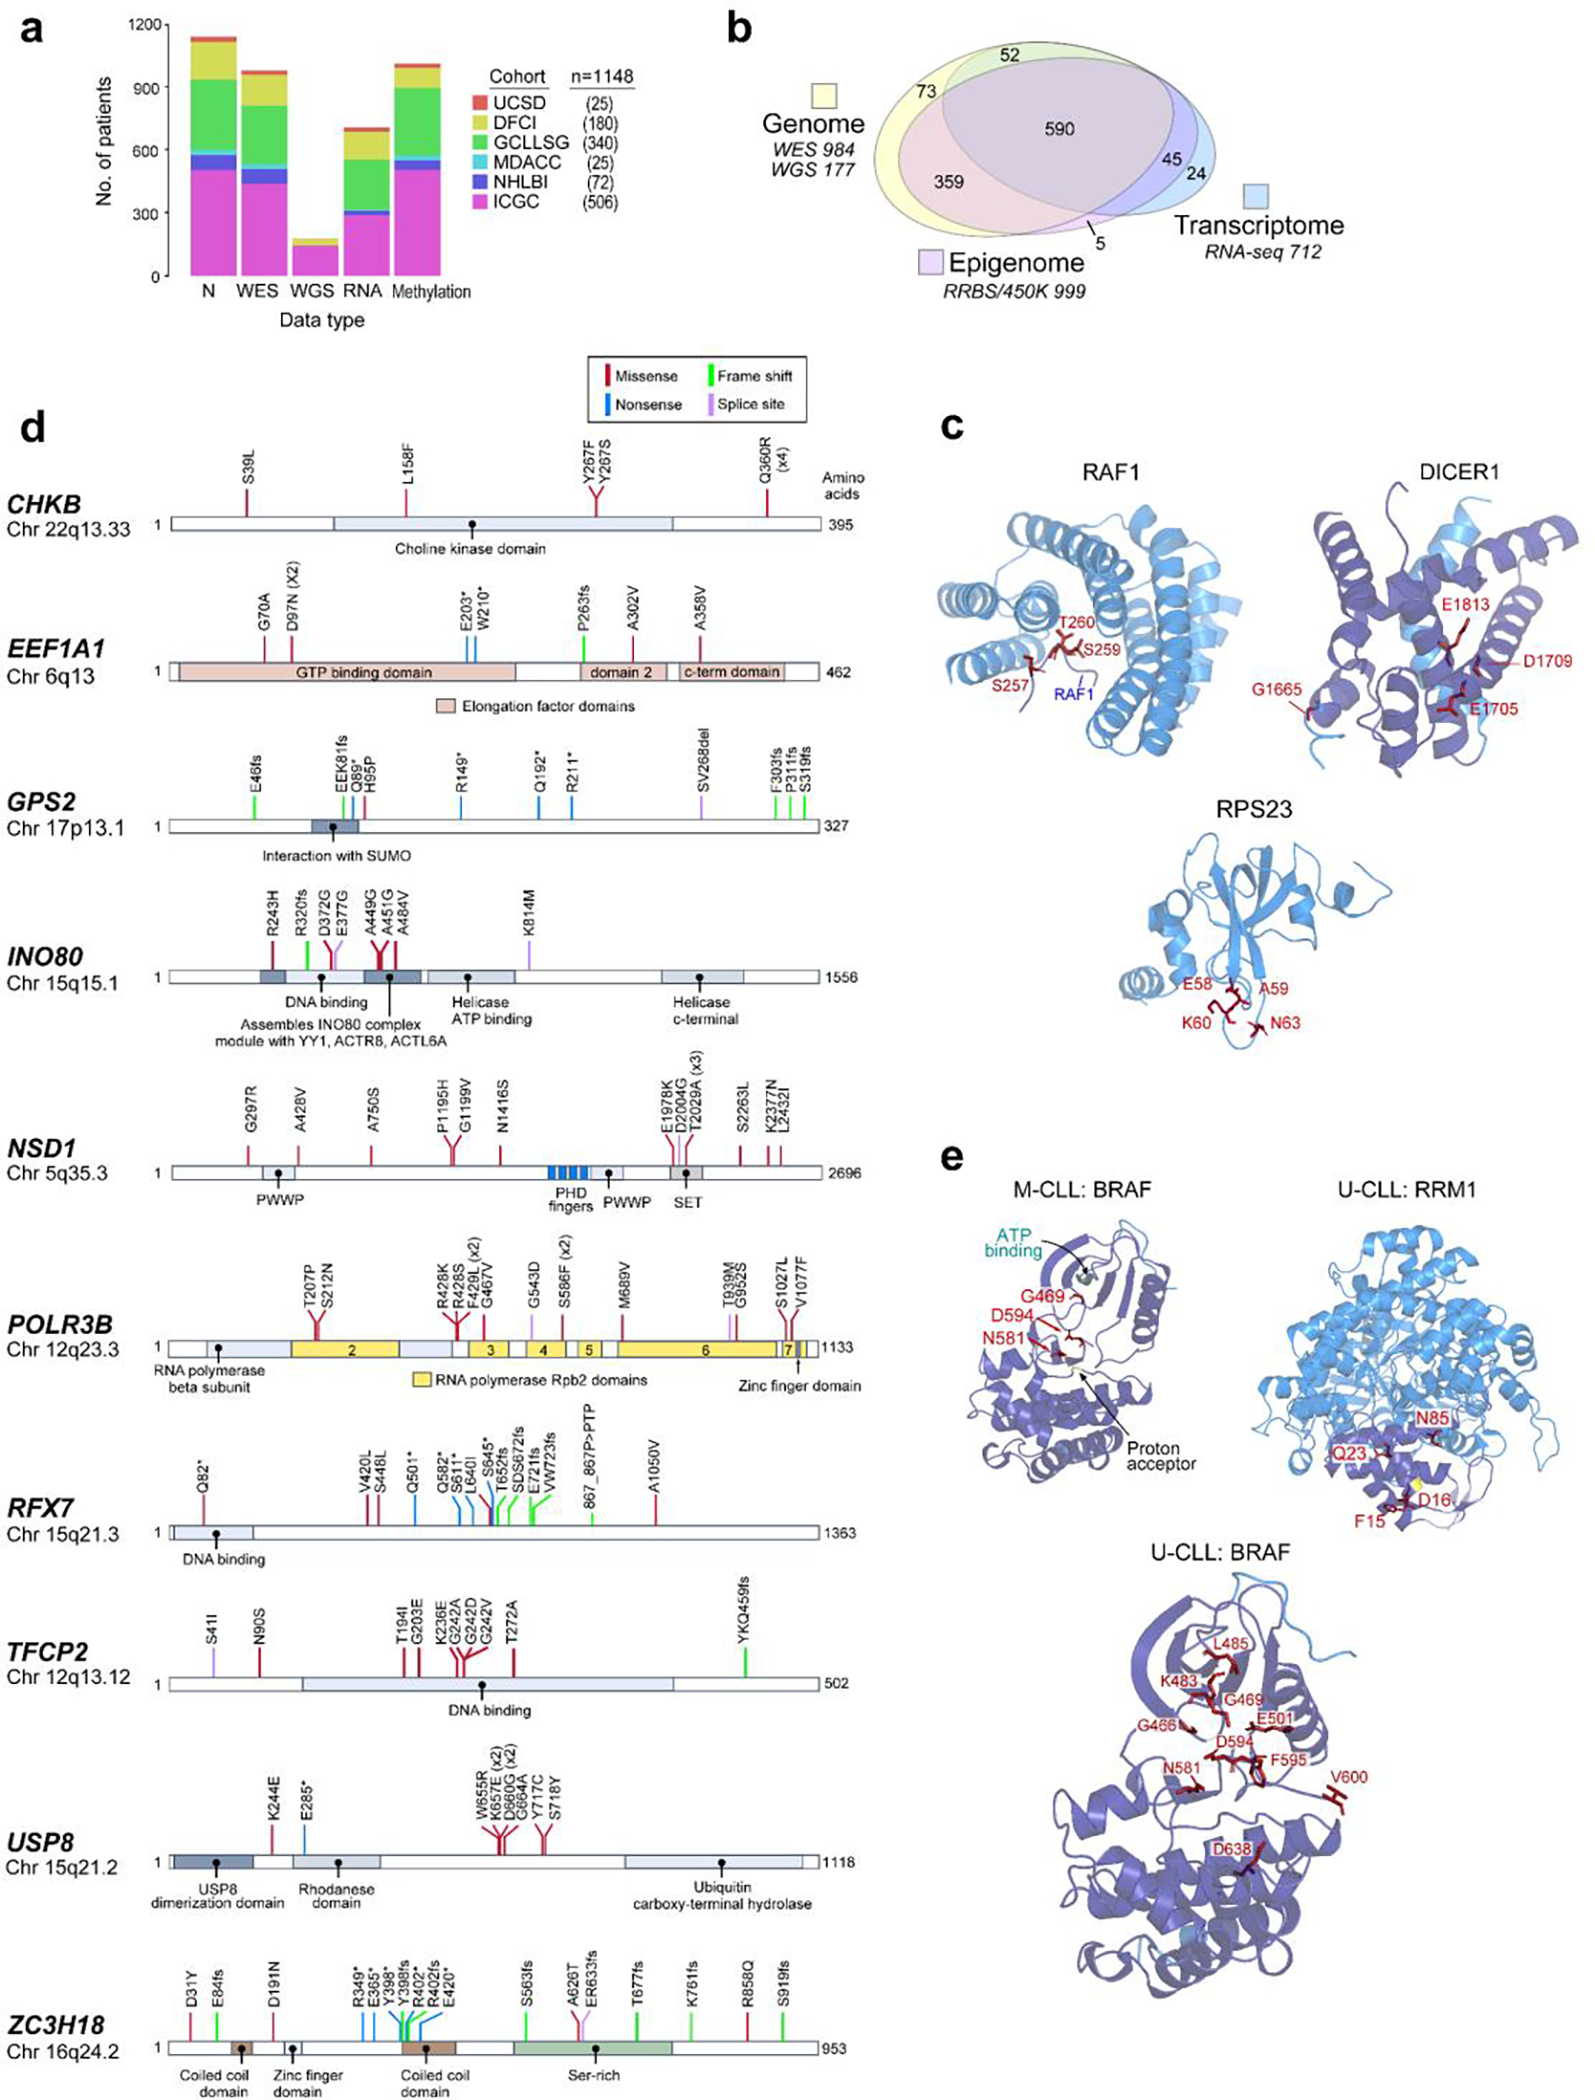
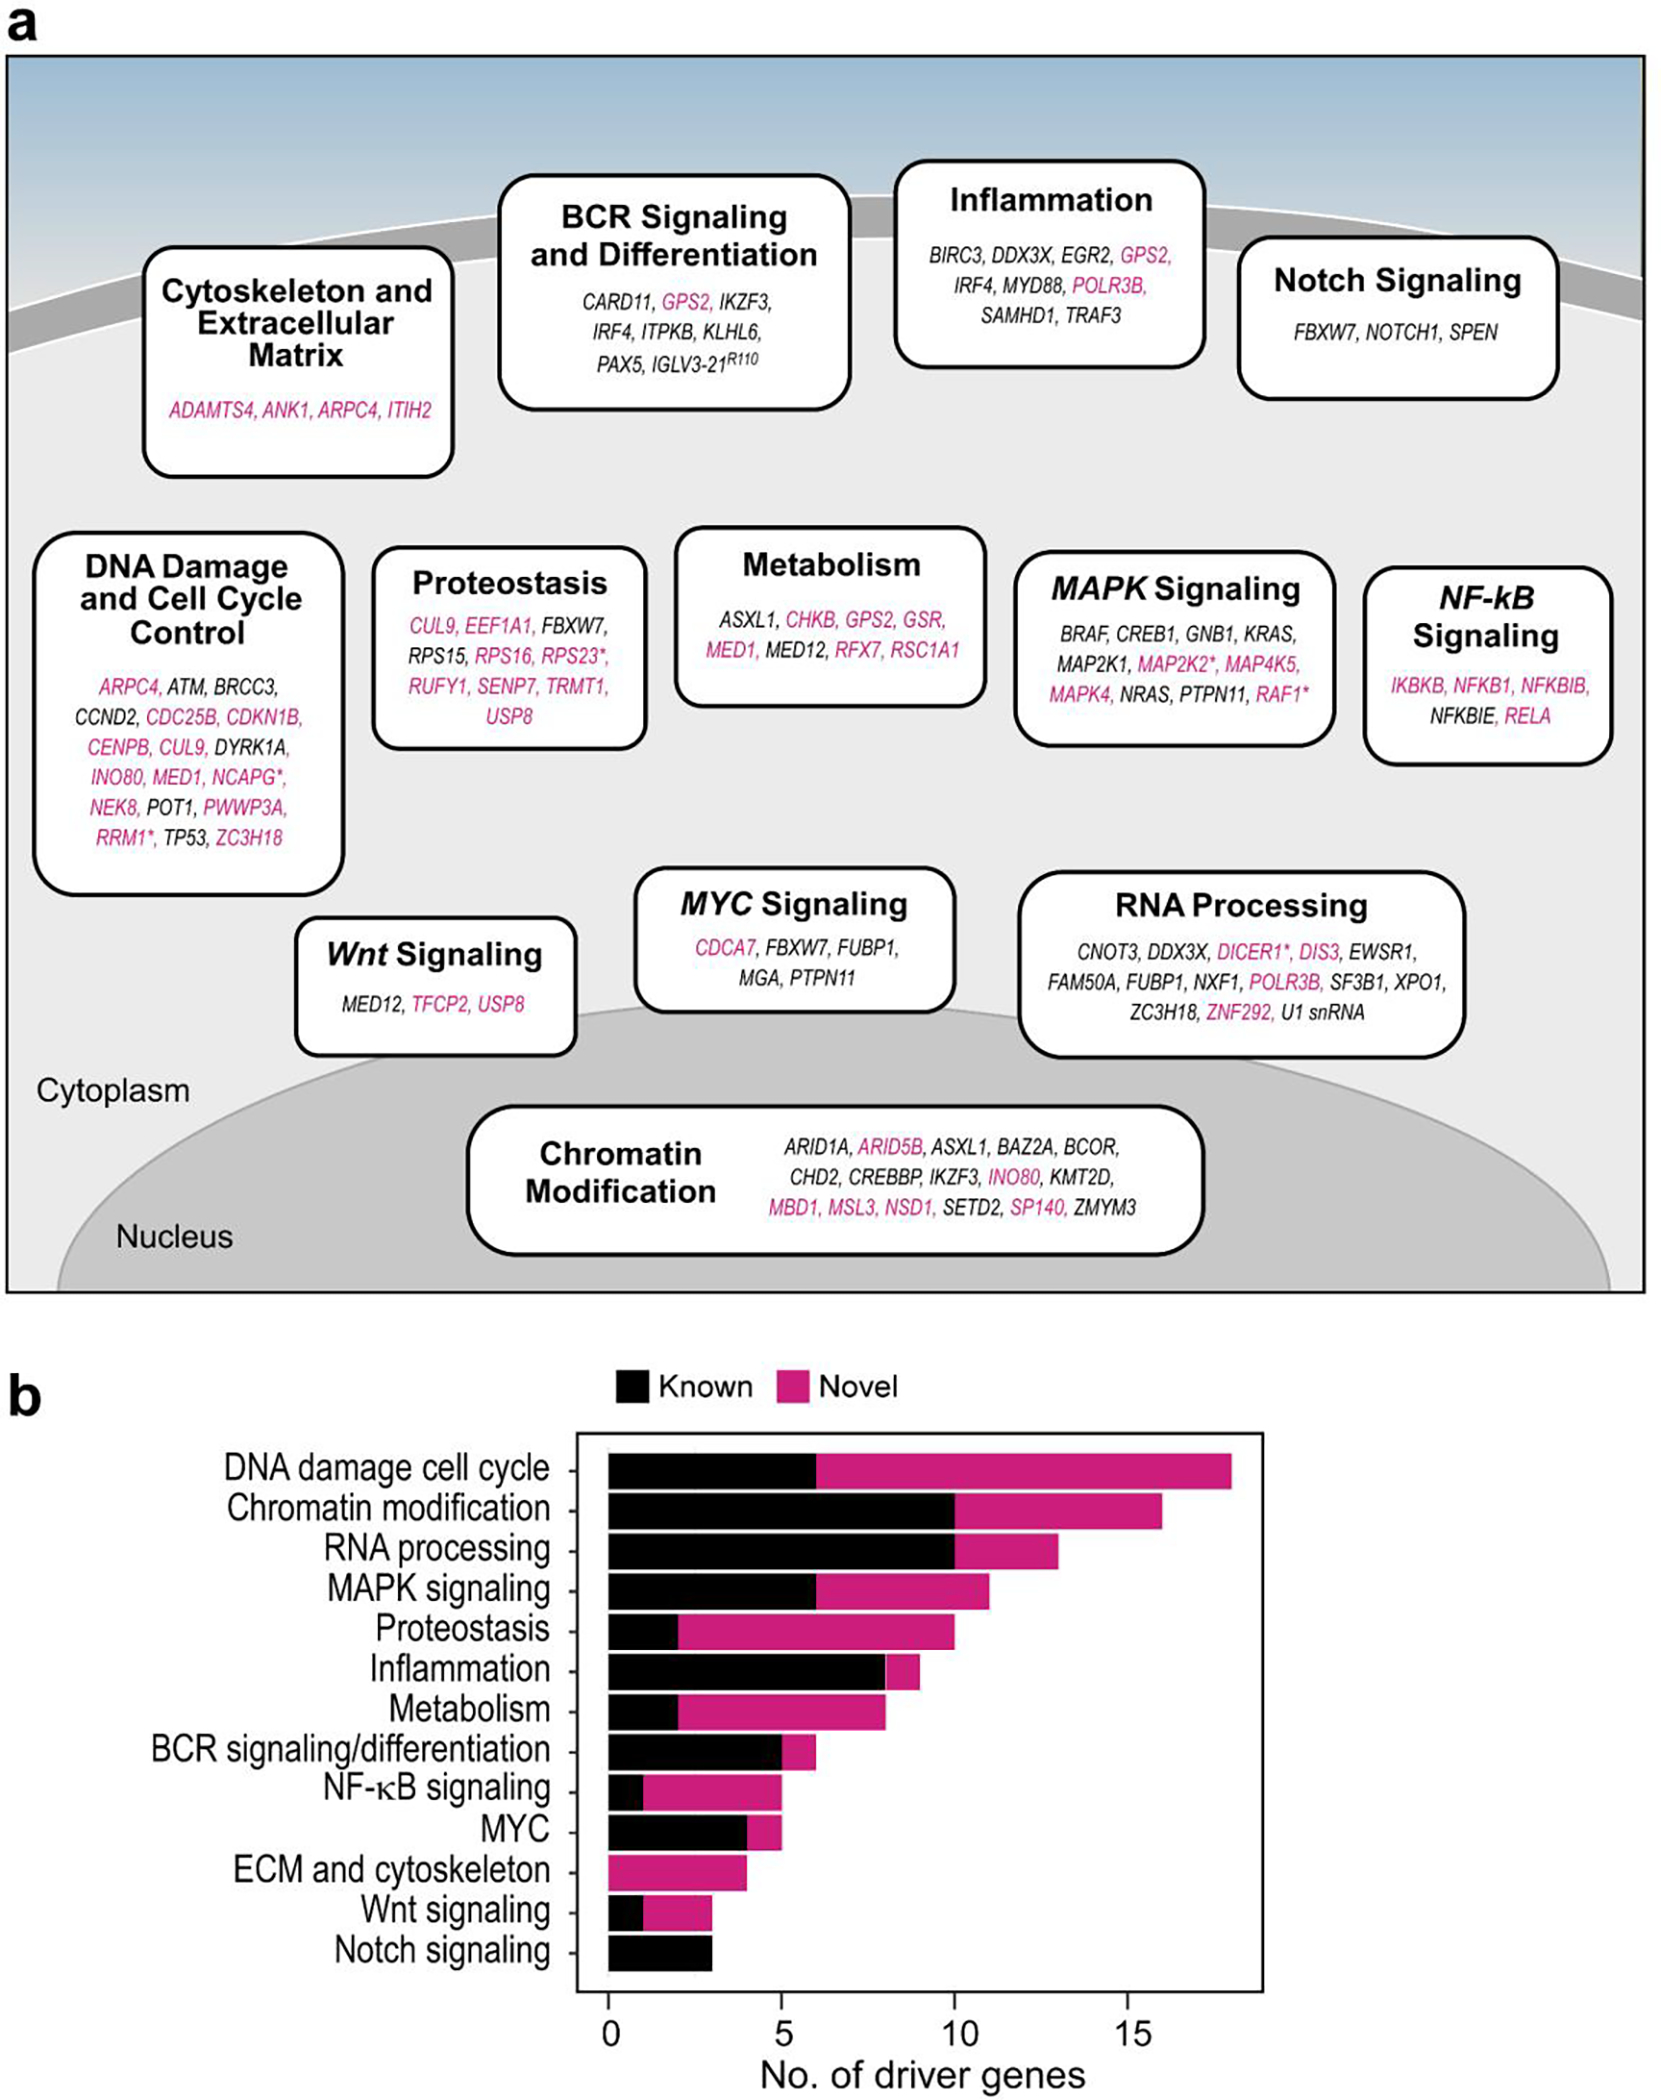
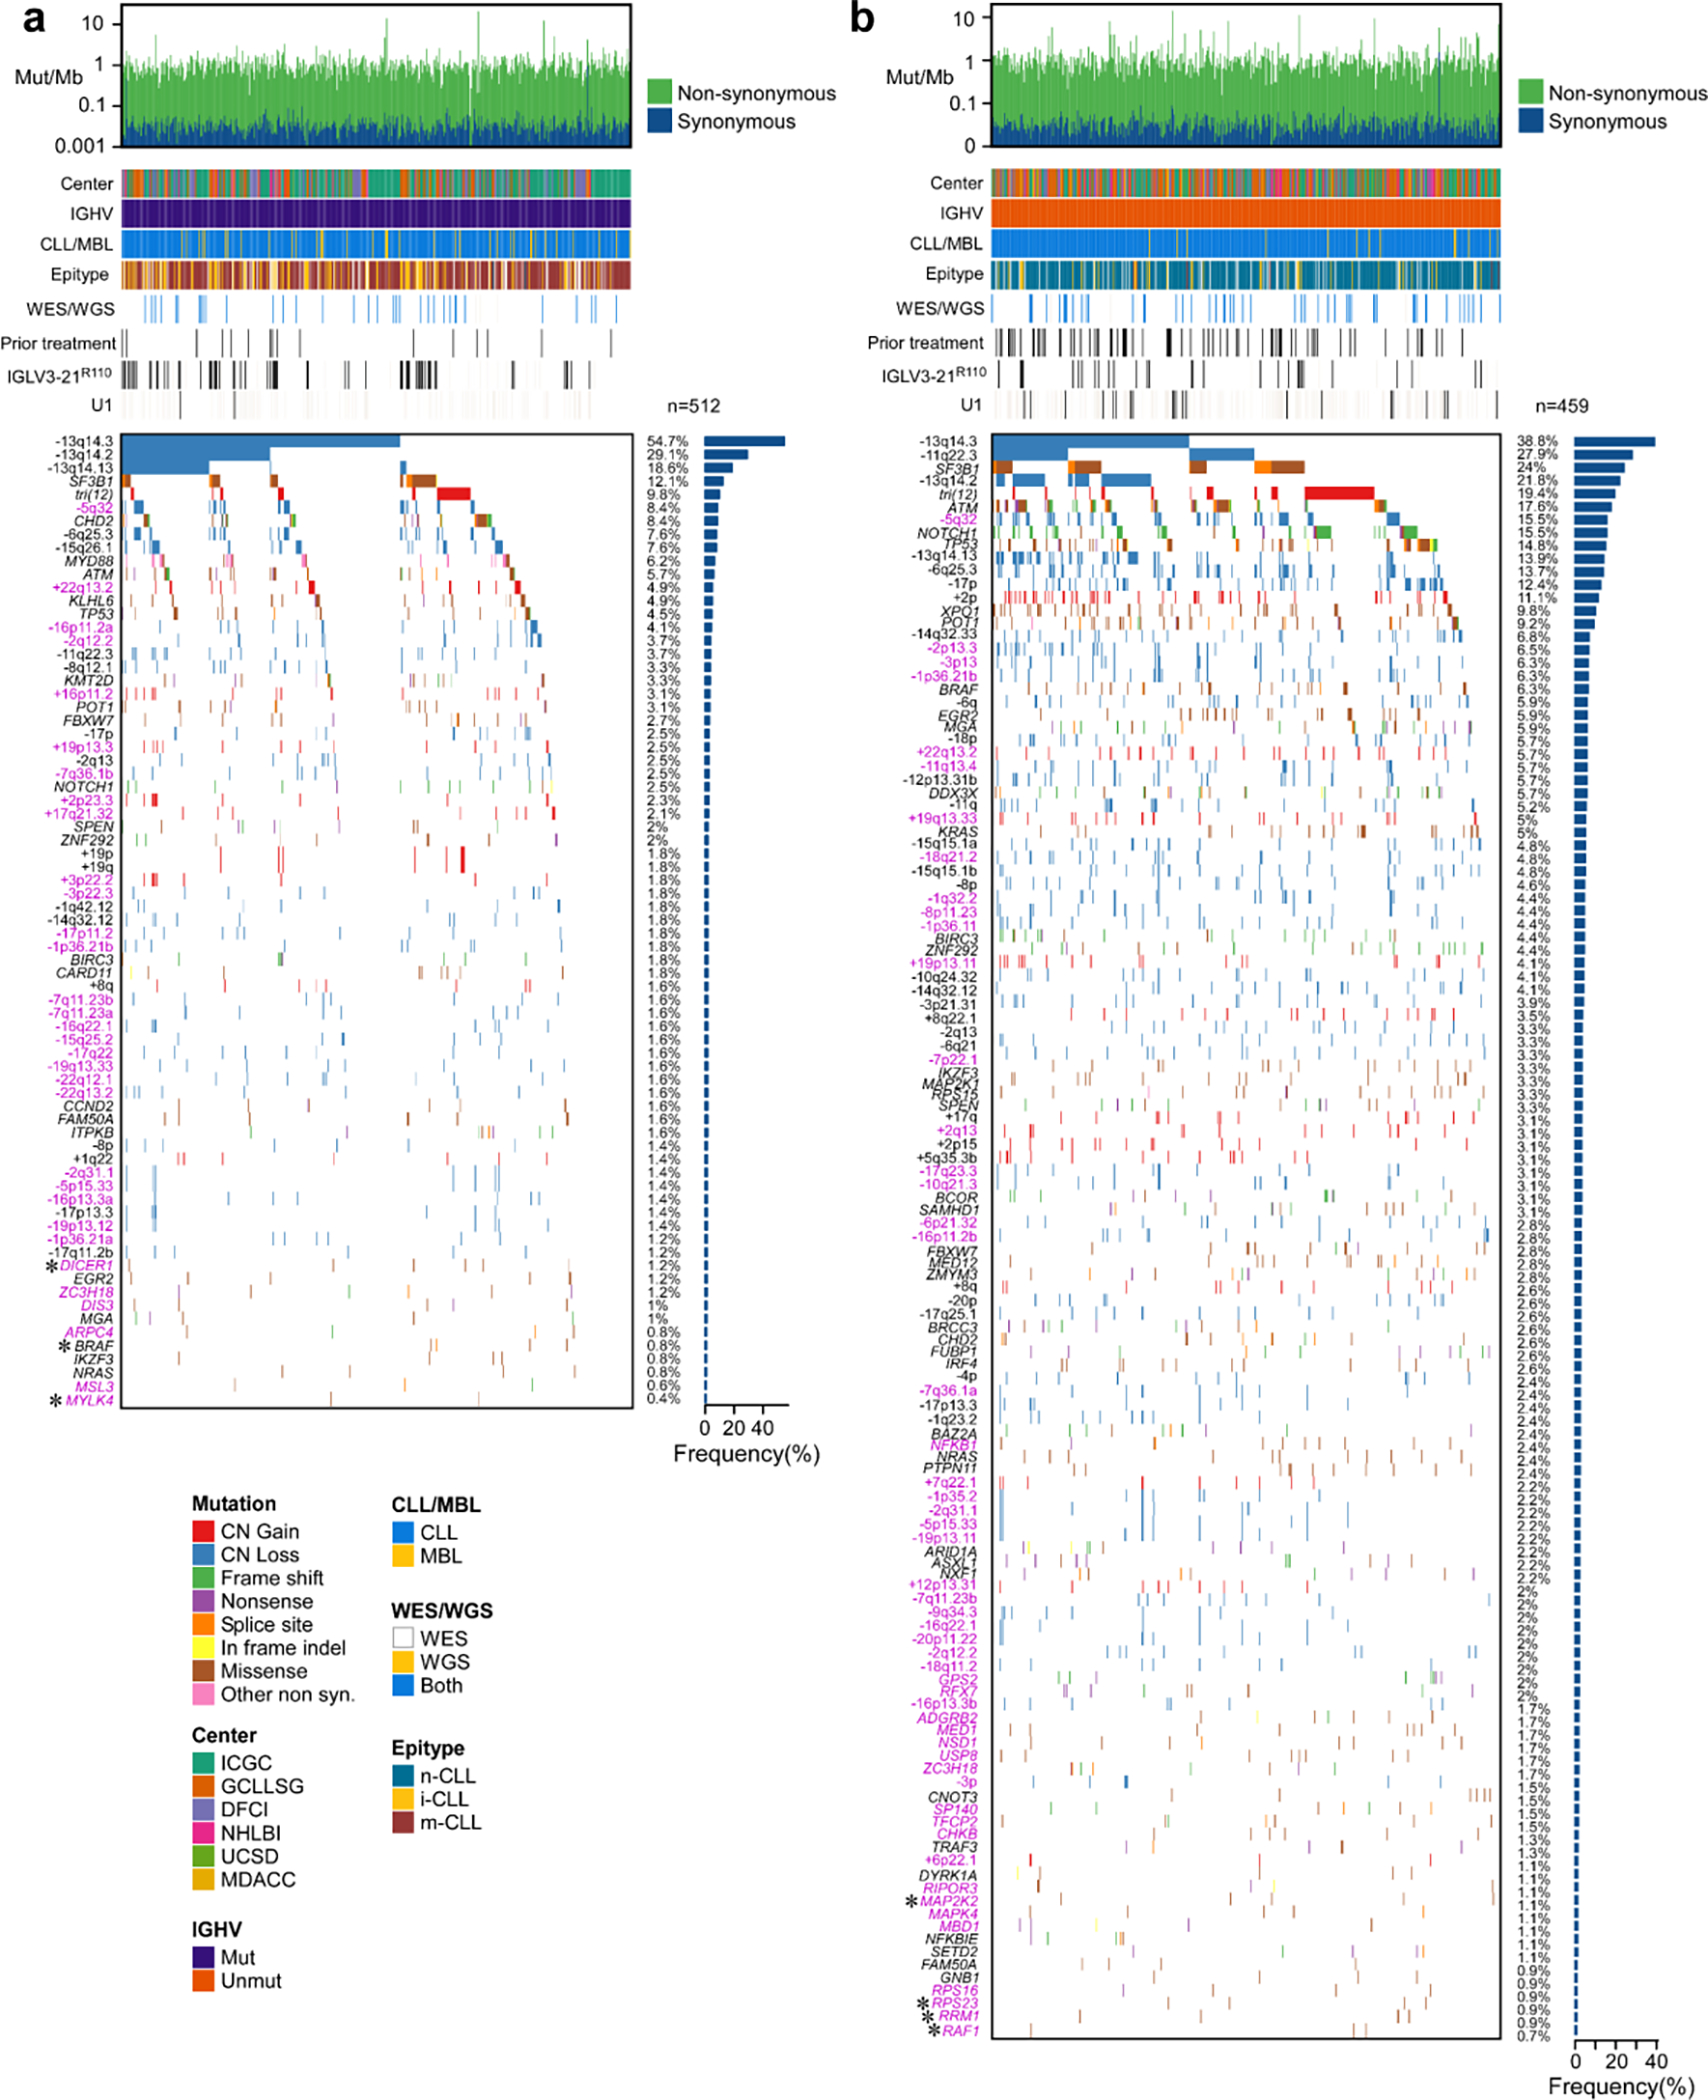
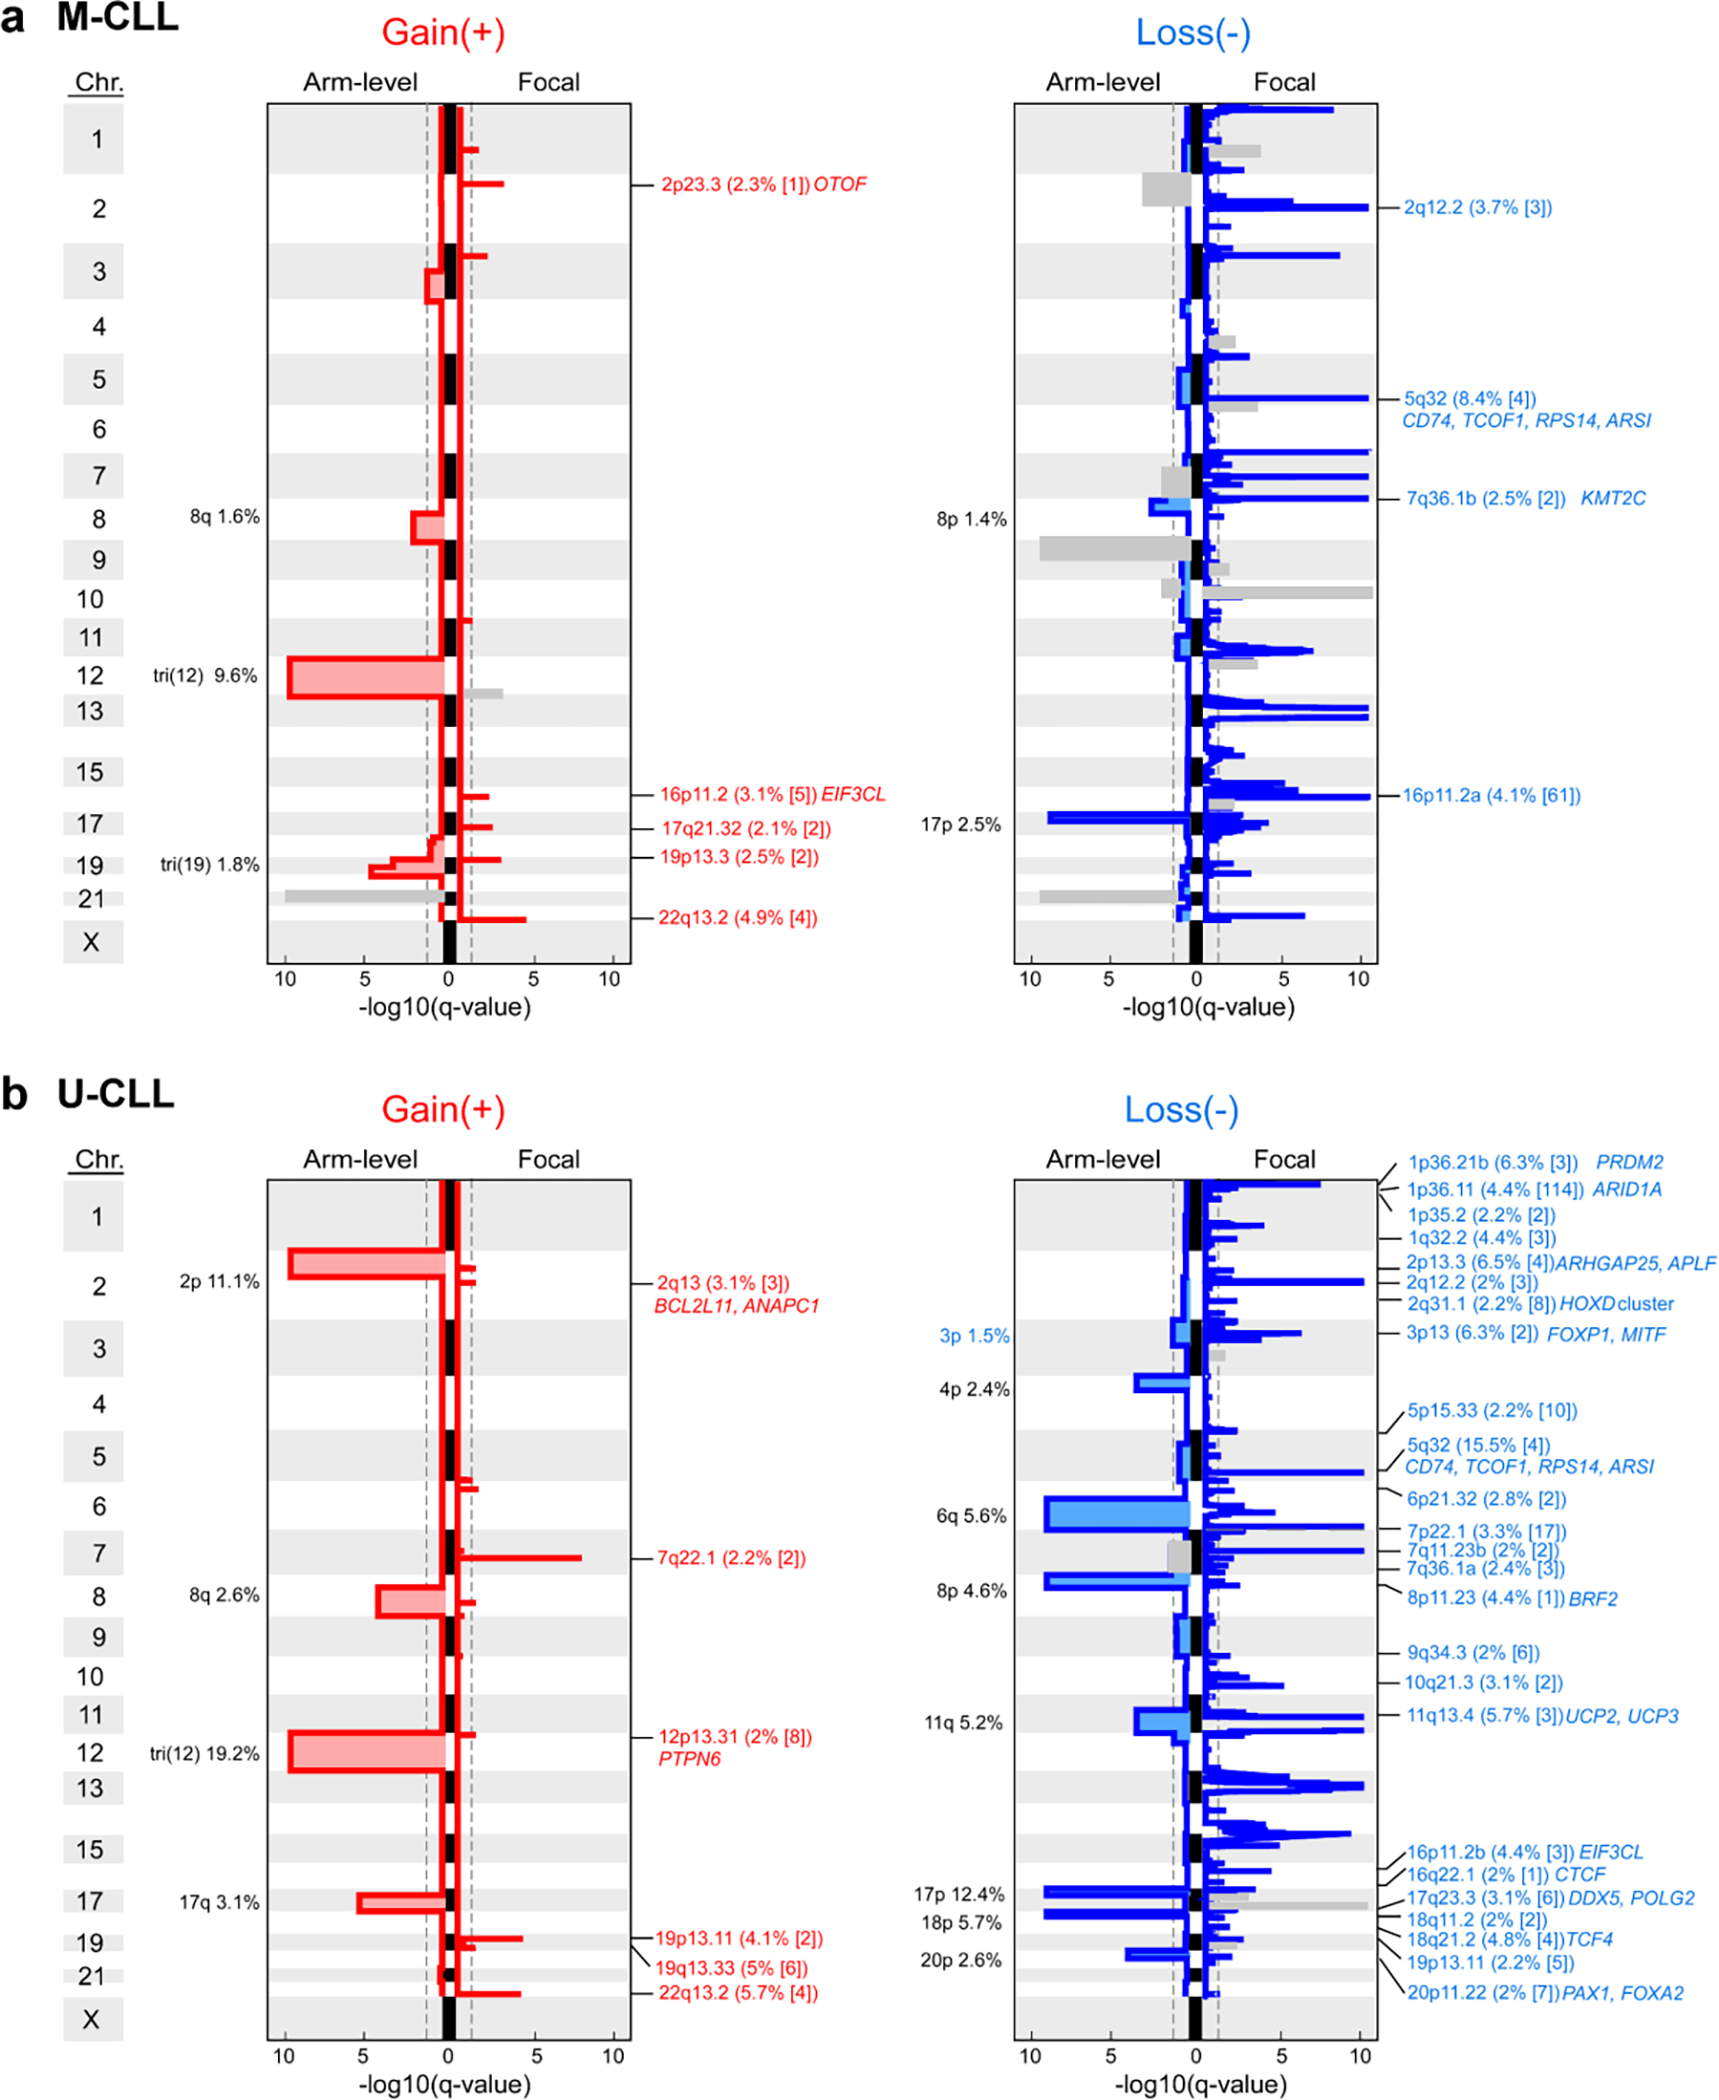
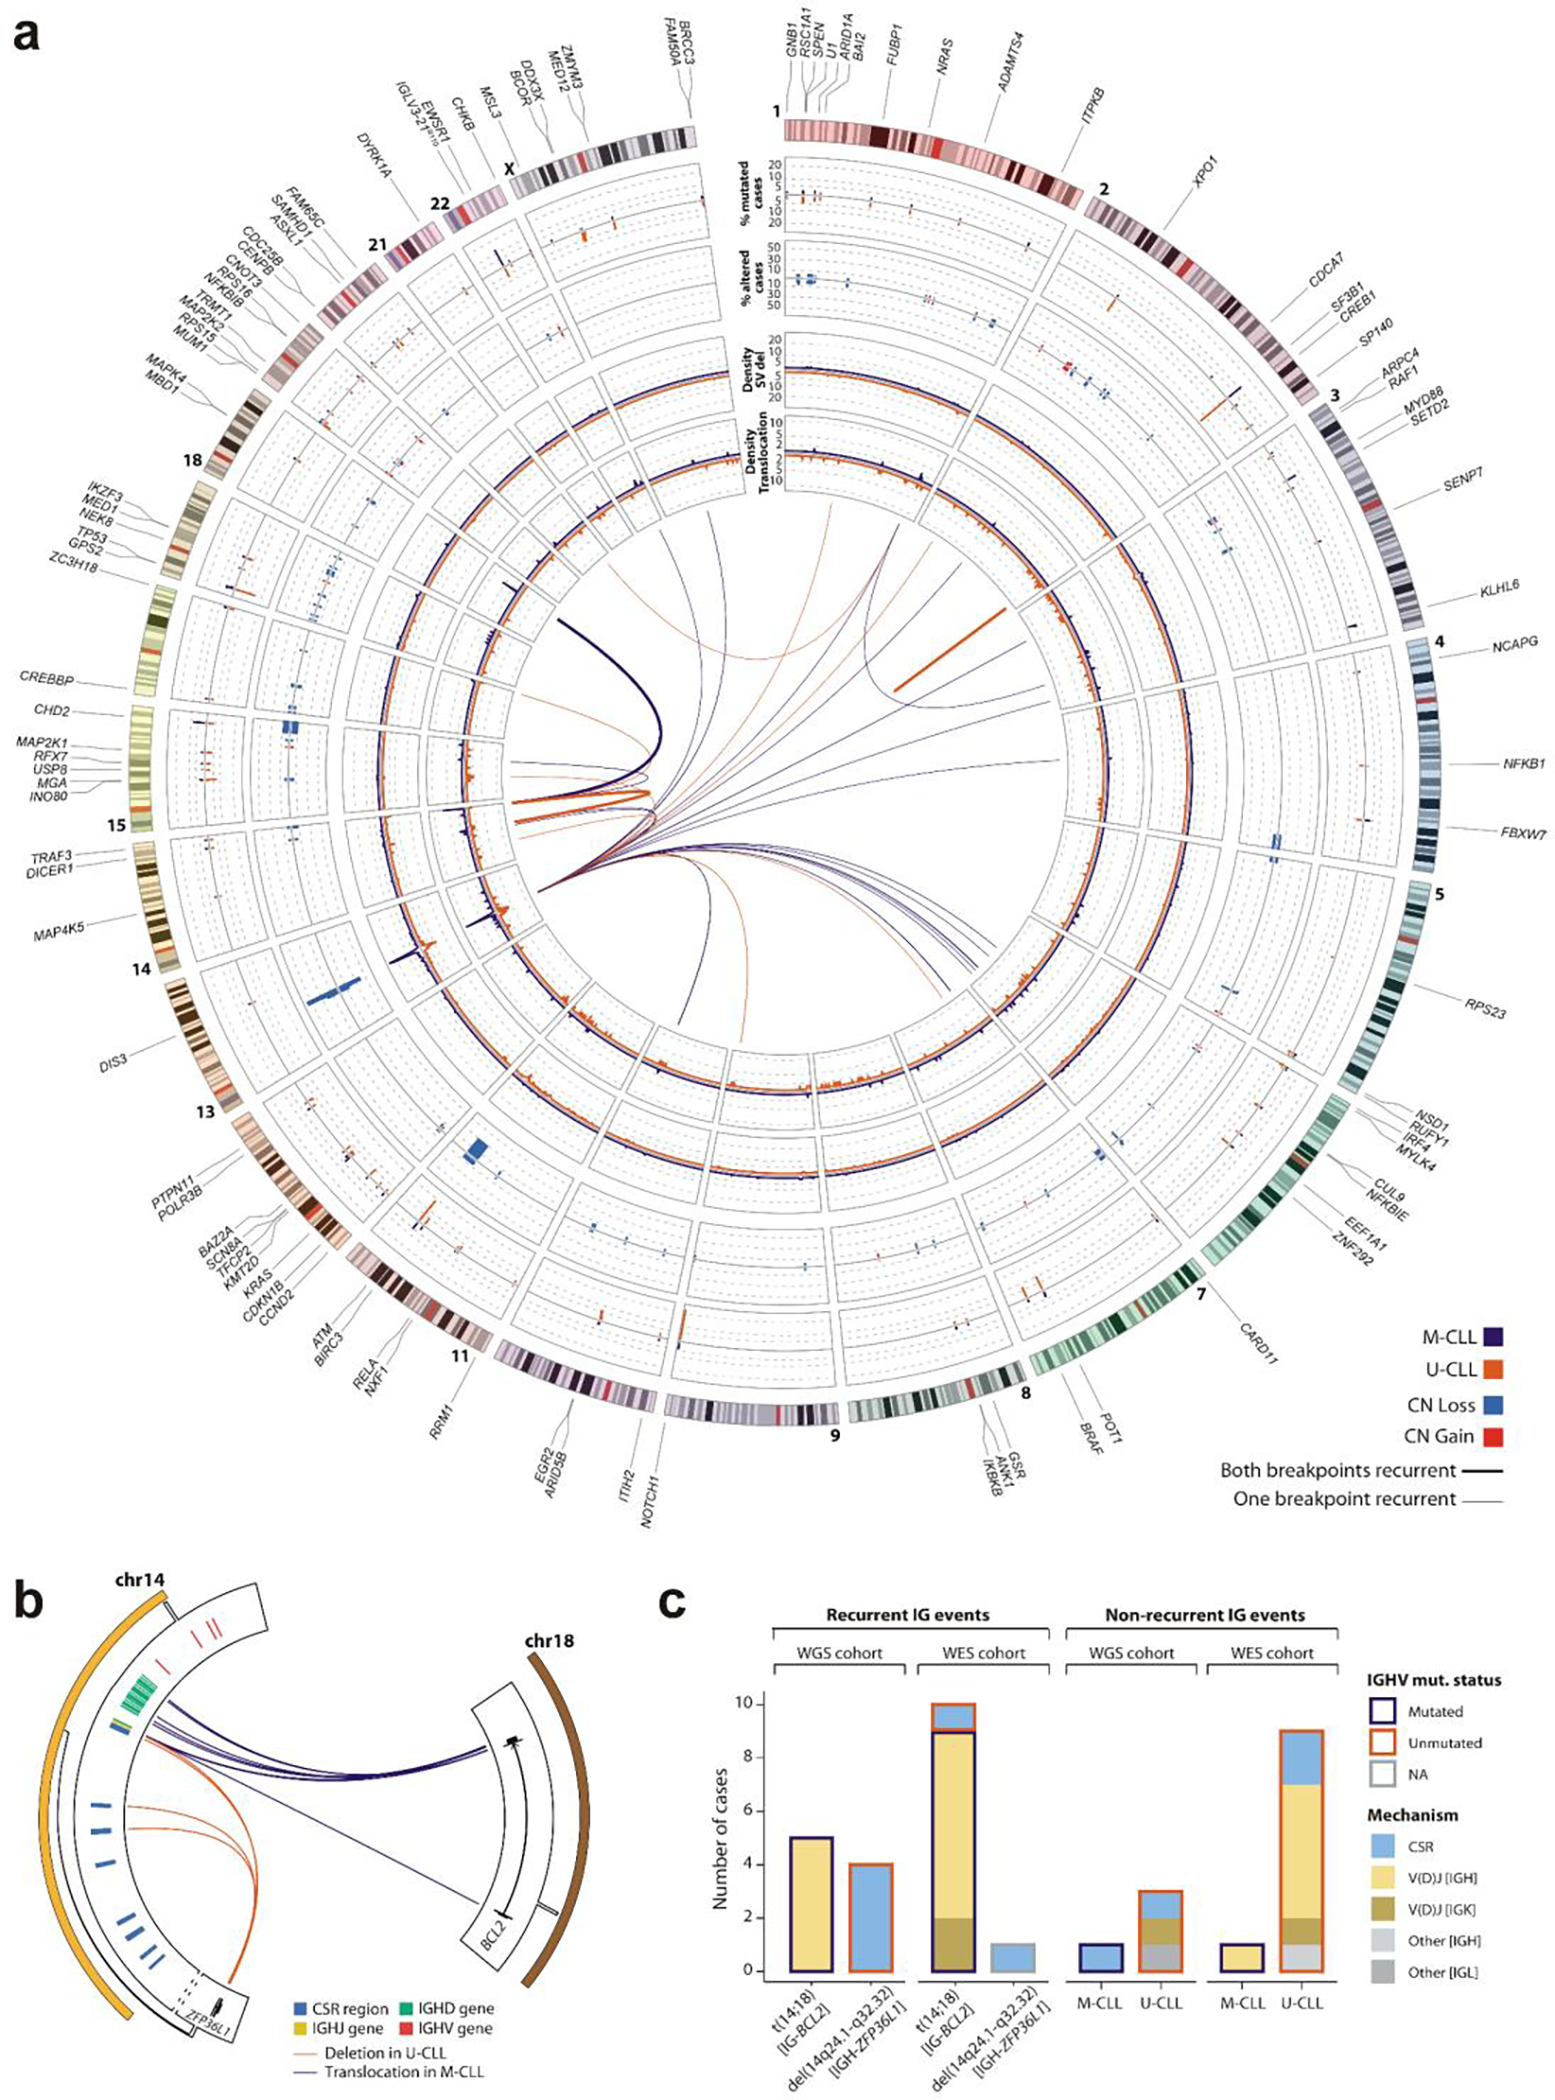
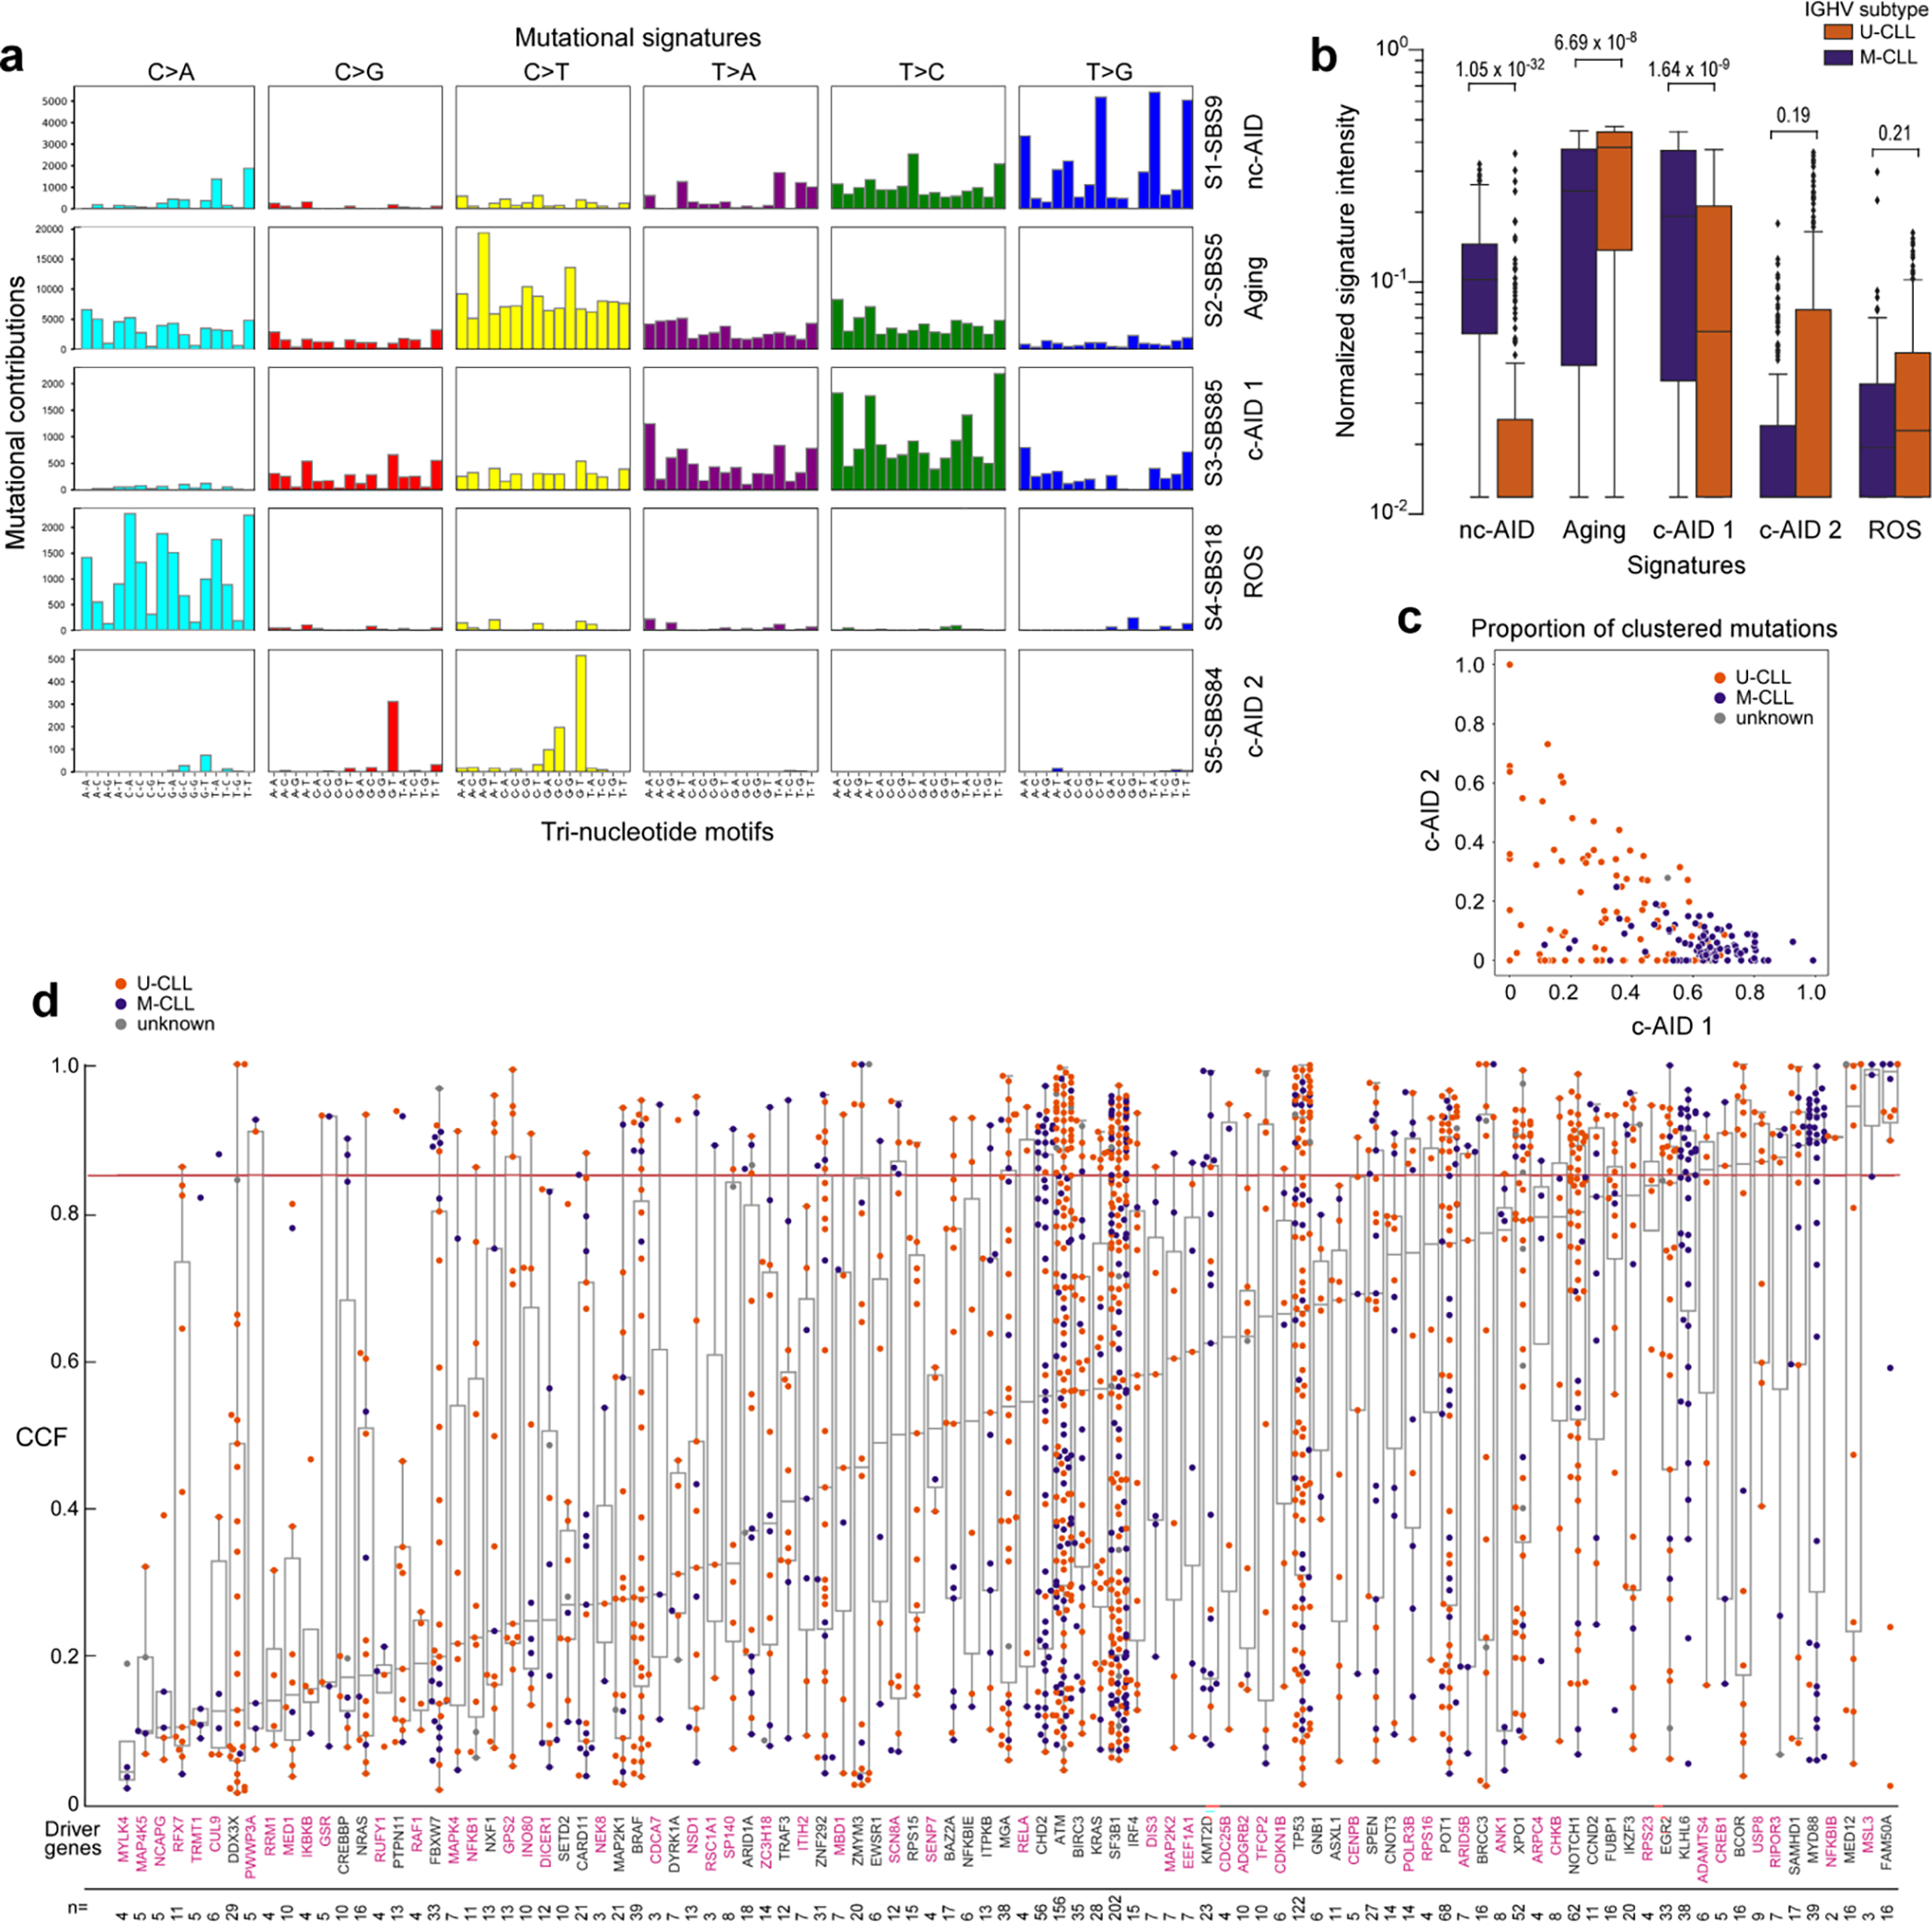
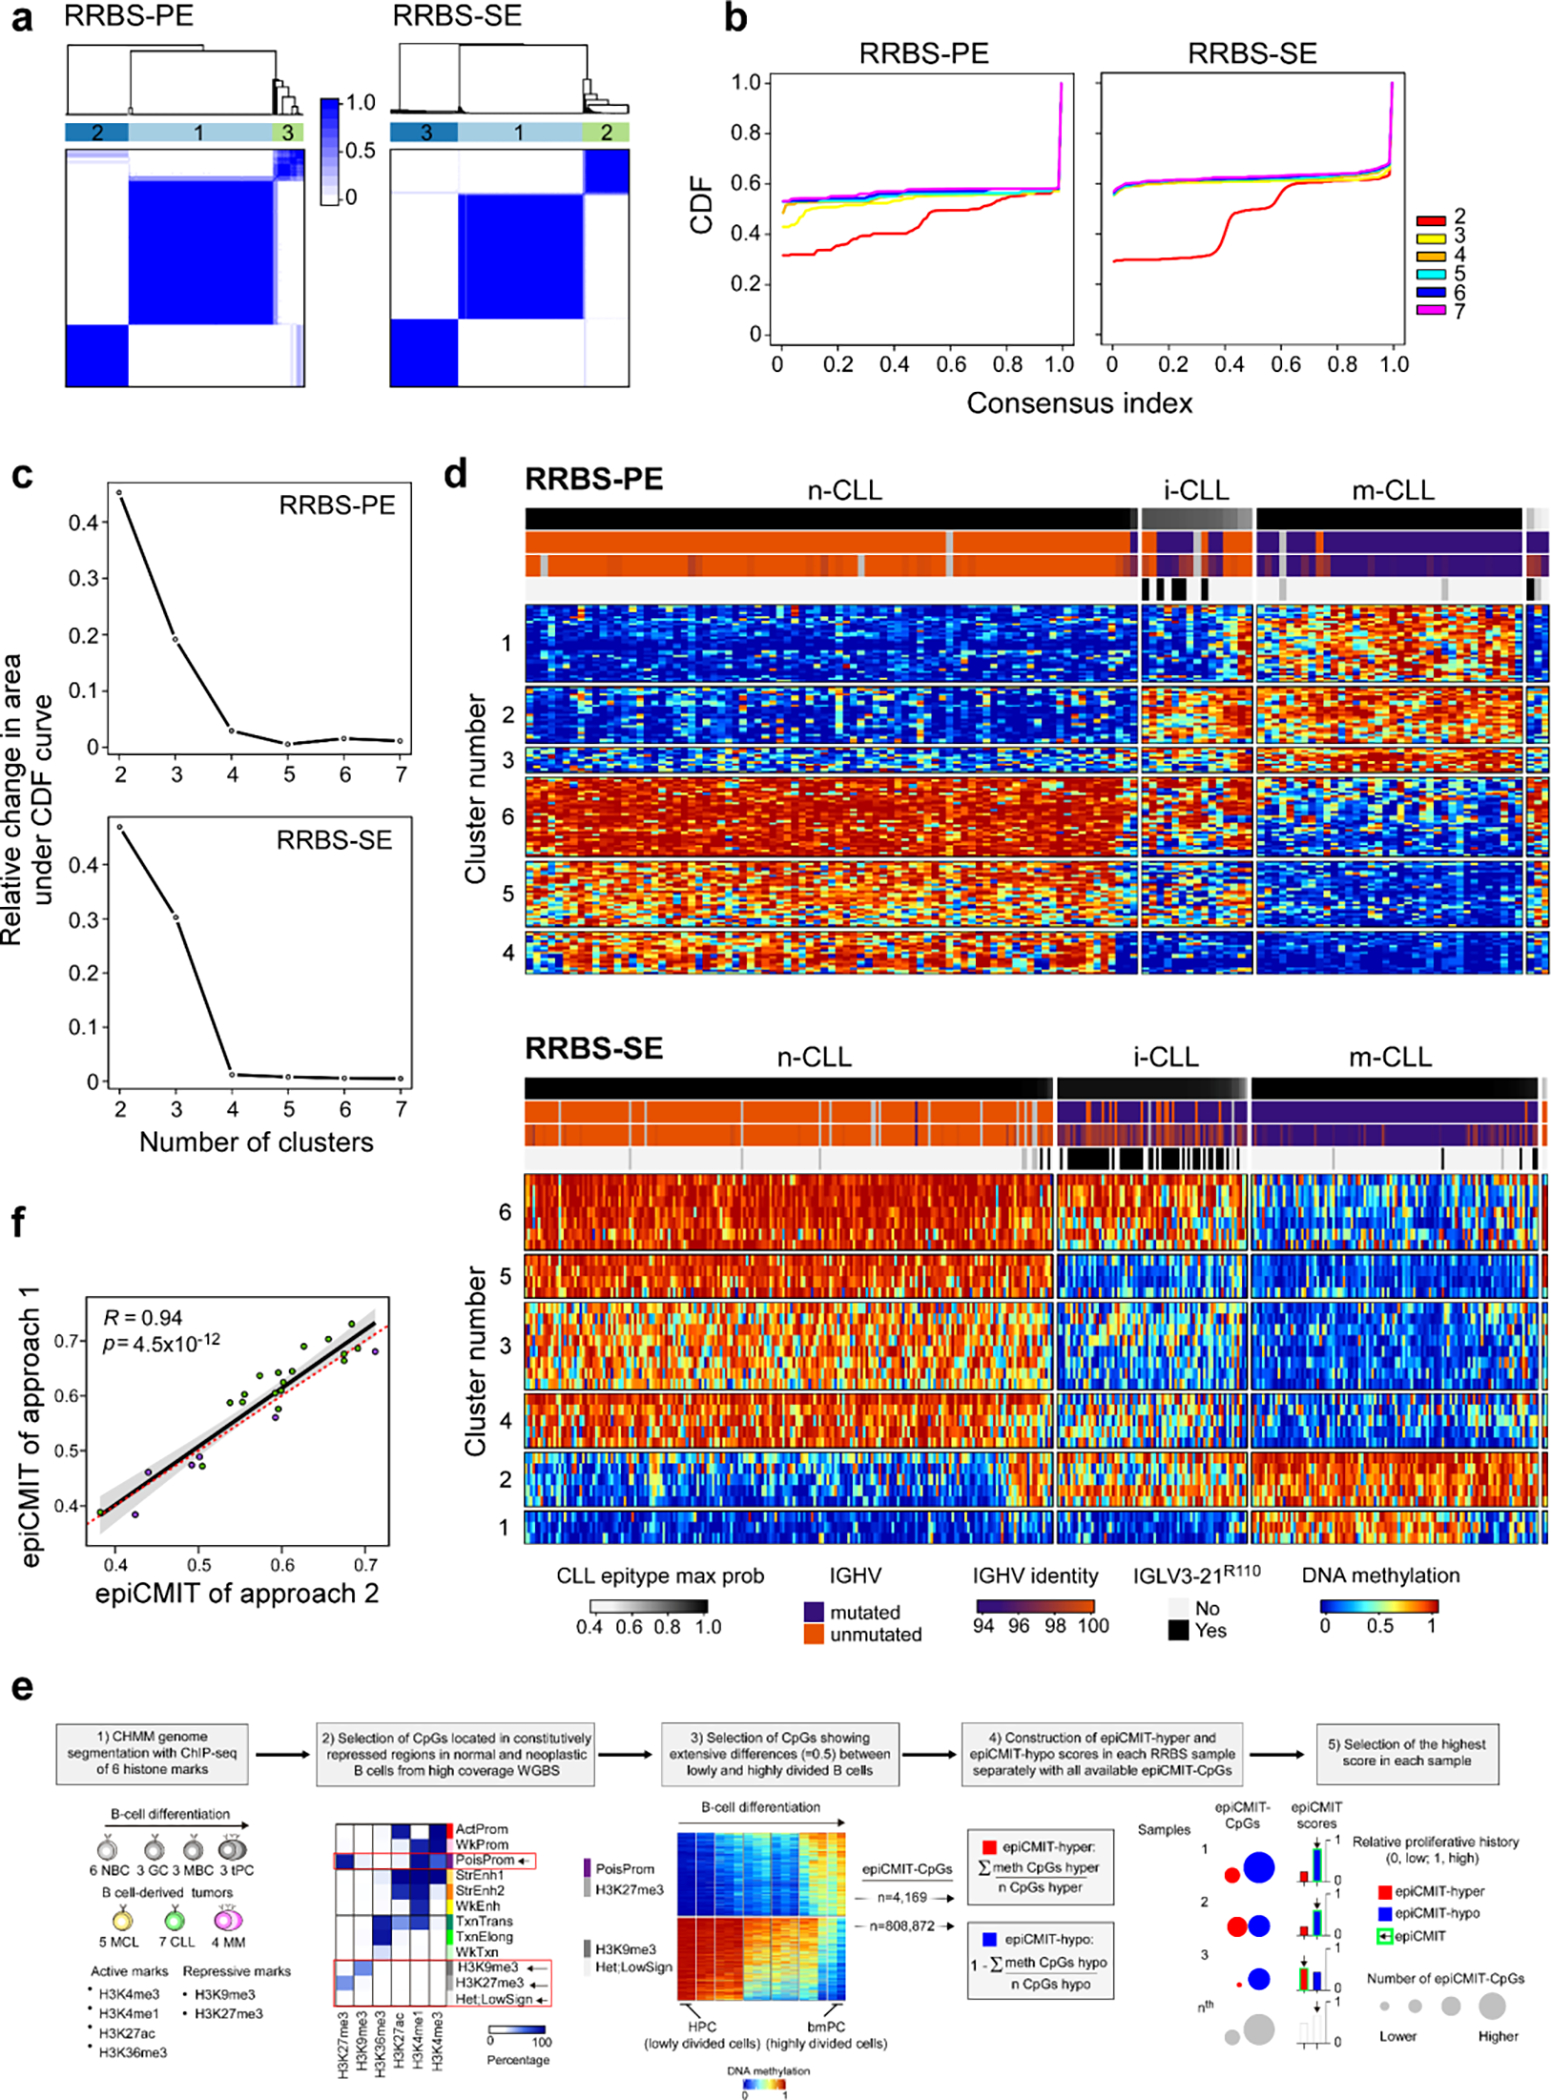
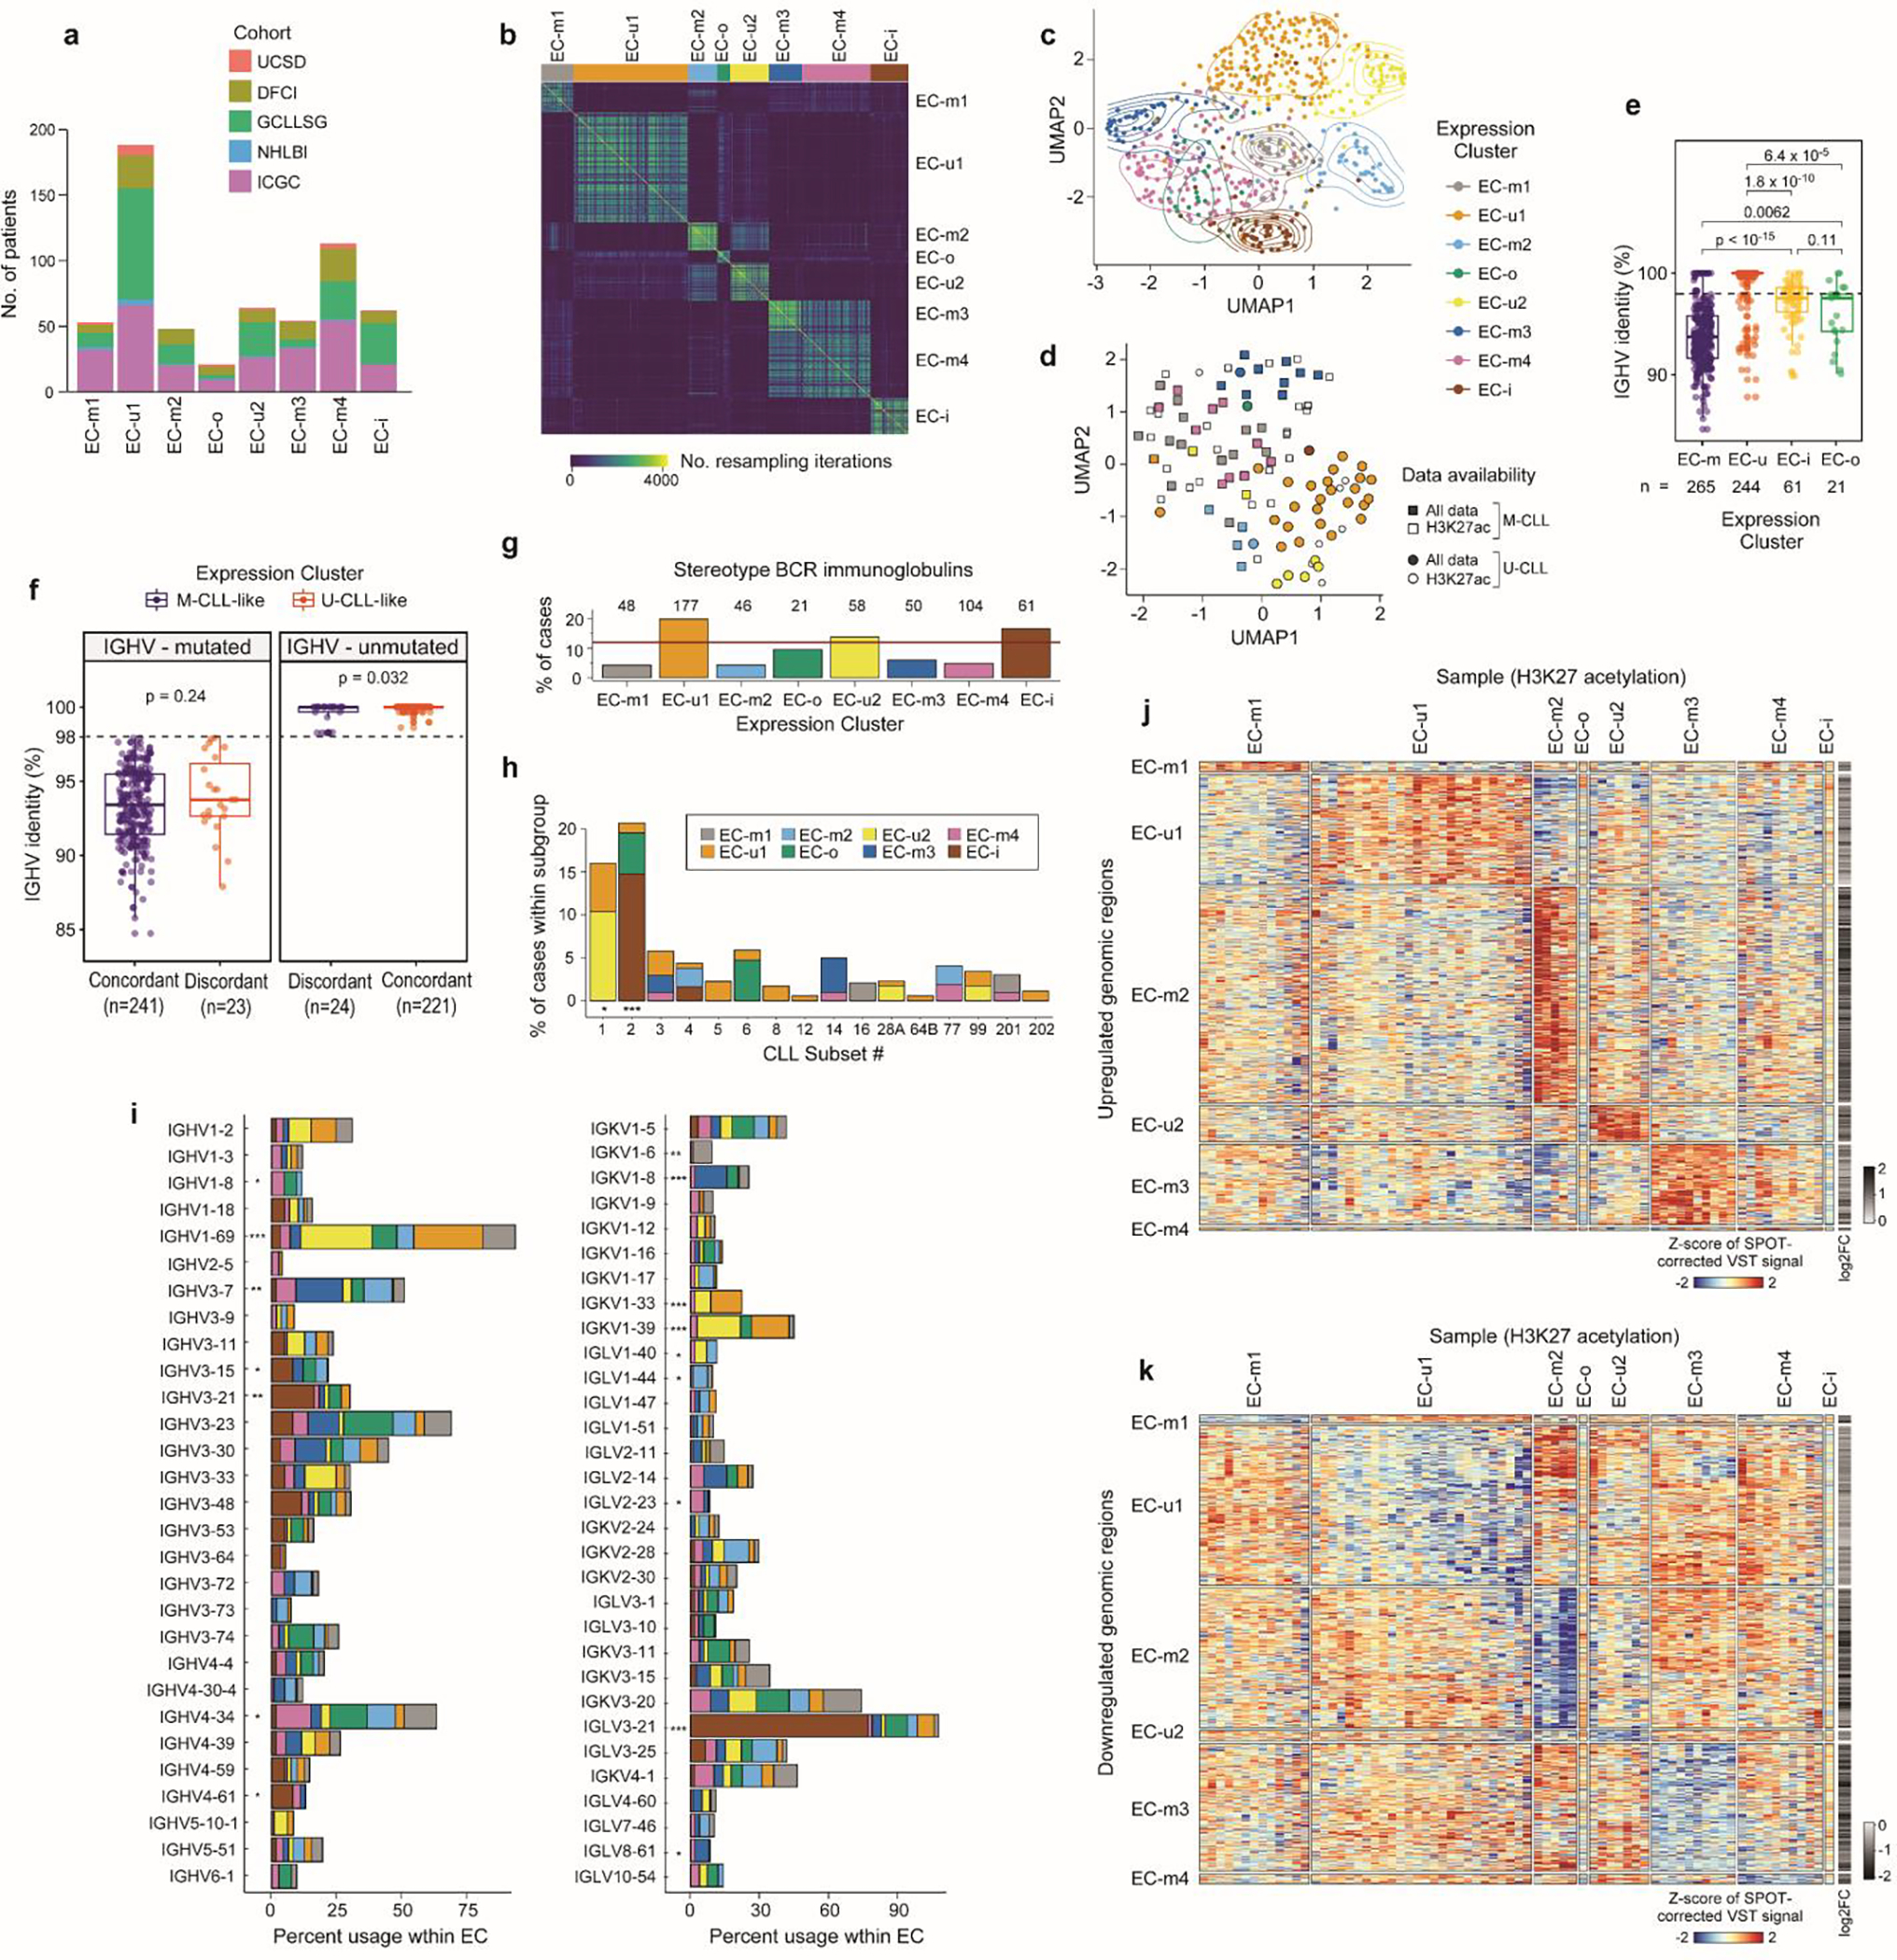
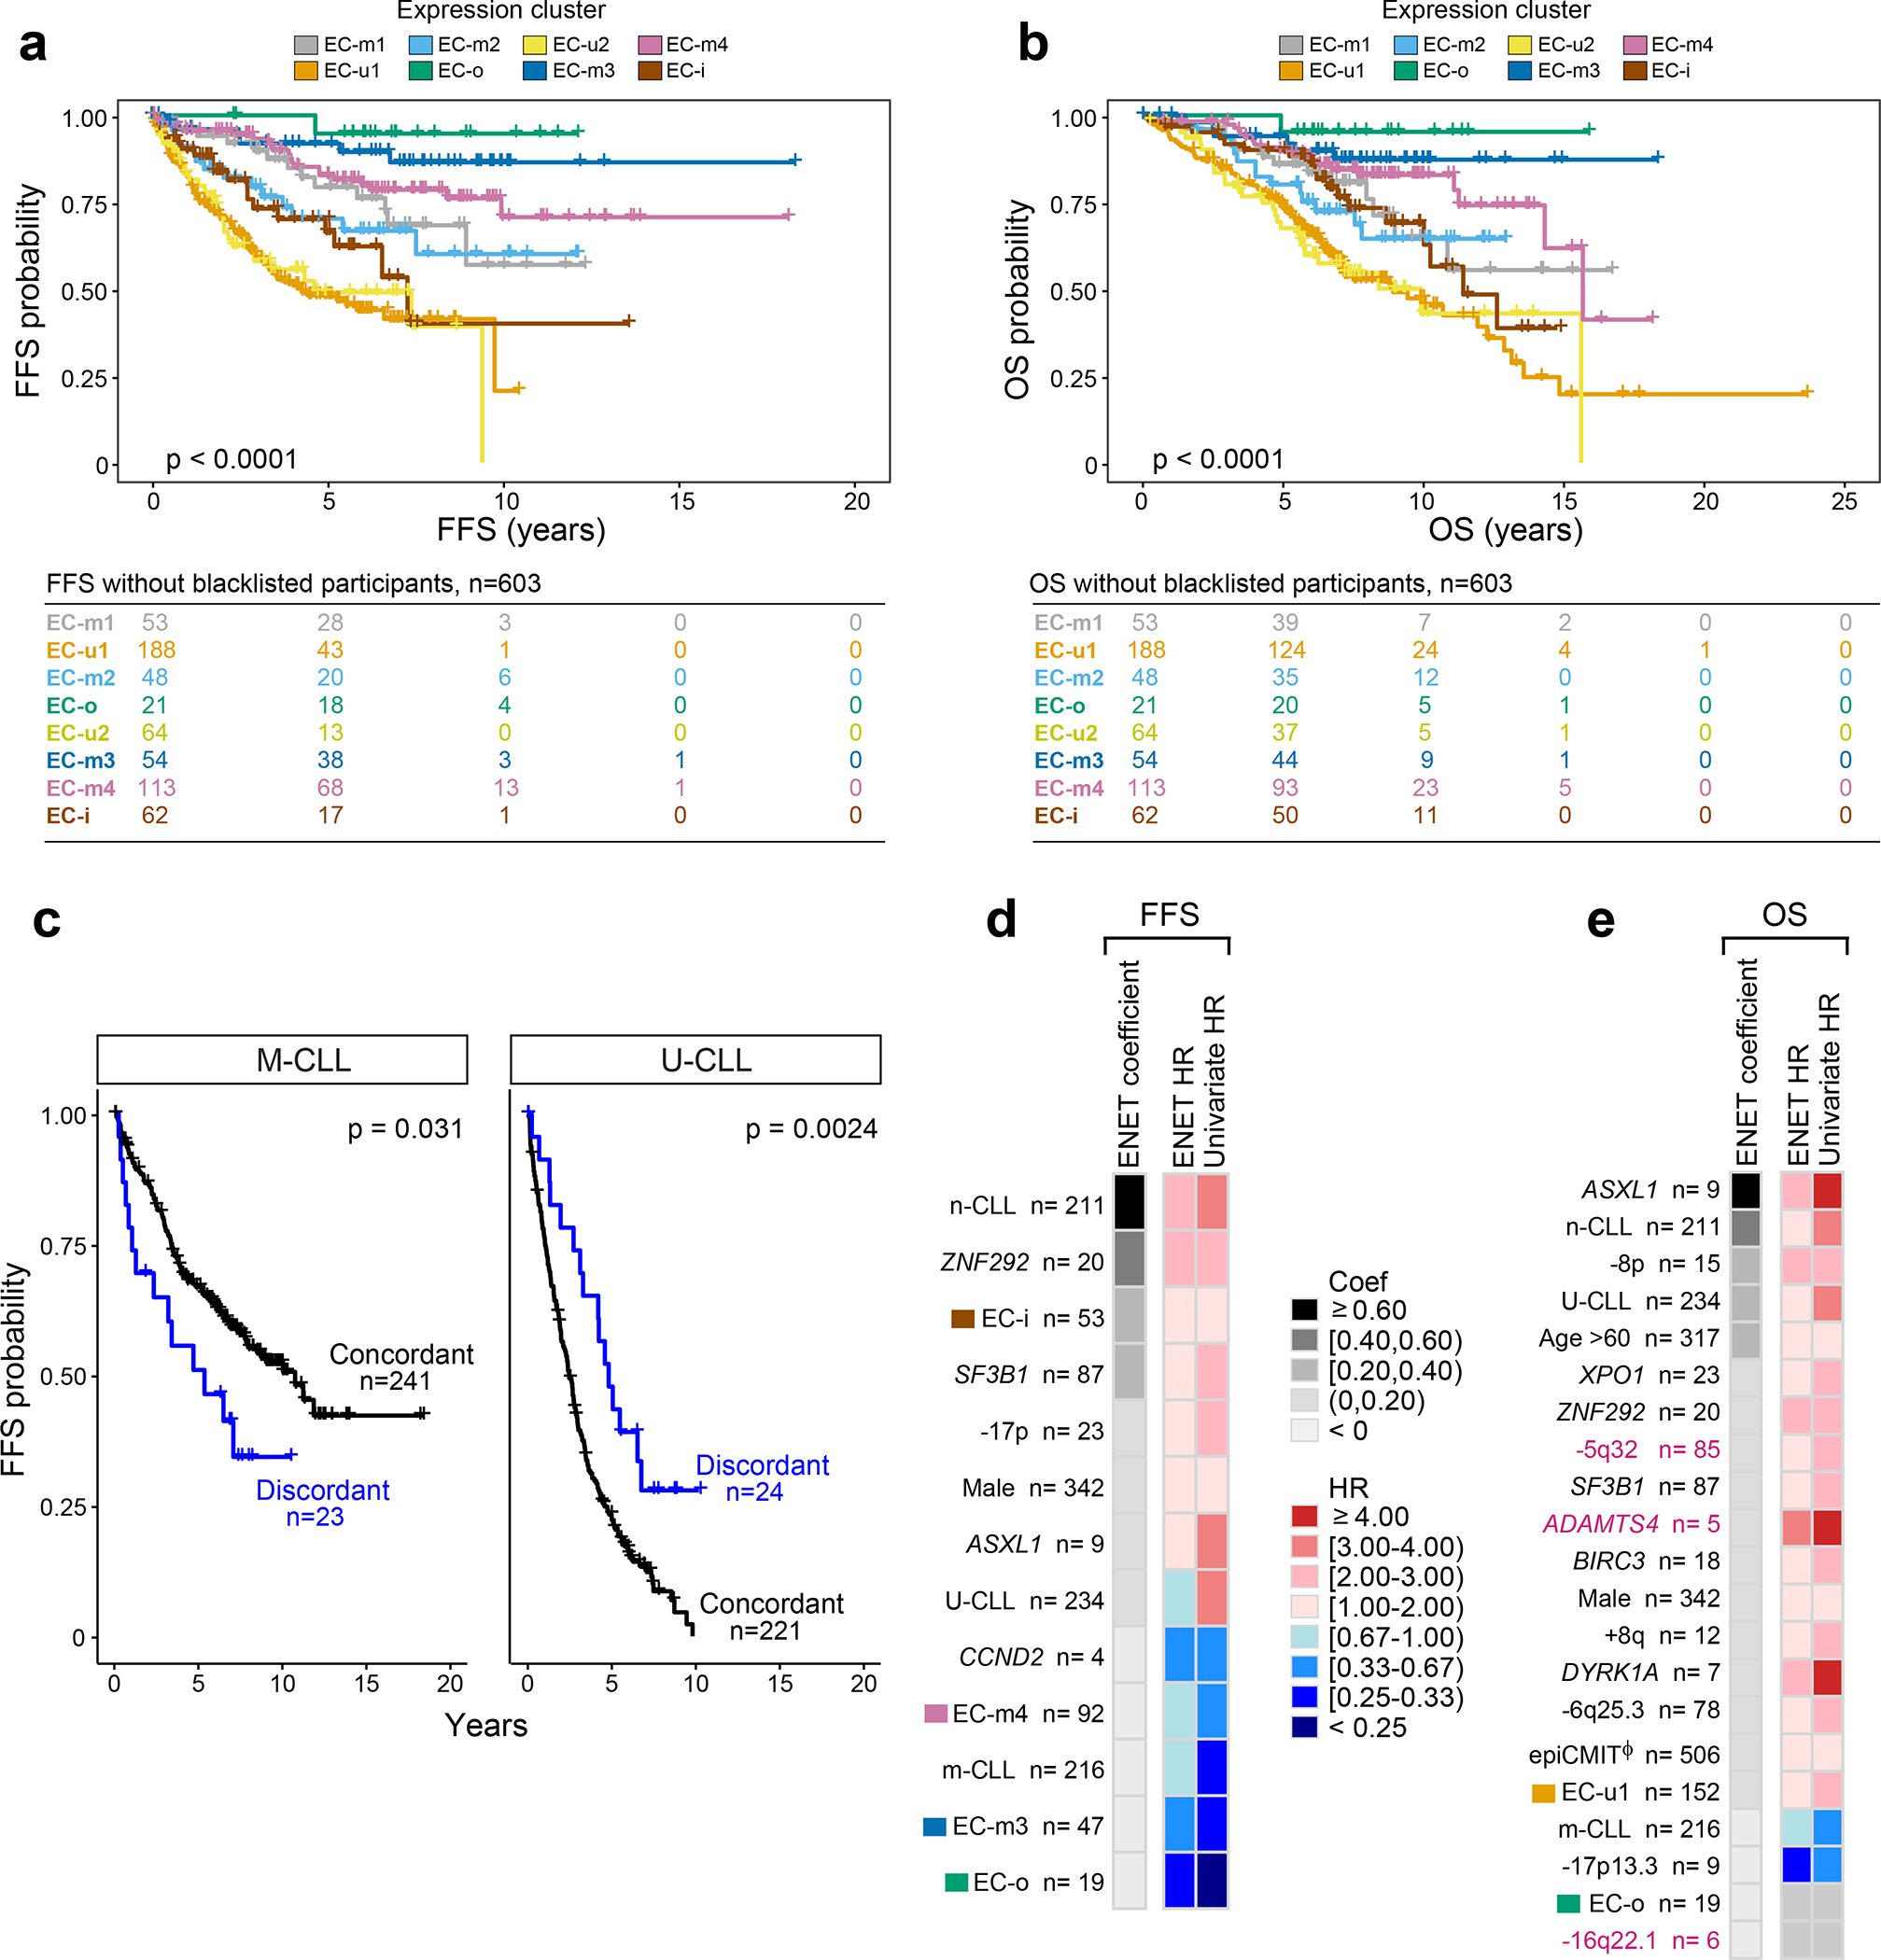
Recent advances in cancer characterization have consistently revealed marked heterogeneity, impeding the completion of integrated molecular and clinical maps for each malignancy. Here, we focus on chronic lymphocytic leukemia (CLL), a B cell neoplasm with variable natural history that is conventionally categorized into two subtypes distinguished by extent of somatic mutations in the heavy-chain variable region of immunoglobulin genes (IGHV). To build the 'CLL map,' we integrated genomic, transcriptomic and epigenomic data from 1,148 patients. We identified 202 candidate genetic drivers of CLL (109 new) and refined the characterization of IGHV subtypes, which revealed distinct genomic landscapes and leukemogenic trajectories. Discovery of new gene expression subtypes further subcategorized this neoplasm and proved to be independent prognostic factors. Clinical outcomes were associated with a combination of genetic, epigenetic and gene expression features, further advancing our prognostic paradigm. Overall, this work reveals fresh insights into CLL oncogenesis and prognostication.


Conflict of interest statement

COMPETING INTEREST DECLARATION

The authors declare the following conflicts related to the CLLmap project: C.J.W. receives research support from Pharmacyclics. E.C. has been a consultant for Illumina. G.G. receives research funds from IBM and Pharmacyclics; and is an inventor on patent applications related to SignatureAnalyzer-GPU. S.S. reports honoraria for consultancy, advisory board membership, speaker honoraria, research grants and travel support from AbbVie, Amgen, AstraZeneca, Celgene, Gilead, GSK, Hoffmann La-Roche, Janssen, Novartis. C.J.W., G.G., B.A.K., Z.L. and C.K.H. are inventors on a patent “Compositions, panels, and methods for characterizing chronic lymphocytic leukemia” (PCT/US21/45144). The following conflicts are unrelated to the CLLmap project: F.N. has received honoraria from Janssen for speaking at educational activities. E.T. declares research support by Abbvie and Roche; Advisory Boards and Speakers Bureau for Janssen, Abbvie and Roche. A.W. received research funding from Pharmacyclics, Acerta, Merck, Verastem, Genmab, Nurix. J.R.B. has served as a consultant for Abbvie, Acerta/Astra-Zeneca, Beigene, Bristol-Myers Squibb/Juno/Celgene, Catapult, Genentech/Roche, Janssen, MEI Pharma, Morphosys AG, Novartis, Pfizer, Rigel; received research funding from Gilead, Loxo/Lilly, Verastem/SecuraBio, Sun, TG Therapeutics; and served on the data safety monitoring committee for Invectys. J.A.B. received research support from AstraZeneca, BeiGene, Gilead, and Pharmacyclics; travel and speaker honoraria from Janssen. X.S.P. is a cofounder of and holds an equity stake in DREAMgenics. C.J.W. holds equity in BioNTech, Inc.. E.C. has been a consultant for Takeda and NanoString Technologies; has received honoraria from Janssen and Roche for speaking at educational activities; and is an inventor on a Lymphoma and Leukemia Molecular Profiling Project patent “Method for subtyping lymphoma subtypes by means of expression profiling” (PCT/US2014/64161). G.G. is an inventor on patent applications related to MSMuTect, MSMutSig, MSIDetect, and POLYSOLVER; and is a founder and consultant of and holds privately held equity in Scorpion Therapeutics. The other authors have no competing interests to declare.

Figures

ED Fig 1.
ED Fig 1.. Dataset description and representative driver gene maps
a. Full dataset (n=1148), with contributions by cohort and data type delineated (see Supplementary Table 1). b. Numbers of samples with genomic, epigenomic, and transcriptomic data. c. 3D protein structures of representative genes identified by CLUMPS in pan-CLL analysis (n=984, see Supplementary Table 5). Mutated residues - red labels. A peptide from RAF1 (designated at bottom-center, in complex with 14–3-3 zeta) shows clustered mutations around S259, whose phosphorylation regulates RAF1 activity and is a cancer mutational hotspot that, when mutated, perturbs the interaction with the 14–3-3 zeta and upregulates RAF1 kinase activity,. In DICER1, mutations occur in the RNase III domain (purple), including the cancer hotspot residue E1813,. This region is critical for Mg2+ binding and is required for ribonuclease activity to process microRNAs and mediate post-transcriptional gene regulation. RPS23 mutations are clustered in a conserved loop of the ribosomal decoding center, surrounding P62, whose post-translational hydroxylation affects translation termination accuracy. These RPS23 mutations have a median CCF >80% (Extended Data Fig. 6d; Supplementary Table 3). d. Individual mutations maps of selected novel, putative driver genes. Mutation subtype and position are shown. e. Selected genes identified by CLUMPS in IGHV subtypes; mutated residues - red. Although BRAF was not identified as a potential M-CLL driver via MutSig2CV (see Extended Data Fig. 3, Methods), CLUMPS revealed three mutated sites clustered in the kinase domain (purple) that are cancer hotspots, thus confirming BRAF as a shared driver (left). Mutated residues in BRAF in U-CLL (bottom) are shown for comparison, revealing a greater number of clustered mutations relative to M-CLL. In U-CLL, novel mutations were found in RRM1 (right). Somatic alterations were clustered in the N-terminal ATP-binding site (purple) and therefore have potential to impact enzymatic activity.
ED Fig 2.
ED Fig 2.. CLL biological pathways affected by candidate driver genes
a. Schema of CLL pathways containing previously identified (black) and novel (magenta) putative driver genes (see Supplementary Table 6). Novel drivers cluster in central processes driving CLL (e.g., DNA damage, chromatin modification, RNA processing),, but also highlight new pathways not previously implicated by driver genes (e.g., cytoskeleton and extracellular matrix, proteostasis, metabolism). Asterisks - mutated genes discovered by CLUMPs. b. Stacked barplot ranked by the number of candidate driver genes per CLL pathway. Magenta bars show the number of newly identified drivers in each pathway.
ED Fig 3.
ED Fig 3.. Candidate driver alterations discovered in IGHV subtypes
a-b. Landscape of putative driver genes and sCNAs in M-CLL (a, n=512) and U-CLL (b, n=459) with associated frequencies (rows, barplots). Header tracks annotate cohort, IGHV status (purple, M-CLL; orange, U-CLL), disease type (blue, CLL; yellow, MBL), epitype (blue, n-CLL; yellow, i-CLL; red, m-CLL), datatype (white, WES; yellow, WGS; blue, both); prior treatment, U1 and IGLV3–21R110 mutations are annotated in black; magenta label - novel alterations; asterisks - discovery by CLUMPS.
ED Fig 4.
ED Fig 4.. Chromosomal gains and losses identified in IGHV subtypes
a-b. Recurrent copy number gains (left) and losses (right) by GISTIC analysis showing arm level (left per plot) and focal events (right per plot) in M-CLL (a, n=512) and U-CLL (b, n=459). Chromosomes are labeled along the vertical axis; dashed line - significance at q=0.1. Blacklisted regions are colored gray. All arm level events are labeled with cytoband arm and frequency in cohort. Focal events are annotated by cytoband, frequency, number of genes encompassed in peak (bracketed), and genes of interest. Red/blue font: novel focal events with frequency >2%. Black font: previously identified events (see Supplementary Table 7).
ED Fig 5.
ED Fig 5.. Landscape of driver alterations and chromosomal aberrations in IGHV subtypes
a. The genomic landscape of CLL IGHV subtypes. Driver genes, U1 and IGLV3–21R110 mutations are labeled according to their genomic location (outside ring, numbered by chromosome). The tracks show the frequency and locations of driver genes in M-CLL (purple) vs. U-CLL (orange) (track 1; outermost), focal sCNAs (track 2; gains, red; losses, blue), and density of SV breakpoints of deletions (track 3) and translocations (track 4) (M-CLL n=88; U-CLL n=87; WGS, windows of 1-Mb). Innermost plot highlights translocations in which either one or both breakpoints are recurrent in at least 3 cases (windows of 1-Mb considered to define recurrence) in M-CLL (purple) and U-CLL (orange). Deletions, inversions, and tandem duplications where both breakpoints were found in at least 2 cases and did not overlap with a driver sCNA are shown (Note: only focal deletion in SP140 in two U-CLL cases met this criterion. b. Schema of recurrent IG-BCL2 translocation and IGH-ZFP36L1 deletion in the WGS cohort. All 5 BCL2 translocations were in M-CLL with immunoglobulin (IG) breakpoints in J or D genes, suggesting mediation by aberrant V(D)J recombination. In contrast, 4 U-CLL cases carried IGH-ZFP36L1 truncating deletions, which were all clonal (CCF=1). Breakpoints in IGH class-switch regions suggested mediation by aberrant class-switch recombination (CSR). c. Immunoglobulin (IG) SVs in 177 WGS and 984 WES. In WES, 9 of 10 BCL2 translocations were in M-CLL and mediated by aberrant V(D)J recombination in IGH (n=7) or IGK (n=2). The sole BCL2 translocation in U-CLL was due to aberrant CSR. One CSR-mediated IGH-ZFP36L1 deletion was observed in a case with unclassified IGHV status due to presence of two populations (one M-CLL, one U-CLL; the latter was more prevalent). Of note, in WES, U-CLLs carry a higher number of non-recurrent IG events than M-CLL.
ED Fig 6.
ED Fig 6.. Mutational mechanisms and cancer cell fractions of candidate drivers
Eight mutational signatures were identified in 177 WGS, but 3 signatures corresponded to known artifacts and were therefore excluded (see Supplementary Note 2). Boxplots demonstrating mutation contribution for each of the 5 signatures are labeled with single-base substitution (SBS) number and identity (per COSMIC v3.1). b. Comparison of the normalized signature intensity of the mutational signatures in U-CLL (orange, n=87) vs. M-CLL (purple, n=88). The nc-AID and c-AID 1 signatures were enriched in M-CLL, whereas the aging signature was more prevalent in U-CLL. Although not significant, there was a trend of increased mutations due to the c-AID 2 signature in U-CLL. All p-values were calculated with Wilcoxon rank-sum test, two-sided. Boxplots: center line, median; box limits, upper and lower quartiles; whiskers, 1.5x interquartile range; points, outliers. c. Proportions of clustered mutations contributed by the two c-AID related signatures (SBS84, c-AID 1 vs. SBS85, c-AID 2) for each IGHV subtype (M-CLL, purple; U-CLL, orange) d. Mean cancer cell fraction (CCF) for each non-silent mutation across all candidate driver genes identified in WES samples (n=984). Color of dots depicts the IGHV subtype (M-CLL, purple; U-CLL, orange). The horizontal red line is the threshold for clonality (CCF>85%). Magenta labels - newly identified putative driver genes. The number of non-silent mutations per driver gene is shown at the bottom. Boxplots: center line, median; box limits, upper and lower quartiles; whiskers, 1.5x interquartile range.
ED Fig 7.
ED Fig 7.. Development and validation of epitype assignment and epiCMIT in RRBS data
a. Consensus clustering matrices for K=3 groups for paired-end (n=136; 153 CpGs in consensus matrix) and single-end (n=388; 32 CpGs) RRBS data. (d). b. Empirical cumulative distribution functions (CDFs) for consensus matrices with K=2 to K=7. c. Relative change under the CDF for K=2 to K=7. d. Heatmaps of the CpGs used for consensus clustering in (a). Each sample (columns) is annotated by tracks: epitype max probability, IGHV status (M-CLL, purple; U-CLL, orange), IGHV percent identity, and presence of IGLV3–21R110 mutation (black). e. The development of the new epiCMIT methodology for RRBS data. The genome was segmented into Chromatin Hidden Markov Model (CHMM) states using ChIP-seq data to get repressed chromatin regions, where differential DNA methylation analyses was performed in high coverage whole-genome bisulfite sequencing (WGBS) data between the cells with the lowest and highest accumulated cell divisions in the B-cell lineage, namely the hematopoietic precursor cells (HPC) and bone-marrow plasma cells (bmPC). Only CPGs showing extensive differences were retained and constituted the epiCMIT-hyper CpGs or epiCMIT-hypo CpGs depending whether they gain or lose DNA methylation from 0.9 to ≤0.5 from HPC to bmPC, respectively. EpiCMIT-hyper and epiCMIT-hypo scores were calculated according to the available epiCMIT-CpGs per sample, and the higher score in each sample was then selected. f. epiCMIT values on the same samples profiled twice with different platforms. Approach 1 - profiled with Illumina-450k (green); approach 2 - profiled with RRBS-PE (violet). In samples profiled with Illumina 450k, the original epiCMIT-CpGs were used. In samples profiled with RRBS, epiCMIT was calculated with all available epiCMIT-CpGs for the new catalog (e, Methods). P-value by Pearson correlation test, two-sided; Error band - 95% confidence intervals of the Pearson correlation coefficient.
ED Fig 8.
ED Fig 8.. Identification of expression clusters with associated biologic features
a. Cohort representation in each expression cluster. b. Consensus matrix for RNA expression profiles of 603 treatment-naive CLLs by repeated hierarchical clustering with 80% resampling and varying cutoffs for number of clusters, which is inputted to the BayesNMF procedure (Methods). c. Uniform manifold approximation and projection (UMAP) showing clustering of ECs (n=603; EC-u clusters (top), EC-m and EC-o (middle), EC-i (bottom)). Analysis was performed using the marker genes identified by BayesNMF. d. UMAP of H3K27ac profiles (n=104) denoting EC designation where available (colored points, n=73) and IGHV status. e. Comparison of the percent IGHV identity among ECs. Dotted line: 98% threshold defining M-CLL and U-CLL. P-values by two-sided t-tests. Boxplots: center line, median; box limits, upper and lower quartiles; whiskers, 1.5x interquartile range. f. Comparison of the percent IGHV identity between those samples with concordant IGHV status and ECs (e.g., M-CLLs in EC-m clusters) versus the discordant samples (e.g., M-CLLs in EC-u clusters). IGHV mutated cases - left; IGHV unmutated samples - right. P-values by two-sided t-tests. Boxplots: center line, median; box limits, upper and lower quartiles; whiskers, 1.5x interquartile range. g. Percentage of cases carrying stereotyped immunoglobulin genes within each EC. Red horizontal line: percentage of stereotyped cases in the whole cohort. h. Fraction of cases classified in each CLL stereotype subset according to their EC. i. Percentage of IGHV (left) and IG(K/L)V (right) gene usage within each EC. IGKV genes from proximal and distal clusters were merged for simplification. All p-values were calculated using Chi-squared tests corrected by the Benjamini-Hochberg procedure (q-values, q). q < 0.1; *, q < 0.05; **, q < 0.001; ***, q < 0.0001. j-k. Heatmaps showing upregulated (j) and downregulated (k) H3K27ac levels of EC marker genes and 2,000 bp upstream to capture regulatory regions (Methods).
ED Fig 9.
ED Fig 9.. EC differential gene expression, pathway activity, and classifier
Differentially expressed genes per EC (red) using discovery set (n=603); EC marker genes by BayesNMF (blue). Significant up- or down-regulation of H3K27ac levels are directionally marked with triangles (ChIP-seq available for n=73; n=1 for EC-o and EC-i, thus unevaluable). b. EC gene set enrichment analysis (GSEA). Diamond denotes the EC compared to all others (circles). c. Confusion matrix for the EC classifier on the test set (“Dominance” defined in Methods). d. Confidence in correctly classified samples (n=95) is greater than for incorrectly classified samples (n=25; two-sided t-test). “Prediction margin” defined in Methods. Boxplots: center line, median; box limits, upper and lower quartiles; whiskers, 1.5x interquartile range. e. Receiver-operator curve (ROC) showing the tradeoff between sensitivity and specificity for the range of cutoffs that can be applied based on the “prediction margin”, where samples under the cutoff are excluded from performance evaluation. AUC, area under curve. f. Precision-recall (PR) curves for EC classification performance on the test set (n=120), using the selected model (see Methods). The weighted average of AUC is 0.88. g. Performance metrics for models trained with differing amounts of input genes, demonstrating accuracy even with smaller gene sets. Metrics: Accuracy, overall; Average, weighted average across ECs (Methods). Nc, Ntot - number of genes (see Methods). h. EC distributions by BayesNMF compared to classifier predictions on the discovery cohort (n=603), an extension cohort not included discovery (n=105), and an external CLL cohort (n=136). i. IGHV status distributions per EC in discovery (n=603) and external (n=136) cohorts. The difference in IGHV-mutated samples per EC is 2–10% (p>0.05, Fisher’s Exact, Methods). j. Stability of the ECs over time in longitudinally sampled CLL samples. Sample timepoints (x-axis); years between first and last sample (above curve).
Figure 1:
Figure 1:. Increased power enables CLL driver gene detection.
a-b. By down-sampling analysis, driver gene (a) and sCNA (b) discovery increases with additional samples. Points represent a random subset of samples with smoothed fit line; analysis separated by frequency. c. Landscape of genetic alterations in CLL with frequency of alterations (right, n=1063 patients). Header tracks - annotation of cohort, IGHV status, CLL or MBL sample, epigenetic subtype (epitype: naive-like, n-CLL; intermediate, i-CLL; memory-like, m-CLL), sequencing data type; prior treatment, U1 and IGLV3–21R110 mutations - black; magenta label - novel alterations. Asterisks - discovery by CLUMPS. Bottom tracks - Lower frequency sSNV/indels and sCNAs, designated as novel (magenta), known events (blue) or both (black). Bottom boxed inset - candidate driver genes, frequency <1%. d. Representative genes identified by CLUMPS (see Supplementary Table 5). 3D protein structure of MAP2K2 and DIS3. Mutated residues (red labels) cluster in functional regions (purple). e. Recurrent copy number gains (top) and losses (bottom) by GISTIC analysis showing arm level (left) and focal events (right). Chromosome number - vertical axis; dashed line - significance, q=0.1. Blacklisted regions - gray. Arm level events are labeled with cytoband and frequency (n=984). Focal events denote cytoband, frequency, number of genes encompassed in peak (bracketed), and genes of interest. Red/blue font: novel focal events with frequency >2%. Black font: previously known events (see Supplementary Table 7).
Figure 2:
Figure 2:. M-CLL and U-CLL have unique genomic landscapes.
a-b. Comparison of candidate driver genes (a) or copy number gains/losses (up/down triangle, respectively, b) in U-CLL (y-axis, WES, n=459) vs. M-CLL (x-axis, WES, n=512) plotted by −log10(q-value). Significance - dashed line. Representative candidate drivers are annotated. Frequency in entire cohort (n=984) - size of circle (a) or triangle (b). Orange - drivers predominantly in U-CLL; purple - predominantly in M-CLL. c. League model timing diagrams comparing acquisition of somatic mutation and arm level sCNAs in M-CLL (top, n=251) and U-CLL (bottom, n=354). Higher timing score (x-axis) denotes later event; median scores - yellow marks (95% confidence interval, gray). Purple - events significant in M-CLL; orange - events significant in U-CLL; black - events shared by M-CLL and U-CLL. Asterisks - significant difference in timing (q<0.1). d-e. Somatic alterations associated with failure free survival (FFS) and overall survival (OS) in M-CLL (d, WES/WGS, n=518 and U-CLL (e, WES/WGS, n=476). Events ranked by elastic net (ENET) coefficients, which identifies variables to be included in the model, shrinking coefficients to 0 when excluded. Heatmap denotes hazard ratios (HR) for ENET and univariate Cox regressions. Events included by ENET model (concentric circle) or significant in univariate analysis only (closed circle) in treatment-naive, non-trial patients (M-CLL, n=393; U-CLL, n=247) annotated on right. Magenta label - novel alterations (see Supplementary Table 11). f. Number of candidate drivers in three genomic driver detection analyses: entire cohort (All, n=984), M-CLL (n=512) and U-CLL (n=459). For each analysis set, sSNV/indel represents candidate driver genes from MutSig2CV and CLUMPS, while sCNA represents recurrent events from GISTIC. Union - total putative drivers identified in any of the three analysis sets.
Figure 3:
Figure 3:. CLL subtypes based on epigenetic and transcriptomic features
a. Main sources of variability in the DNA methylome are epitype and epiCMIT as determined by unsupervised principal component analysis in samples analyzed by 450k methylation array (top, n=490) or single-end reduced representation bisulfite sequencing (RRBS-SE, bottom, n=388). b. Eight gene expression clusters (ECs, columns) were identified by Bayesian non-negative matrix factorization (BNMF) method in 603 treatment-naive samples. Heatmap demonstrates associated upregulated (red) and downregulated (blue) marker genes for each cluster (rows) with select genes (right, see Supplementary Table 13). Right vertical panel demonstrates upregulated (red) or downregulated (blue) histone 3 lysine 27 acetylation (H3K27ac) in regulatory regions for each marker gene; EC-o and EC-i H3K27ac was not assessed due to low sample size (NA, gray). Header - number of samples in ECs; association with IGHV subtype (M-CLL, purple; U-CLL, orange); epitype (n-CLL, blue; i-CLL, yellow; m-CLL, red). Frequency of common CLL alterations is shown for each EC. Significant associations - asterisks (q<0.1, curveball algorithm, Methods). c. Differential gene expression of tri(12)-positive and -negative cases in EC-m2 (top) and EC-u2 (bottom) compared to all other M-CLL or U-CLLs, respectively (EC marker genes shown in blue). d. Dendrogram of ECs with associated upregulated and downregulated biologic pathways determined by gene set enrichment analysis (see Extended Data Fig. 9b). e. Cellular proliferative history, represented by epiCMIT, varied in ECs enriched with m-CLL epitype. EC-m3 had significantly lower epiCMIT relative to EC-m1, EC-m2, and EC-m4 (p-values by two-sided t-test; unadjusted). The dashed red line marks the mean epiCMIT in all m-CLLs (n=404). Boxplots: center line, median; box limits, upper and lower quartiles; whiskers, 1.5x interquartile range.
Figure 4:
Figure 4:. Expression clusters and integrated analysis predicts clinical outcome
a-b. Kaplan Meier analysis of the impact of expression clusters on (a) failure free survival (FFS) and (b) overall survival (OS) probabilities in 603 treatment-naive samples (log-rank test). c. Kaplan Meier analysis assessing the difference in FFS probability between samples with concordant IGHV status and ECs (e.g., M-CLLs in EC-m clusters) versus those that are discordant (e.g., M-CLLs in EC-u clusters). M-CLLs - left; U-CLLs - right. Log-rank test (two-sided; unadjusted p-values). d-e. Genetic, epigenetic, and transcriptomic features associated with (d) FFS and (e) OS in treatment-naive samples (n=506). Events ranked by elastic net (ENET) coefficients, which identifies variables to be included in the model, shrinking coefficients to 0 when excluded. Heatmap denotes hazard ratios (HR) for ENET and univariate Cox regressions (see Supplementary Table 14). Continuous variable - Φ (epiCMIT).

References

    1. Landau DA et al. Mutations driving CLL and their evolution in progression and relapse. Nature 526, 525 (2015). - PMC - PubMed
    1. Puente XS et al. Non-coding recurrent mutations in chronic lymphocytic leukaemia. Nature 526, 519 (2015). - PubMed
    1. Gruber M et al. Growth dynamics in naturally progressing chronic lymphocytic leukaemia. Nature 570, 474–479 (2019). - PMC - PubMed
    1. Dvinge H et al. Sample processing obscures cancer-specific alterations in leukemic transcriptomes. Proceedings of the National Academy of Sciences 111, 16802–16807 (2014). - PMC - PubMed
    1. Ferreira PG et al. Transcriptome characterization by RNA sequencing identifies a major molecular and clinical subdivision in chronic lymphocytic leukemia. Genome Res. 24, 212–226 (2014). - PMC - PubMed

METHODS-ONLY REFERENCES

    1. Stilgenbauer S et al. Gene mutations and treatment outcome in chronic lymphocytic leukemia: results from the CLL8 trial. Blood 123, 3247–3254 (2014). - PubMed
    1. Stilgenbauer S et al. Alemtuzumab combined with dexamethasone, followed by alemtuzumab maintenance or Allo-SCT in ‘ultra high-risk’ CLL: Final results from the CLL2O phase II study. Blood 124, 1991–1991 (2014).
    1. Wang L et al. SF3B1 and other novel cancer genes in chronic lymphocytic leukemia. N. Engl. J. Med. 365, 2497–2506 (2011). - PMC - PubMed
    1. Landau DA et al. Locally disordered methylation forms the basis of intratumor methylome variation in chronic lymphocytic leukemia. Cancer Cell 26, 813–825 (2014). - PMC - PubMed
    1. Javed N et al. Detecting sample swaps in diverse NGS data types using linkage disequilibrium. Nat. Commun. 11, 3697 (2020). - PMC - PubMed

Publication types

Substances