. 2022 Aug 4;12(1):13396.
doi: 10.1038/s41598-022-16968-9.

Predicting liver regeneration following major resection

Affiliations

Predicting liver regeneration following major resection

Karolin Dehlke et al. Sci Rep. .

Abstract

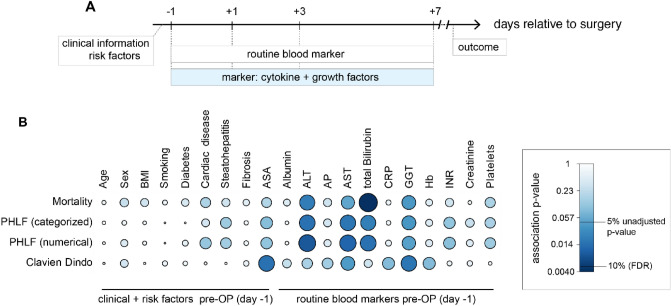
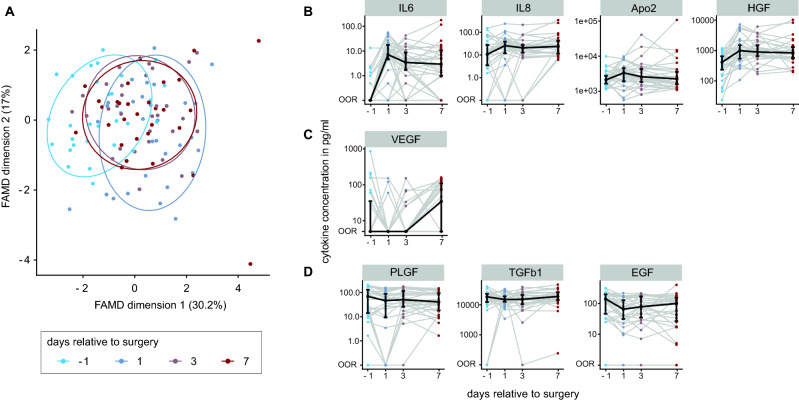
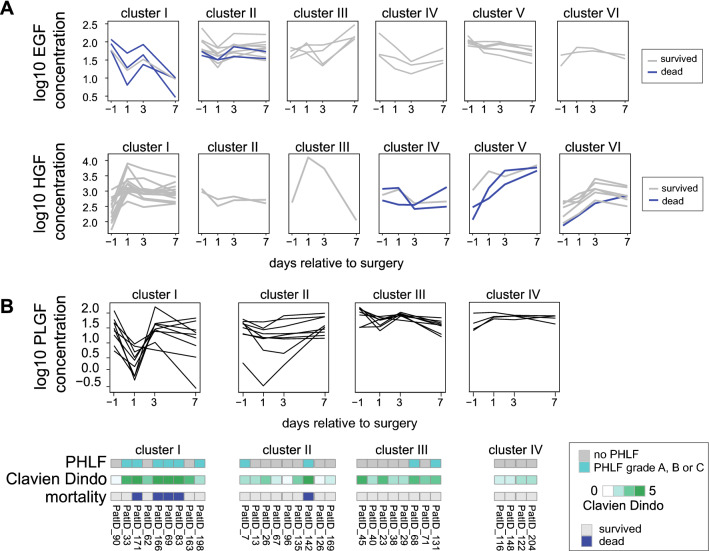
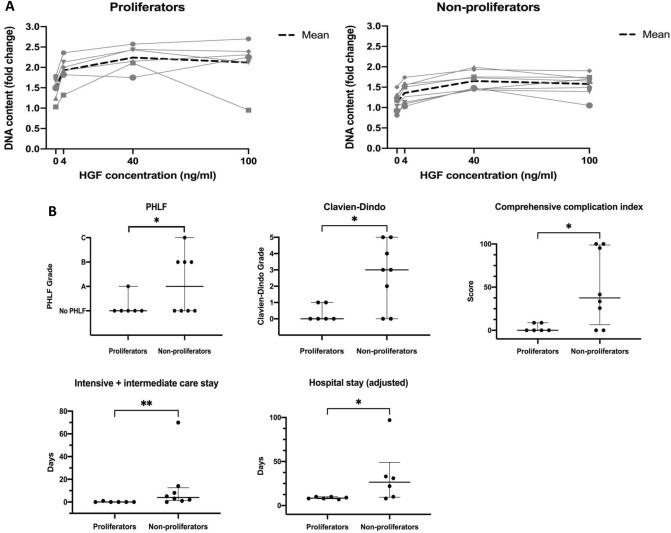
Breakdown of synthesis, excretion and detoxification defines liver failure. Post-hepatectomy liver failure (PHLF) is specific for liver resection and a rightfully feared complication due to high lethality and limited therapeutic success. Individual cytokine and growth factor profiles may represent potent predictive markers for recovery of liver function. We aimed to investigate these profiles in post-hepatectomy regeneration. This study combined a time-dependent cytokine and growth factor profiling dataset of a training (30 patients) and a validation (14 patients) cohorts undergoing major liver resection with statistical and predictive models identifying individual pathway signatures. 2319 associations were tested. Primary hepatocytes isolated from patient tissue samples were stimulated and their proliferation was analysed through DNA content assay. Common expression trajectories of cytokines and growth factors with strong correlation to PHLF, morbidity and mortality were identified despite highly individual perioperative dynamics. Especially, dynamics of EGF, HGF, and PLGF were associated with mortality. PLGF was additionally associated with PHLF and complications. A global association-network was calculated and validated to investigate interdependence of cytokines and growth factors with clinical attributes. Preoperative cytokine and growth factor signatures were identified allowing prediction of mortality following major liver resection by regression modelling. Proliferation analysis of corresponding primary human hepatocytes showed associations of individual regenerative potential with clinical outcome. Prediction of PHLF was possible on as early as first postoperative day (POD1) with AUC above 0.75. Prediction of PHLF and mortality is possible on POD1 with liquid-biopsy based risk profiling. Further utilization of these models would allow tailoring of interventional strategies according to individual profiles.


Conflict of interest statement

The authors declare no competing interests.

Figures

Figure 1
Figure 1
Study cohort overview of routine data and additional plasma marker. (A) Schematic overview of available data. (B) Pairwise-associations tests of routinely available preoperative data with four outcome parameters. Colors and size of the circle indicate the strength of association. The first nine columns correspond to general clinical information and known risk factors. The last 11 columns represent routine blood markers measured one day before surgery. The risk of mortality was significantly associated with the level of preoperative total bilirubin after adjusting for multiple testing (Kruskal–Wallis test unadjusted p value of 0.0033, FDR adj. p = 0.084).
Figure 2
Figure 2
Cytokine and growth factor levels vary before and after surgery. (A) Factor analysis for mixed data on cytokine and growth factor data. The first dimension explains 30.2% of the variance and separates preoperative time point (day -1) from postoperative time points. 80% confidence intervals are drawn per time point. Every point represents one patient for one time point. (B) Time course of cytokines and growth factors relative to surgery showing increasing concentrations. (C) Time course of VEGF showing concentrations below the detection limit until POD7. (D) Time course of cytokines and growth factors with a slight decrease. Median and IQR (25% and 75% quantiles) are indicated in black. Each patient is connected by one grey line over the time points. OOR depicts out of range values.
Figure 3
Figure 3
Clustering of growth factor trajectories related to clinical outcome parameter. Every cluster presents groups of patients with similar perioperative dynamics over time. (A) Concentrations over time for every patient shown in grey lines. Incidence of mortality indicated as a blue line. EGF and HGF were each split into six clusters I–VI, respectively. (B) Perioperative dynamics of PLGF split into four clusters (I–IV). Patient outcome parameters are depicted below according to their cluster assignment. Cluster I encompasses patients’ strong fluctuations and severe outcome.
Figure 4
Figure 4
Timepoint dependent cytokine and growth factor concentrations and association among plasma proteins and clinical attributes. (A) Pairwise correlation of cytokine and growth factor concentrations separated by time points. (B) Global association network of known and novel study parameters. Oval nodes display the laboratory values, rectangular nodes the clinical information, hexagonal nodes cytokines or growth factors, and the diamond-shaped outcome parameter of interest. Every line indicates a significant association between two nodes. Dotted lines show association in training cohort data, solid lines associations validated in the validation data. PHLF numerical and categorized showed exact same interactions and were combined as PHLF for easier visualization.
Figure 5
Figure 5
Predicting mortality and PHLF (A) AUC for predicting PHLF from different data sets. Data indicated on the x-axis consisted either of only cytokines, cytokine and clinical data, cytokine and routine lab data, or all three data. For each model, only data from one time point was used. Grey bars highlight AUC from training data (hollow dots) and validation data (solid dots blue box) from elastic net and random forest (orange and purple) close to 1 on POD 1. (B) Coefficients of the non-zero coefficients of the elastic net models in grey boxes 1 and 2 are displayed, color-coded by the respective positive or negative estimate. (C) AUC for predicting mortality from different data sets. Data indicated on the x-axis consisted either of only cytokines, cytokine and clinical data, cytokine and routine lab data, or all three data. For each model, only data from one time point was used. The validation AUC (solid shape) for some applied methods (highlighted with grey boxed) and some data sets (x-axis) is relatively close to 1 even for data from day -1 and POD 1. (D) Same as B for boxes 3, 4 and 5.
Figure 6
Figure 6
Individual regeneration capacity and clinical outcome. PHHs were isolated from the resected specimen of 14 patients from the validation cohort. (A) Proliferation response of PHHs. The maximal fold change of proliferation induced by HGF stimulation was chosen as grouping criteria. The cut-off was set at the fold change of two. Patients were grouped in proliferators and non-proliferators. (B) Association between proliferation response of PHHs and clinical outcome. Hospitals stay adjusted includes only patients without in-hospital mortality. Differences between groups were analysed by Mann–Whitney-U, Chi square and Fishers exact test. *p ≤ 0.05; **p ≤ 0.001.

References

    1. Ferlay J, et al. Cancer incidence and mortality worldwide: sources, methods and major patterns in GLOBOCAN 2012. Int. J. Cancer. 2015;136(5):E359–E386. doi: 10.1002/ijc.29210. - DOI - PubMed
    1. Adam R, et al. The oncosurgery approach to managing liver metastases from colorectal cancer: A multidisciplinary international consensus. Oncologist. 2012;17(10):1225–1239. doi: 10.1634/theoncologist.2012-0121. - DOI - PMC - PubMed
    1. Jarnagin WR, et al. Improvement in perioperative outcome after hepatic resection: analysis of 1,803 consecutive cases over the past decade. Ann. Surg. 2002;236(4):397–406. doi: 10.1097/00000658-200210000-00001. - DOI - PMC - PubMed
    1. Riediger C, et al. Comparative analysis of different transection techniques in minor and major hepatic resections: A prospective cohort study. Int. J. Surg. 2013;11(9):826–833. doi: 10.1016/j.ijsu.2013.08.010. - DOI - PubMed
    1. Shindoh J, et al. Safety and efficacy of portal vein embolization before planned major or extended hepatectomy: An institutional experience of 358 patients. J. Gastrointest. Surg. 2014;18(1):45–51. doi: 10.1007/s11605-013-2369-0. - DOI - PubMed

Publication types