

Sub-national tailoring of seasonal malaria chemoprevention in Mali based on malaria surveillance and rainfall data
- PMID: 35927679
- PMCID: PMC9351140
- DOI: 10.1186/s13071-022-05379-4
Sub-national tailoring of seasonal malaria chemoprevention in Mali based on malaria surveillance and rainfall data
Abstract
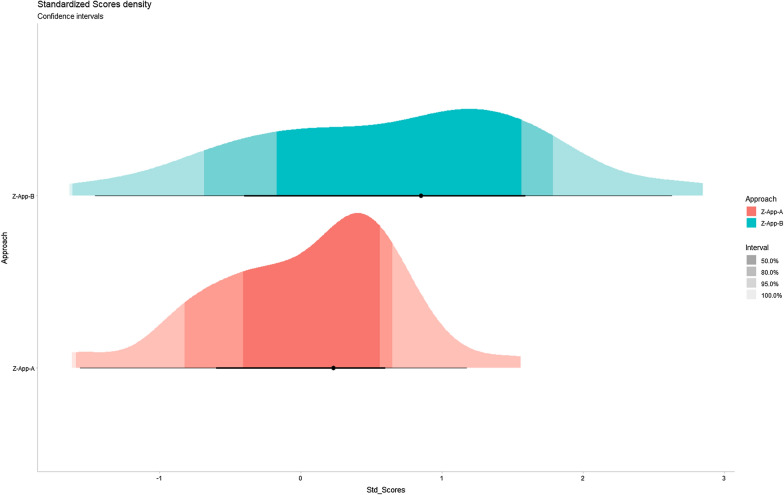
Background: In malaria endemic countries, seasonal malaria chemoprevention (SMC) interventions are performed during the high malaria transmission in accordance with epidemiological surveillance data. In this study we propose a predictive approach for tailoring the timing and number of cycles of SMC in all health districts of Mali based on sub-national epidemiological surveillance and rainfall data. Our primary objective was to select the best of two approaches for predicting the onset of the high transmission season at the operational scale. Our secondary objective was to evaluate the number of malaria cases, hospitalisations and deaths in children under 5 years of age that would be prevented annually and the additional cost that would be incurred using the best approach.
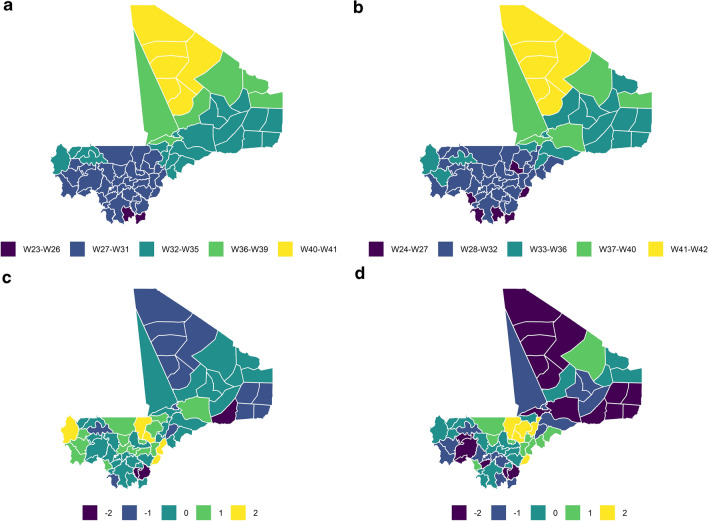
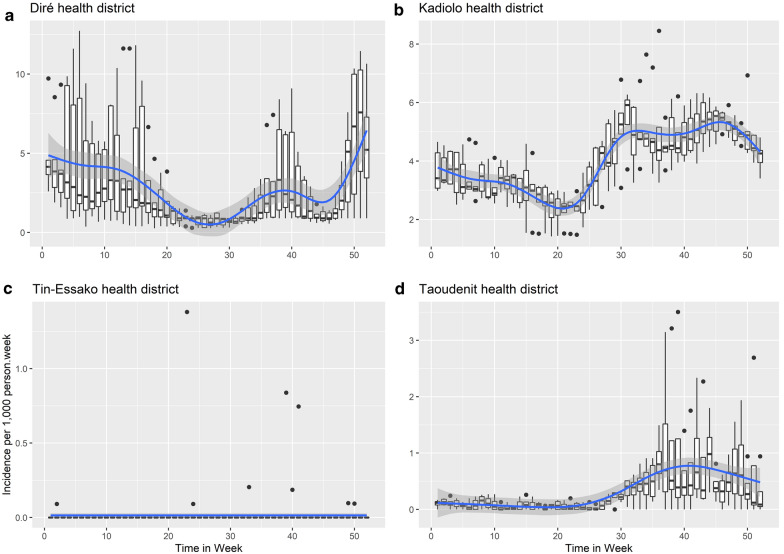
Methods: For each of the 75 health districts of Mali over the study period (2014-2019), we determined (1) the onset of the rainy season period based on weekly rainfall data; (ii) the onset and duration of the high transmission season using change point analysis of weekly incidence data; and (iii) the lag between the onset of the rainy season and the onset of the high transmission. Two approaches for predicting the onset of the high transmission season in 2019 were evaluated.
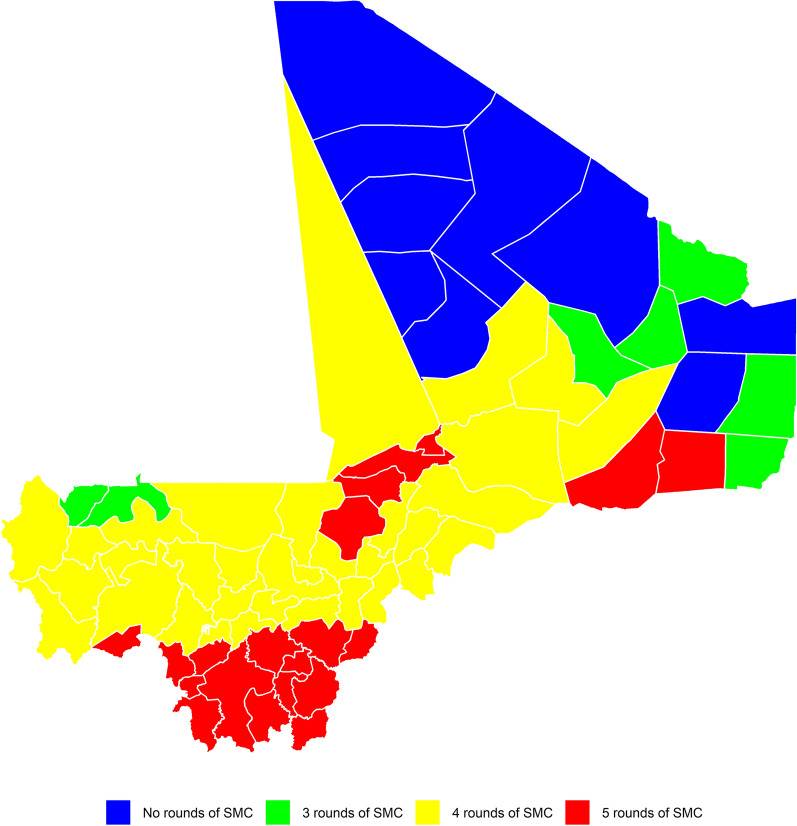
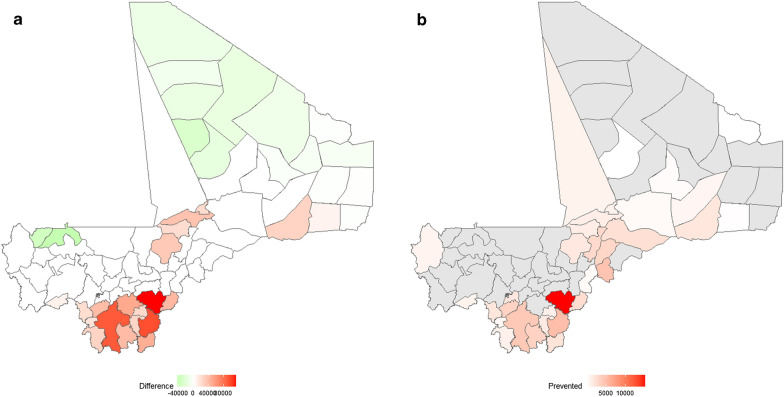
Results: In the study period (2014-2019), the onset of the rainy season ranged from week (W) 17 (W17; April) to W34 (August). The onset of the high transmission season ranged from W25 (June) to W40 (September). The lag between these two events ranged from 5 to 12 weeks. The duration of the high transmission season ranged from 3 to 6 months. The best of the two approaches predicted the onset of the high transmission season in 2019 to be in June in two districts, in July in 46 districts, in August in 21 districts and in September in six districts. Using our proposed approach would prevent 43,819 cases, 1943 hospitalisations and 70 deaths in children under 5 years of age annually for a minimal additional cost. Our analysis shows that the number of cycles of SMC should be changed in 36 health districts.
Conclusion: Adapting the timing of SMC interventions using our proposed approach could improve the prevention of malaria cases and decrease hospitalisations and deaths. Future studies should be conducted to validate this approach.
Keywords: High transmission season; Malaria; Rainfall; Sub-national; Tailoring.
© 2022. The Author(s).
Conflict of interest statement
The authors declare that they have no competing interests.
Figures
Similar articles
-
Evaluation of seasonal malaria chemoprevention in two areas of intense seasonal malaria transmission: Secondary analysis of a household-randomised, placebo-controlled trial in Houndé District, Burkina Faso and Bougouni District, Mali.PLoS Med. 2020 Aug 21;17(8):e1003214. doi: 10.1371/journal.pmed.1003214. eCollection 2020 Aug. PLoS Med. 2020. PMID: 32822362 Free PMC article. Clinical Trial.
-
Extending seasonal malaria chemoprevention to five cycles: a pilot study of feasibility and acceptability in Mangodara district, Burkina Faso.BMC Public Health. 2022 Mar 5;22(1):442. doi: 10.1186/s12889-022-12741-9. BMC Public Health. 2022. PMID: 35247990 Free PMC article.
-
Evolution of Malaria Incidence in Five Health Districts, in the Context of the Scaling Up of Seasonal Malaria Chemoprevention, 2016 to 2018, in Mali.Int J Environ Res Public Health. 2021 Jan 19;18(2):840. doi: 10.3390/ijerph18020840. Int J Environ Res Public Health. 2021. PMID: 33478166 Free PMC article.
-
Effect of seasonal malaria chemoprevention in children between 5 and 9 years old in Kita and Bafoulabe districts, Mali.Parasite Epidemiol Control. 2022 Jun 22;18:e00258. doi: 10.1016/j.parepi.2022.e00258. eCollection 2022 Aug. Parasite Epidemiol Control. 2022. PMID: 35789762 Free PMC article. Review.
-
Seasonal malaria chemoprevention in Africa and China's upgraded role as a contributor: a scoping review.Infect Dis Poverty. 2023 Jul 5;12(1):63. doi: 10.1186/s40249-023-01115-x. Infect Dis Poverty. 2023. PMID: 37403183 Free PMC article.
Cited by
-
Malaria in Burkina Faso: A comprehensive analysis of spatiotemporal distribution of incidence and environmental drivers, and implications for control strategies.PLoS One. 2023 Sep 13;18(9):e0290233. doi: 10.1371/journal.pone.0290233. eCollection 2023. PLoS One. 2023. PMID: 37703223 Free PMC article.
-
Impact of seasonal malaria chemoprevention timing on clinical malaria incidence dynamics in the Kedougou region, Senegal.PLOS Glob Public Health. 2025 Jan 15;5(1):e0003197. doi: 10.1371/journal.pgph.0003197. eCollection 2025. PLOS Glob Public Health. 2025. PMID: 39813298 Free PMC article.
-
Malaria prevention in children: an update.Curr Opin Pediatr. 2024 Apr 1;36(2):164-170. doi: 10.1097/MOP.0000000000001332. Epub 2024 Jan 22. Curr Opin Pediatr. 2024. PMID: 38299986 Free PMC article. Review.
-
Identifying malaria epidemic periods in Togo by health district and target group: a generalised additive model approach.BMC Infect Dis. 2025 Aug 13;25(1):1013. doi: 10.1186/s12879-025-10956-w. BMC Infect Dis. 2025. PMID: 40804656 Free PMC article.
-
Impact of Control Interventions on Malaria Incidence in the General Population of Mali.J Epidemiol Glob Health. 2025 Mar 12;15(1):40. doi: 10.1007/s44197-025-00381-2. J Epidemiol Glob Health. 2025. PMID: 40072686 Free PMC article.
References
-
- WHO. World malaria report 2020. 2021. https://www.who.int/publications/i/item/9789240015791. Accessed 23 Dec 2021.
-
- Cellule de Planification et de Statistique Secteur Santé-Développement Social et Promotion de la Famille (CPS/SS-DS-PF)—Institut National de la Statistique (INSTAT), Centre d’Études et d’Information Statistiques (INFO-STAT). Demographic and Health Survey (DHS) in Mali, 2018. 2019. https://dhsprogram.com/pubs/pdf/SR261/SR261.E.pdf. Accessed 14 Feb 2021.
-
- The World bank Data. Estimates developed by the UN Inter-agency Group for Child Mortality Estimation (UNICEF, WHO, World Bank, UN DESA Population Division): Mortality rate, under-5 (per 1,000 live births)—sub-Saharan Africa: data. 2019. https://data.worldbank.org/indicator/SH.DYN.MORT?locations=ZG&view=map. Accessed 22 Jul 2021.
-
- WHO. Global technical strategy for malaria 2016–2020. 2015. https://www.who.int/malaria/publications/atoz/9789241564991/en/. Accessed 10 Feb 2020.
MeSH terms
Substances
LinkOut - more resources
Full Text Sources
Medical
Miscellaneous
