. 2022 Aug 4;23(1):167.
doi: 10.1186/s13059-022-02731-w.

Methylome decoding of RdDM-mediated reprogramming effects in the Arabidopsis MSH1 system

Affiliations

Methylome decoding of RdDM-mediated reprogramming effects in the Arabidopsis MSH1 system

Hardik Kundariya et al. Genome Biol. .

Abstract

Background: Plants undergo programmed chromatin changes in response to environment, influencing heritable phenotypic plasticity. The RNA-directed DNA methylation (RdDM) pathway is an essential component of this reprogramming process. The relationship of epigenomic changes to gene networks on a genome-wide basis has been elusive, particularly for intragenic DNA methylation repatterning.

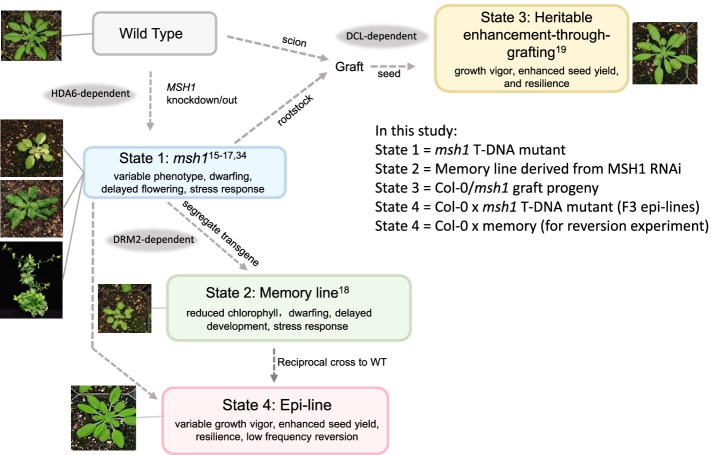
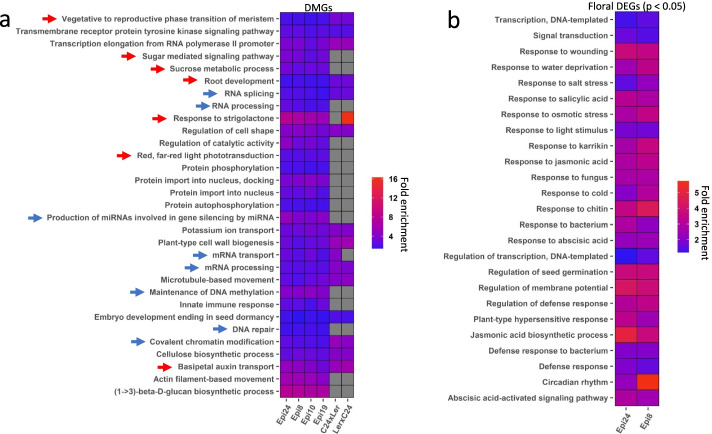
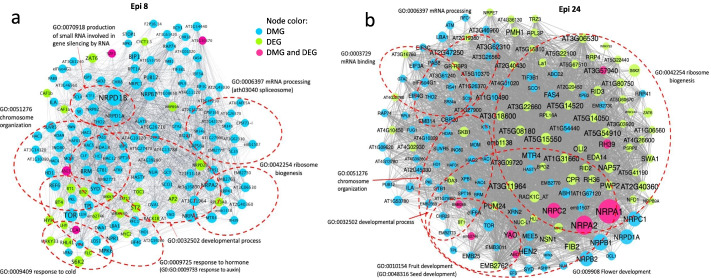
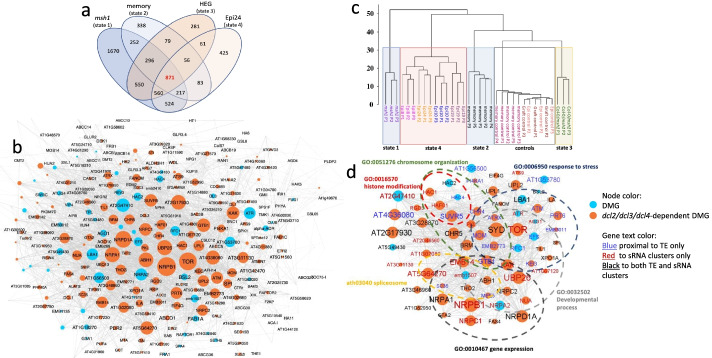
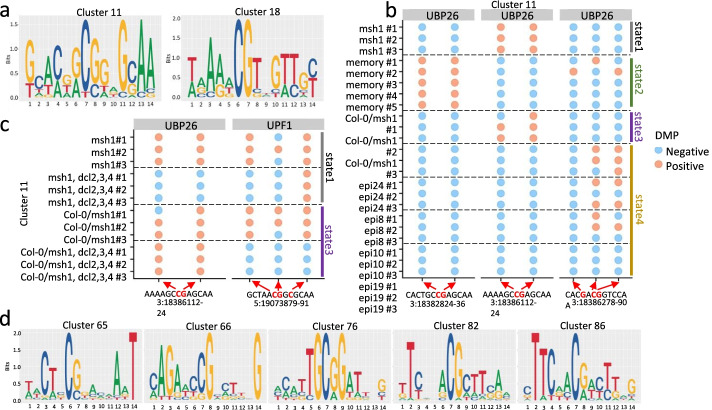
Results: Epigenomic reprogramming is tractable to detailed study and cross-species modeling in the MSH1 system, where perturbation of the plant-specific gene MSH1 triggers at least four distinct nongenetic states to impact plant stress response and growth vigor. Within this system, we have defined RdDM target loci toward decoding phenotype-relevant methylome data. We analyze intragenic methylome repatterning associated with phenotype transitions, identifying state-specific cytosine methylation changes in pivotal growth-versus-stress, chromatin remodeling, and RNA spliceosome gene networks that encompass 871 genes. Over 77% of these genes, and 81% of their central network hubs, are functionally confirmed as RdDM targets based on analysis of mutant datasets and sRNA cluster associations. These dcl2/dcl3/dcl4-sensitive gene methylation sites, many present as singular cytosines, reside within identifiable sequence motifs. These data reflect intragenic methylation repatterning that is targeted and amenable to prediction.

Conclusions: A prevailing assumption that biologically relevant DNA methylation variation occurs predominantly in density-defined differentially methylated regions overlooks behavioral features of intragenic, single-site cytosine methylation variation. RdDM-dependent methylation changes within identifiable sequence motifs reveal gene hubs within networks discriminating stress response and growth vigor epigenetic phenotypes. This study uncovers components of a methylome "code" for de novo intragenic methylation repatterning during plant phenotype transitions.

Keywords: DNA methylation; Epigenetic; Phenotypic plasticity; Stress response; Vigor; sRNA.


Conflict of interest statement

S. Mackenzie is a co-founder for EpiCrop Technologies Inc, a small start-up company that investigates the MSH1 system in an agricultural context.

Figures

Fig. 1
Fig. 1
The msh1 system is composed of four msh1-derived epigenetic states. In Arabidopsis, four distinct plant states originate from MSH1 knockdown or knockout. States 1 and 2 derive directly from msh1 disruption, resulting in highly stress-responsive phenotypes. State 1 at short daylength is variable, including a low-frequency “perennial-like” phenotype [16]. States 3 and 4 involve interaction of msh1-modified and naïve (wild type) genomes through grafting or crossing, resulting in growth vigor phenotypes. Genetic evidence of RdDM dependence is indicated at relevant transitions in gray shading
Fig 2
Fig 2
Characteristics of epi-lines derived by crossing msh1 T-DNA mutant with isogenic wild type. a The phenotypes of different epi-line F3 populations at 34 DAP. The lines derive from WT x msh1 crosses, with Epi 24 and Epi 8 from one parental cross, and Epi 10 and Epi 19 from a second parental cross. b Total leaf area (34 DAP), c, days to bolting, and d, seed weight (mg) are shown for the four populations along with WT control. b–d Bars represent means ± SE. The Mann–Whitney U-test with two-sided alternative hypothesis was used to test significance of the difference of mean between each Epi F3 population and WT control. e Root phenotype of the four different Epi F3 populations grown in sand (33 DAP). f Total leaf area (33 DAP), dry leaf weight (mg), and dry root weight (mg) are shown for the four populations grown on sand along with WT control. f–h Bars represent means ± SE. The Mann–Whitney U-test with two-sided alternative hypothesis was used to test significance of the difference of mean between each Epi F3 population and WT control. Significance codes: *p < 0.05, **p < 0.01, ***p < 0.001, ns – not significant
Fig. 3
Fig. 3
Reversion phenotype in Arabidopsis. a Plant growth phenotype of three F3 epi-line populations, Epi 10 derived by crossing to msh1 T-DNA mutant, and Epi 6 and Epi 9 derived by crossing to msh1 memory line. Dashed circles indicate putative revertants. Col-0 wild type and msh1 memory are shown as controls. b Principal component analysis-linear discriminant analysis of methylome data from three epi-line (non-revertant) and three revertant full-sib F3 (state 4) progeny compared to three independently derived msh1 memory (state 2) plants
Fig. 4
Fig. 4
Discrimination of methylation repatterning among different msh1 states. a Hierarchical clustering results with genic methylome data from three different msh1 states in Arabidopsis: msh1 null mutant (state 1), Col-0/Col-0msh1 graft progeny (state 3), Epi F3 populations (state 4), and relevant Col-0 controls. b Hierarchical clustering results with TE DMP data from the same Arabidopsis datasets presented in panel a. Individuals were represented as vectors of the sum of Hellinger divergences (HD) at DMP positions within gene regions (a) or TE regions (b). The hierarchical clustering was built using Ward agglomeration method, and Hellinger divergence (HD) was computed by using the centroid of corresponding wild type samples. HD formula is reported elsewhere [21]
Fig. 5
Fig. 5
Significant enriched GO pathways by DMG and DEG analysis in epi-lines. a Enriched GO pathways shared by the four epi-lines in Arabidopsis as well as by F1 hybrid DMGs from the C24 x Ler cross by our analysis. Original methylation data for the F1 hybrid were previously reported [22]. Heat map was generated using the fold enrichment of GO terms (FDR < 0.05) common between all four epi-lines. Blue arrows indicate pathways likely contributing to epigenetic change and red arrows indicate pathways likely associated with plant developmental changes. Complete list of GO terms is available in  Extended Data 2 and 3. b Enriched GO pathways from DEGs (FDR<0.05) shared by Epi 8 and Epi 24 floral stem tissues. Heat map displays the fold enrichment of GO terms (FDR < 0.05) common between both the epi-lines. Complete list of GO terms is available in Extended Data 4. DAVID GO (version 6.8) [23] was used for GO enrichment analysis. GO terms with EASE score (a modified Fisher exact P-value) < 0.05 were used for FDR calculation. FDR was calculated using package stats (version 3.6.0; p.adjust method = FDR) in R. Package ggplot2 (version 3.3.3) in R was used to generate heatmap
Fig. 6
Fig. 6
PPI hubs derived from subsets of network-related DMGs and DEGs in Epi 8 and Epi 24. Epi 8 and Epi 24 represent progeny lines derived from the same cross, with Epi 8 displaying enhanced vegetative growth rate and Epi 24 significantly enhanced seed yield. The main subnetwork of hubs was obtained with the application of machine learning k-means clustering on the set of 3647 (Epi 8, panel a) and 3523 (Epi 24, panel b) network-related DMGs and DEGs (p < 0.1) identified in the Arabidopsis epi-line vs WT comparison. The analyses yielded 153 (a) and 346 (b) hub genes to form a closely related subnetwork. GO network enrichment analysis from the string application in Cytoscape [27] was used to identify enriched gene function pathways (FDR < 0.05) within the network. Blue represents DMGs, green represents DEGs, and magenta represents both DMGs and DEGs. Size of each node is proportional to its value of node degree and label font size is proportional to its betweenness centrality
Fig. 7
Fig. 7
The relationship of 871 core hub genes to msh1-derived states and biologically meaningful core networks. a Venn diagram of Arabidopsis DMGs identified from four different msh1-derived states (Col-0 genetic background): msh1 mutant (state 1), msh1 memory (state 2), graft progeny (HEG, state 3), and epi-line (Epi 24, state 4). b An overview of the PPI networks and individual 871 core hub genes. Blue represents DMGs, orange represents the DMGs that are dcl2/dcl3/dcl4-sensitive in graft progeny contrasting mutant rootstock analyses. c Hierarchical clustering of individual plant datasets from four different msh1-derived states based on the sum of Bayesian methylation level difference of DMPs over the 871 core genes from panel a. The hierarchical clustering was built using Ward agglomeration method. The Bayesian methylation level difference was computed as described previously [18]. d Main subnetwork of hubs obtained with the application of a machine learning k-means clustering algorithm on the set of 871 core genes from panel a. GO network enrichment analysis from the string application in Cytoscape [27] was used to identify enriched gene function pathways (FDR < 0.05) within the network. In total, 67 genes involved in enriched networks were identified. Blue nodes represent DMGs, with orange representing the DMGs that are dcl2/dcl3/dcl4-dependent in graft progeny contrasting mutant rootstock analysis. This 67-gene set supplied the RdDM candidate target genes for further study. Blue gene text represents DMGs proximal to only TE sequences, red text designates genes that are proximal to only sRNA clusters, and black text represents genes proximal to both TE and sRNA clusters. For both b and d, the size of each node is proportional to its value of node degree and the label font size is proportional to its betweenness centrality
Fig. 8
Fig. 8
Investigation of methylation repatterning within candidate RdDM target genes that discriminate msh1-derived states. a Two of the putative cluster motifs identified based on differential gene methylation across four msh1-derived states. Hierarchical clustering on a set of 14-bp regions encompassing DMPs from seven (TOR, SYD, NRPB1, NRPD1, UBP26, SUVR5, UPF1) of the 67 core hub loci followed by DNA multiple sequence alignment of each cluster permitted the identification of methylation motifs (see “Methods” for more detail). b Difference of methylation levels on gene body DMPs within motif cluster 11 in the putative RdDM target gene UBP26. Variations on motif methylation repatterning at DMPs are shown with chromosome and position. Individual detected methylation changes are shown as color-coded dots for each plant assayed in each msh1 state, with positive (orange) indicating DMP and negative (blue) for no detected methylation change. Each line represents a single plant dataset. c Sample DMPs within motif cluster 11 in UBP26 and UPF1 that show dcl2/dcl3/dcl4-sensitivity in graft rootstock (state 1) and graft progeny (state 3) from contrasted mutant rootstock experiments. Note that dcl2/dcl3/dcl4 effects can only be assayed for msh1 and graft progeny data. All data associated with the seven genes in this figure are shown in Extended data 7. d Sample putative cluster motifs identified based on differential gene methylation across four msh1-derived states in analyses of the 67 core hub loci followed by DNA multiple sequence alignment of each cluster for methylation motifs. A complete data report for motifs identified based on all 67 genes is shown in Additional file 8

Similar articles

Cited by

References

    1. Gunn CR, Dennis JV. World Guide to Tropical Drift Seeds and Fruits. NY: Quadrangle/New York Times Book Co; 1976.
    1. Joseph B, Corwin JA, Kliebenstein DJ. Genetic variation in the nuclear and organellar genomes modulates stochastic variation in the metabolome, growth, and defense. PLoS Genet. 2015;11:e1004779. doi: 10.1371/journal.pgen.1004779. - DOI - PMC - PubMed
    1. Mackenzie SA, Kundariya H. Organellar protein multifunctionality and phenotypic plasticity in plants. Philos Trans R Soc Lond Ser B Biol Sci. 2020;375:20190182. doi: 10.1098/rstb.2019.0182. - DOI - PMC - PubMed
    1. Balao F, Paun O, Alonso C. Uncovering the contribution of epigenetics to plant phenotypic variation in Mediterranean ecosystems. Plant Biol (Stuttg) 2018;20 Suppl 1:38–49. doi: 10.1111/plb.12594. - DOI - PubMed
    1. Lämke J, Bäurle I. Epigenetic and chromatin-based mechanisms in environmental stress adaptation and stress memory in plants. Genome Biol. 2017;18:124. doi: 10.1186/s13059-017-1263-6. - DOI - PMC - PubMed

Publication types

MeSH terms

LinkOut - more resources