. 2022 Nov 14;3(6):100416.
doi: 10.1016/j.xplc.2022.100416. Epub 2022 Aug 4.

A Phytochrome B-PIF4-MYC2/MYC4 module inhibits secondary cell wall thickening in response to shaded light

Affiliations

A Phytochrome B-PIF4-MYC2/MYC4 module inhibits secondary cell wall thickening in response to shaded light

Fang Luo et al. Plant Commun. .

Abstract

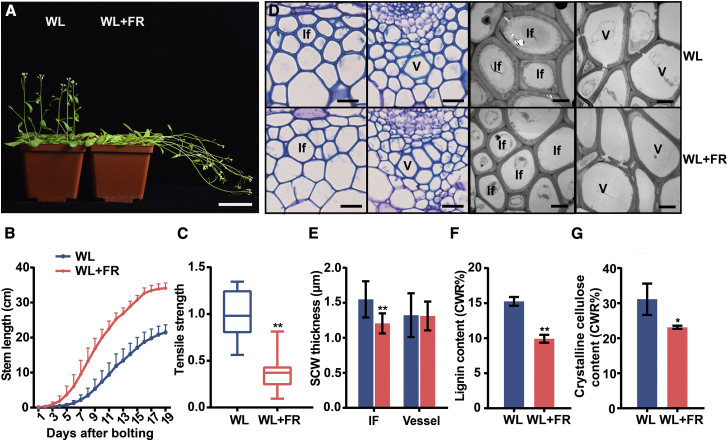
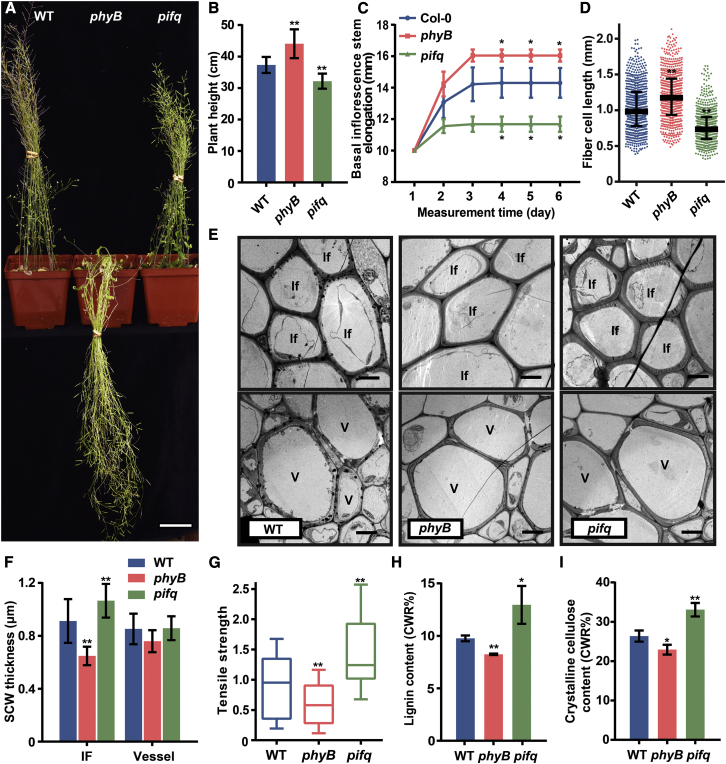
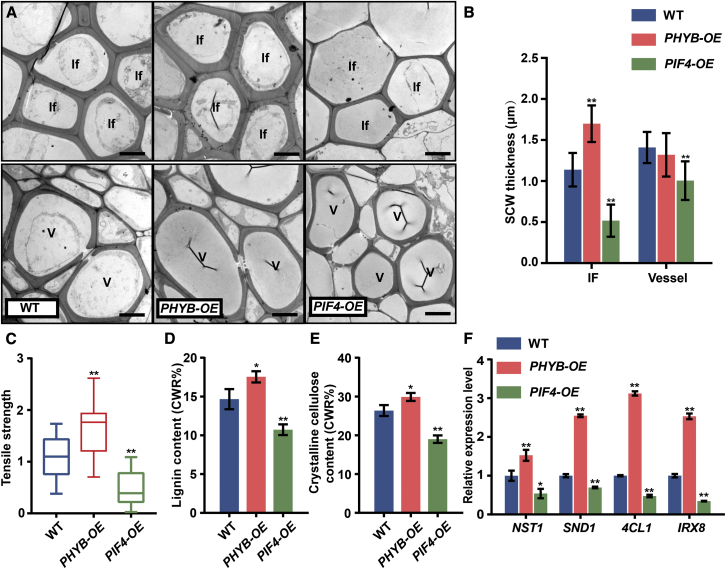
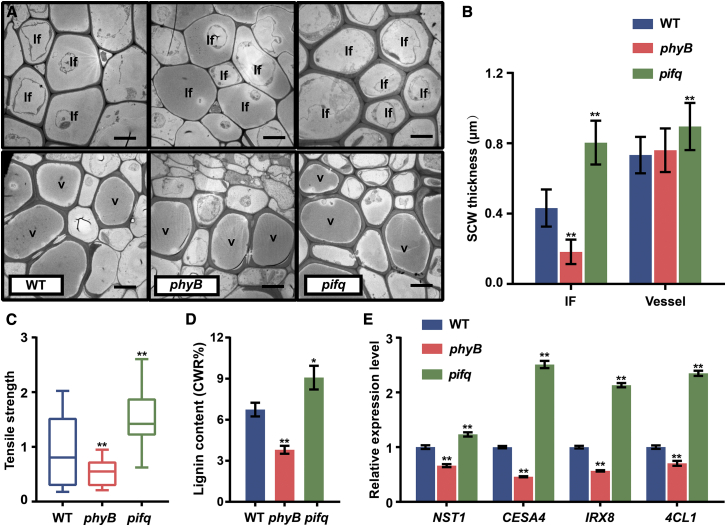
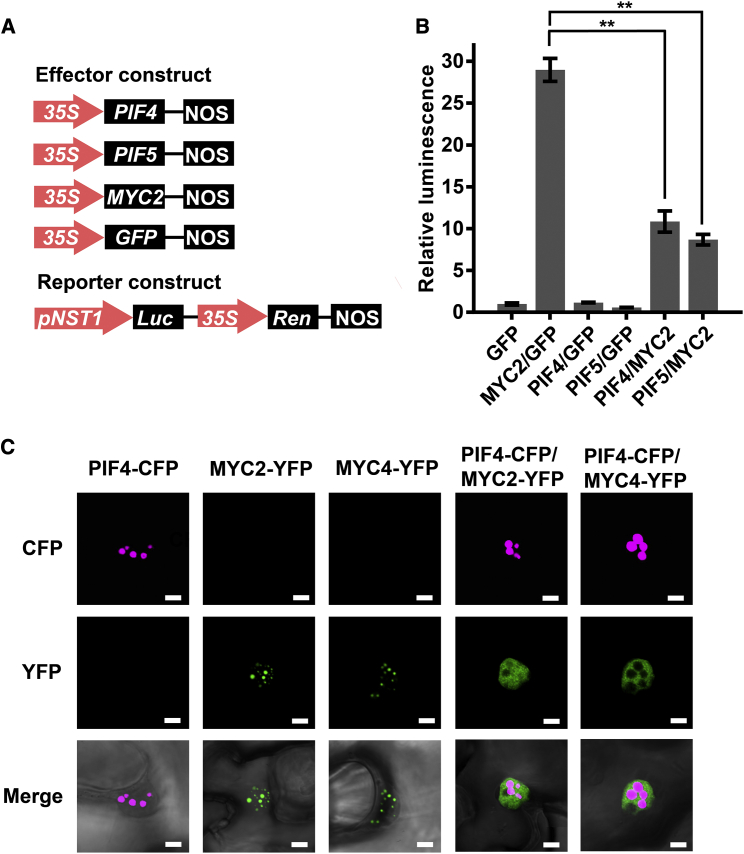
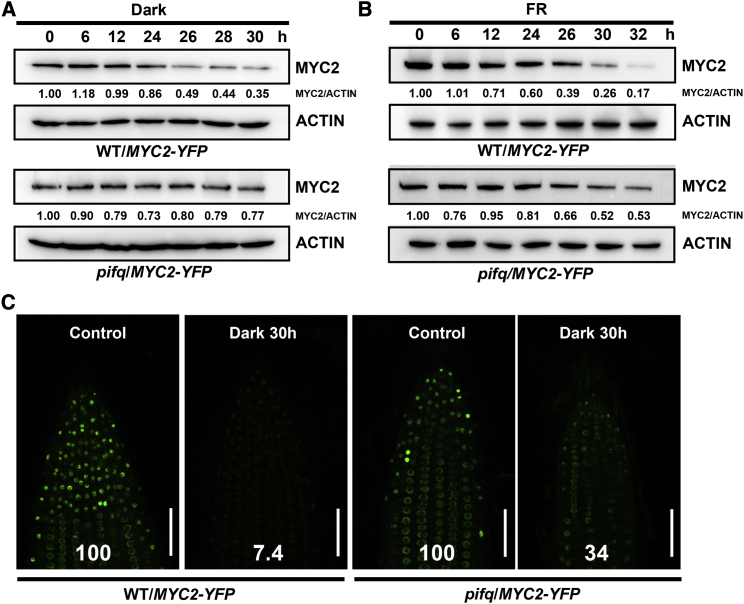
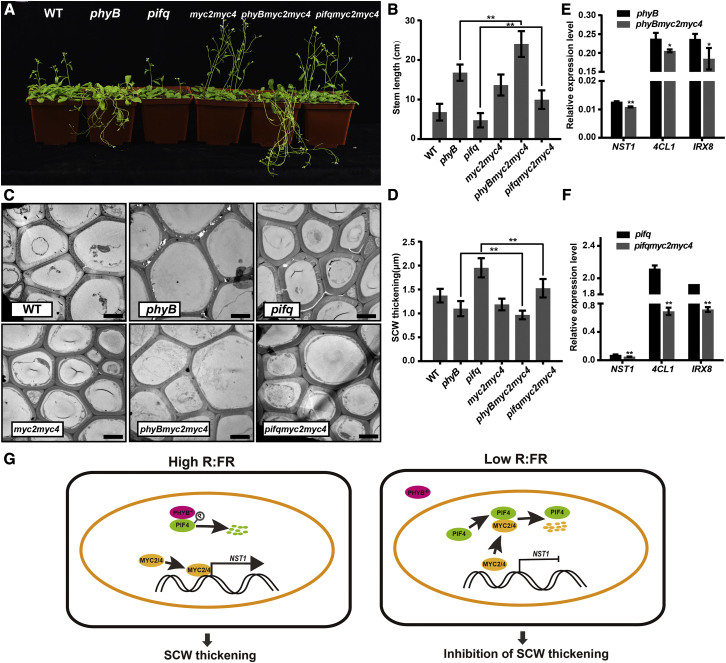
Secondary cell walls (SCWs) in stem cells provide mechanical strength and structural support for growth. SCW thickening varies under different light conditions. Our previous study revealed that blue light enhances SCW thickening through the redundant function of MYC2 and MYC4 directed by CRYPTOCHROME1 (CRY1) signaling in fiber cells of the Arabidopsis inflorescence stem. In this study, we find that the Arabidopsis PHYTOCHROME B mutant phyB displays thinner SCWs in stem fibers, but thicker SCWs are deposited in the PHYTOCHROME INTERACTING FACTOR (PIF) quadruple mutant pif1pif3pif4pif5 (pifq). The shaded light condition with a low ratio of red to far-red light inhibits stem SCW thickening. PIF4 interacts with MYC2 and MYC4 to affect their localization in nuclei, and this interaction results in inhibition of the MYCs' transactivation activity on the NST1 promoter. Genetic evidence shows that regulation of SCW thickening by PIFs is dependent on MYC2/MYC4 function. Together, the results of this study reveal a PHYB-PIF4-MYC2/MYC4 module that inhibits SCW thickening in fiber cells of the Arabidopsis stem.

Keywords: MYC2; far-red light; fiber cell; secondary cell wall; xylem.


Figures

Figure 1
Figure 1
Shaded light inhibits SCW thickening in the inflorescence stem. (A) Growth of Arabidopsis inflorescence stems in white-light (WL) and WL + far-red conditions. FR, far red. Scale bar, 5 cm. (B) Elongation of inflorescence stems in WL and WL + far-red conditions during growth. n = 9, mean ± SD. (C) Tensile strength of inflorescence stems; the WT stem tensile strength was set to 1. Student’s t-test (∗∗P < 0.01) was used for statistical analysis, n = 18, mean ± SD. (D) Cross sections of the inflorescence stem grown under different light conditions (WL and WL + far red) visualized under a light microscope (after toluidine blue staining; left panels) and a transmission electron microscope (right panels). If, interfascicular fiber cell; V, vessel cell. Left: scale bar, 20 μm; right: scale bar, 5 μm. (E) Measurements of SCW thickness in the interfascicular fiber cells in (D). There were three biological replicates, and more than 10 cells were measured per biological replicate. Student’s t-test (∗∗P < 0.01) was used for statistical analysis, mean ± SD. (F) Lignin content in inflorescence stems of plants grown in different R:FR conditions. Student’s t-test (∗P < 0.05) was used for statistical analyses, n = 3, mean ± SD. (G) Crystalline cellulose content in inflorescence stems of plants grown in different R:FR conditions. Student’s t-test (∗P < 0.05) was used for statistical analyses, n = 3, mean ± SD.
Figure 2
Figure 2
PHYB and PIFs regulate SCW thickening in fiber cells. (A) Plants were grown in WL at 8 weeks of age. Scale bar, 5 cm. (B) Measurements of plant height in (A). Student’s t-test (∗∗P < 0.01) was used for statistical analyses, n = 20, mean ± SD. (C) Inflorescence stem elongation. The stem was marked with two points at the basal region, and the distance between the two points was measured every day during growth. Student’s t-test (∗P < 0.05) was used for statistical analyses, n = 3, mean ± SD. (D) Fiber cell length measured in disaggregated fiber cells. Data were collected from three biological replicates, and more than 200 cells were measured per biological replicate. Student’s t-test (∗∗P < 0.01) was used for statistical analysis, mean ± SD. (E) Transmission electron micrographs of inflorescence stem cross sections. If, interfascicular fiber cell; V, vessel cell. Scale bar, 5 μm. (F) Measurements of SCW thickness in the interfascicular fiber cells and vessel cells in (E). Data were collected from three biological replicates, and more than five cells were measured per biological replicate. Student’s t-test (∗∗P < 0.01) was used for statistical analysis, mean ± SD. (G) Tensile strength measurements of the inflorescence stem; the WT stem tensile strength was set to 1. Student’s t-test (∗∗P < 0.01) was used for statistical analysis, n = 16, mean ± SD. (H) Lignin content in inflorescence stems. Student’s t-test (∗∗P < 0.01, ∗P < 0.05) was used for statistical analyses, n = 3, mean ± SD. (I) Crystalline cellulose content in inflorescence stems. Student’s t-test (∗∗P < 0.01, ∗P < 0.05) was used for statistical analyses, n = 3, mean ± SD.
Figure 3
Figure 3
SCW phenotypes of PHYB-OE and PIF4-OE plants. (A) Transmission electron micrographs of inflorescence stem cross sections of plants grown in WL. If, interfascicular fiber cell; V, vessel cells. Scale bar, 5 μm. (B) Measurements of SCW thickness of cells in (A). Data were collected from three biological replicates, and more than 10 cells were measured per biological replicate. Student’s t-test (∗∗P < 0.01) was used for statistical analysis, mean ± SD. (C) Tensile strength of inflorescence stems; the WT stem tensile strength was set to 1. Student’s t-test (∗∗P < 0.01) was used for statistical analysis, n = 15, mean ± SD. (D) Lignin content in inflorescence stems. Student’s t-test (∗P < 0.05) was used for statistical analyses, n = 3, mean ± SD. (E) Cellulose content in inflorescence stems. Student’s t-test (∗∗P < 0.01, ∗P < 0.05) was used for statistical analyses, n = 3, mean ± SD. (F) Expression of SCW regulatory (NST1 and SND1) and biosynthesis-related (4CL1 and IRX8) genes in different genotypes grown under WL. Three biological replicates were performed. Student’s t-test (∗∗P < 0.01, ∗P < 0.05) was used for statistical analysis, mean ± SD.
Figure 4
Figure 4
Red-light signaling regulates SCW thickening, dependent on PHYB and PIFs. (A) The inflorescence stems of phyB and pifq mutants were grown under red light (high R:FR) and anatomically analyzed. Transmission electron micrographs of the inflorescence stem cross sections are shown. If, interfascicular fiber cell; V, vessel. Scale bar, 5 μm. (B) Statistics of SCW thickness in (A). Data were collected from three biological replicates, and more than 10 cells were measured per biological replicate. Student’s t-test (∗∗P < 0.01) was used for statistical analysis, mean ± SD. (C) Tensile strength of the inflorescence stem; the WT stem tensile strength was set to 1. Student’s t-test (∗∗P < 0.01) was used for statistical analysis, n = 20, mean ± SD. (D) Lignin content in the inflorescence stem. Student’s t-test (∗∗P < 0.01, ∗P < 0.05) was used for statistical analyses, n = 3, mean ± SD. (E) Expression of SCW regulatory (NST1) and biosynthesis-related (CESA4, 4CL1, and IRX8) genes was measured by qRT-PCR analysis. Analysis was performed on three biological replicates. Student’s t-test (∗∗P < 0.01) was used for statistical analysis, mean ± SD.
Figure 5
Figure 5
PIF4 represses MYC2 transcriptional activity. (A) Schematic representation of the NST1 promoter-driven dual-LUC reporter gene and three effector gene constructs. 35S promoter, NST1 promoter (−1 to −3711 bp from ATG), Renilla luciferase (REN), and firefly luciferase (LUC) are indicated in reporter constructs. In effector constructs, PIF4, PIF5, and MYC2 are driven by the 35S promoter. (B) PIF4/PIF5 inhibit MYC2 activation of the NST1 promoter. Arabidopsis protoplasts were transfected with the reporter constructs in combination with different effector constructs. After transfection, the protoplasts were kept in the dark for 16 h. Relative luminescence was normalized to that of protoplasts transformed with the reporter and empty effector (GFP). Tukey’s honestly significant difference (HSD) test (∗∗P < 0.01) was used for statistical analysis, n = 3, mean ± SD. (C) Subcellular localization of PIF4 and MYC2/MYC4. Constructs of PIF4-CFP, MYC2-YFP, and MYC4-YFP were transferred to tobacco leaves, separately or together, by agroinfiltration. The tobacco leaves were then kept in the dark for 12 h before fluorescence observation. Scale bar, 5 μm.
Figure 6
Figure 6
PIF4 affects MYC2 stability in the dark and in far-red light. MYC2 stability was examined in the WT and pifq backgrounds. (A) Transgenic plants (WT/MYC2-YFP and pifq/MYC2-YFP) were grown in WL conditions for 10 days and then exposed to dark conditions. MYC2 and ACTIN were immunoblotted. Normalized MYC2 abundance relative to ACTIN is shown as MYC2/ACTIN. (B) Transgenic plants (WT/MYC2-YFP and pifq/MYC2-YFP) were grown in WL conditions for 10 days and then exposed to far-red light. MYC2 and ACTIN were immunoblotted. Normalized MYC2 abundance relative to ACTIN is shown as MYC2/ACTIN. (C) Transgenic plants (WT/MYC2-YFP and pifq/MYC2-YFP) were grown in WL conditions for 4 days and then treated with/without darkness for 30 h. YFP fluorescence was observed in the root tip, and the relative change in signal intensity was quantified. Scale bar, 50 μm.
Figure 7
Figure 7
MYC2/MYC4 genetically interact with PIFs. (A) Mutant plants (phyB, pifq, myc2myc4, phyBmyc2myc4, pifqmyc2myc4) were grown in WL until 4 weeks of age. Scale bar, 5 cm. (B) Inflorescence stem length in various mutants. Tukey’s HSD test (∗∗P < 0.01) was used for statistical analysis, n > 10, mean ± SD. (C) Transmission electron micrographs of stem cross sections showing interfascicular fiber cells. Scale bar, 5 μm. (D) Statistics of SCW thickness in interfascicular fiber cells in (C). Data were collected from three biological replicates, and more than 10 cells were measured per biological replicate. Tukey’s HSD test (∗∗P < 0.01) was used for statistical analysis, mean ± SD. (E and F) Expression of the key SCW regulatory (NST1) and biosynthesis-related (4CL1 and IRX8) genes in mutant plants. Analysis was performed on three biological replicates. Student’s t-test (∗∗P < 0.01, ∗P < 0.05) was used for statistical analysis, mean ± SD. (G) WL enhances SCW thickening in fiber cells of the inflorescence stem. Under WL (high R:FR), PHYB is activated to its Pfr form, which enters the nucleus to inhibit PIF activity, and MYC2 is available to bind to the NST1 promoter to activate the NST1-directed SCW thickening process. In the shade (low R:FR), PHYB reverts to its inactive Pr form. PHYB cannot enter the nucleus, and PIF proteins interact with MYC2, displacing its binding to the NST1 promoter. Thus, the NST1-directed SCW thickening process is suppressed.

Similar articles

Cited by

References

    1. Al-Sady B., Ni W., Kircher S., Schäfer E., Quail P.H. Photoactivated phytochrome induces rapid PIF3 phosphorylation prior to proteasome-mediated degradation. Mol. Cell. 2006;23:439–446. doi: 10.1016/j.molcel.2006.06.011. - DOI - PubMed
    1. Bauer D., Viczián A., Kircher S., Nobis T., Nitschke R., Kunkel T., Panigrahi K.C.S., Adám E., Fejes E., Schäfer E., et al. Constitutive photomorphogenesis 1 and multiple photoreceptors control degradation of phytochrome interacting factor 3, a transcription factor required for light signaling in Arabidopsis. Plant Cell. 2004;16:1433–1445. doi: 10.1105/tpc.021568. - DOI - PMC - PubMed
    1. Casal J.J. Shade avoidance. Arabidopsis Book. 2012;10:e0157. doi: 10.1199/tab.0157. - DOI - PMC - PubMed
    1. Chen M., Tao Y., Lim J., Shaw A., Chory J. Regulation of phytochrome B nuclear localization through light-dependent unmasking of nuclear-localization signals. Curr. Biol. 2005;15:637–642. doi: 10.1016/j.cub.2005.02.028. - DOI - PubMed
    1. Chen R., Jiang H., Li L., Zhai Q., Qi L., Zhou W., Liu X., Li H., Zheng W., Sun J., et al. The Arabidopsis mediator subunit MED25 differentially regulates jasmonate and abscisic acid signaling through interacting with the MYC2 and ABI5 transcription factors. Plant Cell. 2012;24:2898–2916. doi: 10.1105/tpc.112.098277. - DOI - PMC - PubMed

Publication types

MeSH terms

Substances

LinkOut - more resources