

Effects of clot contraction on clot degradation: A mathematical and experimental approach
- PMID: 35927957
- PMCID: PMC9463642
- DOI: 10.1016/j.bpj.2022.07.023
Effects of clot contraction on clot degradation: A mathematical and experimental approach
Abstract
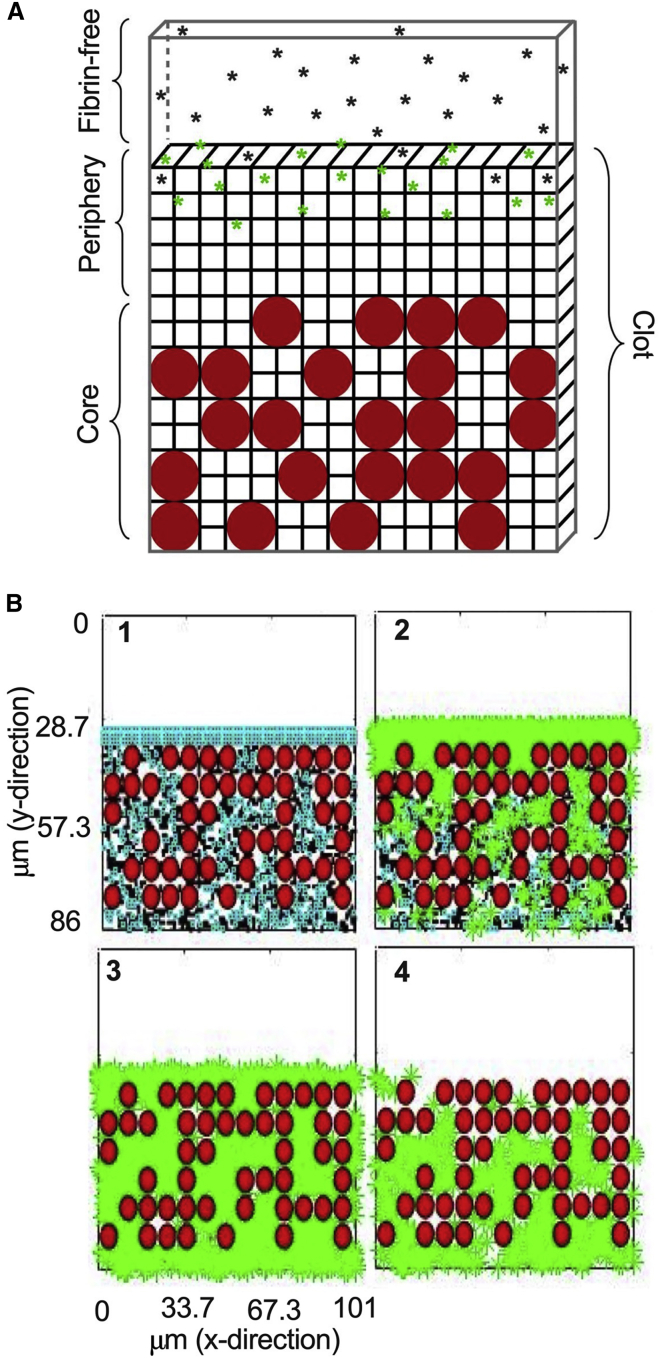
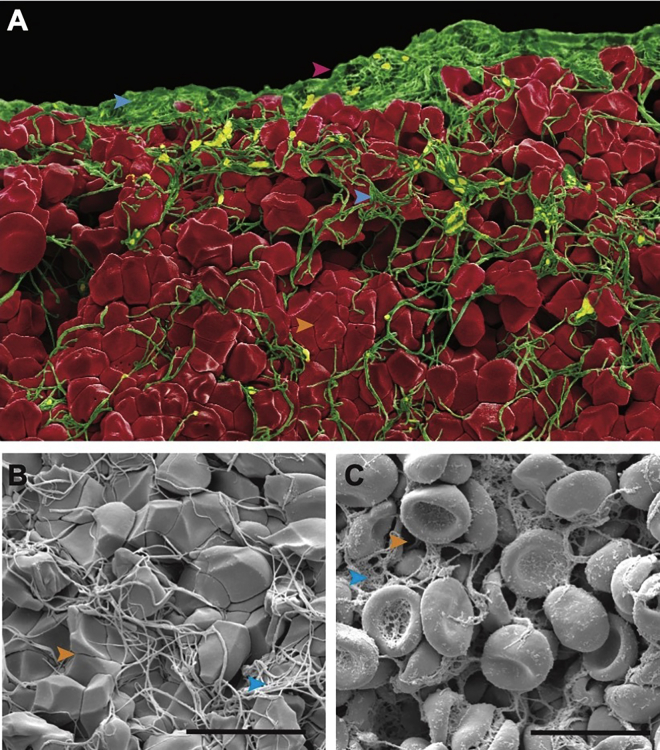
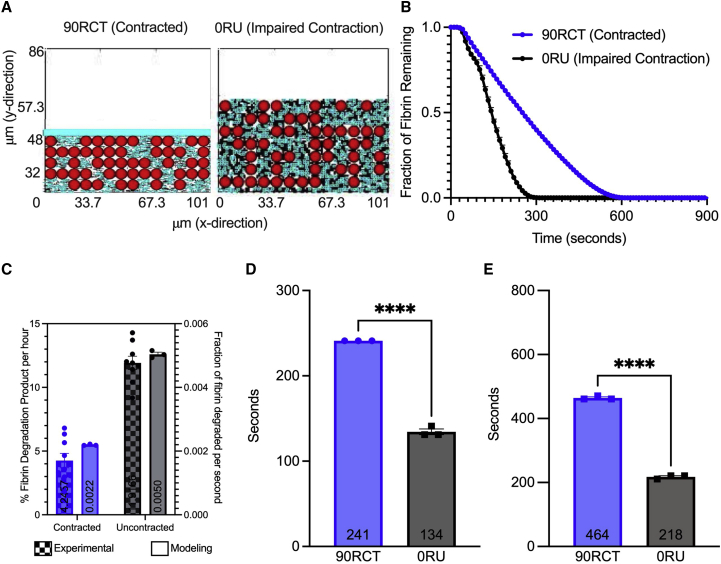
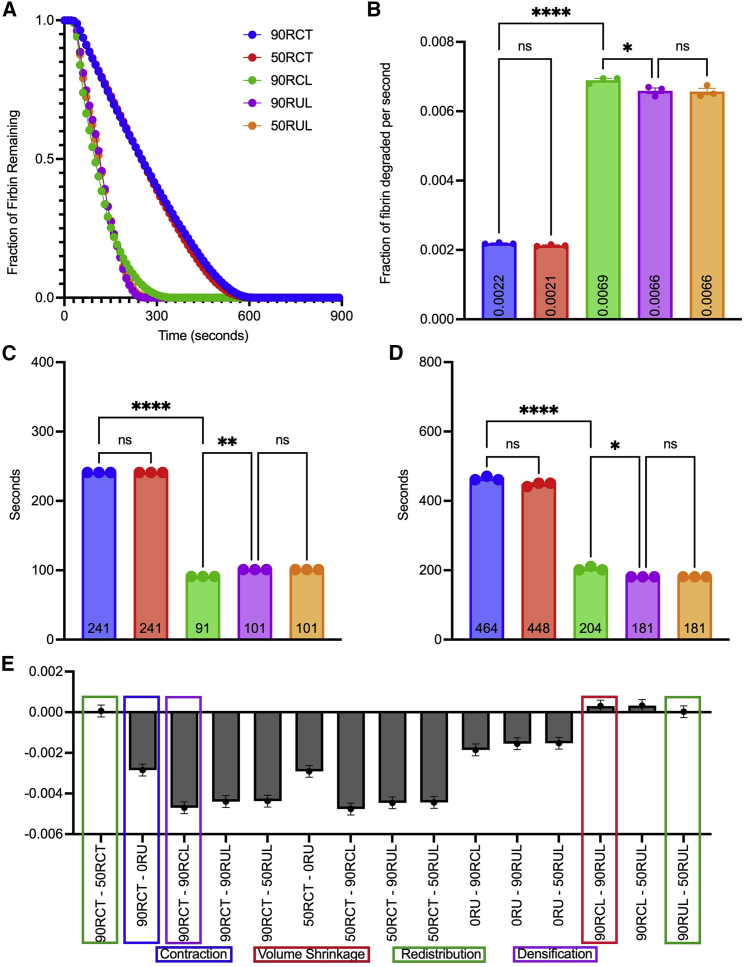
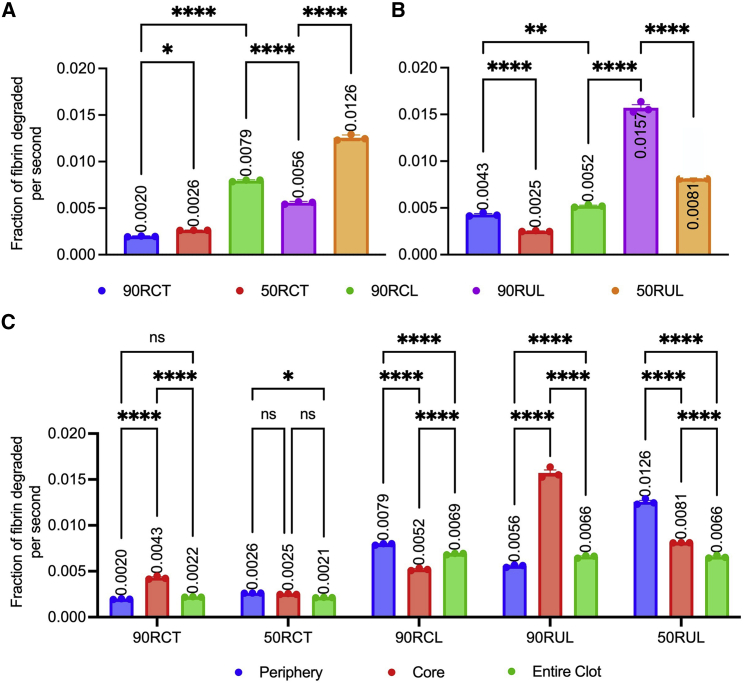
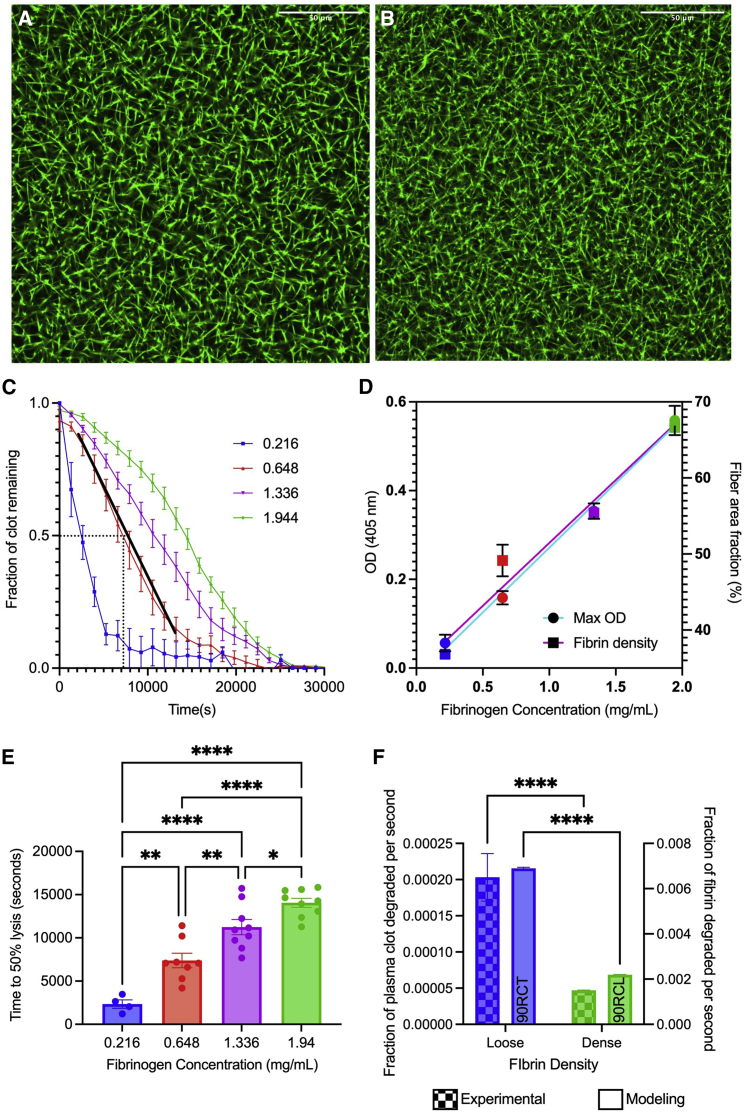
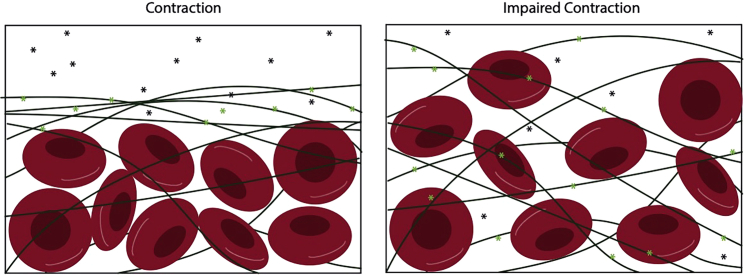
Thrombosis, resulting in occlusive blood clots, blocks blood flow to downstream organs and causes life-threatening conditions such as heart attacks and strokes. The administration of tissue plasminogen activator (t-PA), which drives the enzymatic degradation (fibrinolysis) of these blood clots, is a treatment for thrombotic conditions, but the use of these therapeutics is often limited due to the time-dependent nature of treatment and their limited success. We have shown that clot contraction, which is altered in prothrombotic conditions, influences the efficacy of fibrinolysis. Clot contraction results in the volume shrinkage of blood clots, with the redistribution and densification of fibrin and platelets on the exterior of the clot and red blood cells in the interior. Understanding how these key structural changes influence fibrinolysis can lead to improved diagnostics and patient care. We used a combination of mathematical modeling and experimental methodologies to characterize the process of exogenous delivery of t-PA (external fibrinolysis). A three-dimensional (3D) stochastic, multiscale model of external fibrinolysis was used to determine how the structural changes that occur during the process of clot contraction influence the mechanism(s) of fibrinolysis. Experiments were performed based on modeling predictions using pooled human plasma and the external delivery of t-PA to initiate lysis. Analysis of fibrinolysis simulations and experiments indicate that fibrin densification makes the most significant contribution to the rate of fibrinolysis compared with the distribution of components and degree of compaction (p < 0.0001). This result suggests the possibility of a certain fibrin density threshold above which t-PA effective diffusion is limited. From a clinical perspective, this information can be used to improve on current therapeutics by optimizing timing and delivery of lysis agents.
Copyright © 2022 Biophysical Society. Published by Elsevier Inc. All rights reserved.
Conflict of interest statement
Declaration of interests The authors state that they have no conflict of interests.
Figures
Similar articles
-
Blood clot contraction differentially modulates internal and external fibrinolysis.J Thromb Haemost. 2019 Feb;17(2):361-370. doi: 10.1111/jth.14370. Epub 2019 Feb 6. J Thromb Haemost. 2019. PMID: 30582674
-
Modelling fibrinolysis: a 3D stochastic multiscale model.Math Med Biol. 2014 Mar;31(1):17-44. doi: 10.1093/imammb/dqs029. Epub 2012 Dec 4. Math Med Biol. 2014. PMID: 23220403 Free PMC article.
-
Inhibition of clot lysis and decreased binding of tissue-type plasminogen activator as a consequence of clot retraction.Blood. 1992 Mar 15;79(6):1420-7. Blood. 1992. PMID: 1547340
-
Fibrinolysis: an illustrated review.Res Pract Thromb Haemost. 2023 Feb 17;7(2):100081. doi: 10.1016/j.rpth.2023.100081. eCollection 2023 Feb. Res Pract Thromb Haemost. 2023. PMID: 36942151 Free PMC article. Review.
-
The biochemical and physical process of fibrinolysis and effects of clot structure and stability on the lysis rate.Cardiovasc Hematol Agents Med Chem. 2008 Jul;6(3):161-80. doi: 10.2174/187152508784871963. Cardiovasc Hematol Agents Med Chem. 2008. PMID: 18673231 Review.
Cited by
-
DYSREGULATED CLOT MECHANICS AND KINETICS IMPACTED BY INJURY SEVERITY, PREDICT MORTALITY AFTER TRAUMA.Shock. 2025 Apr 1;63(4):587-596. doi: 10.1097/SHK.0000000000002544. Epub 2025 Jan 23. Shock. 2025. PMID: 39847718
-
Clot formation, structure, and fibrinolysis of plasma from pancreatic cancer patients.J Thromb Thrombolysis. 2025 Jul 14. doi: 10.1007/s11239-025-03118-x. Online ahead of print. J Thromb Thrombolysis. 2025. PMID: 40658336
-
Dependence of clot structure and fibrinolysis on apixaban and clotting activator.Res Pract Thromb Haemost. 2024 Oct 29;8(8):102614. doi: 10.1016/j.rpth.2024.102614. eCollection 2024 Nov. Res Pract Thromb Haemost. 2024. PMID: 39687928 Free PMC article.
-
Blood clot contraction: Mechanisms, pathophysiology, and disease.Res Pract Thromb Haemost. 2022 Dec 23;7(1):100023. doi: 10.1016/j.rpth.2022.100023. eCollection 2023 Jan. Res Pract Thromb Haemost. 2022. PMID: 36760777 Free PMC article.
-
Internal fibrinolysis of fibrin clots is driven by pore expansion.Sci Rep. 2024 Feb 1;14(1):2623. doi: 10.1038/s41598-024-52844-4. Sci Rep. 2024. PMID: 38297113 Free PMC article.
References
-
- Glueck C.J., Rorick M.H., et al. Tracy T.M. Hypofibrinolytic and atherogenic risk factors for stroke. J. Lab. Clin. Med. 1995;125:319–325. - PubMed
Publication types
MeSH terms
Substances
Grants and funding
LinkOut - more resources
Full Text Sources
Medical
