Untypical Contrast Normalization Explains the "Weak Outnumber Strong" Numerosity Illusion
- PMID: 35927995
- PMCID: PMC9345179
- DOI: 10.3389/fnhum.2022.923072
Untypical Contrast Normalization Explains the "Weak Outnumber Strong" Numerosity Illusion
Abstract
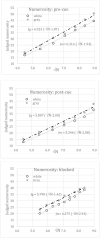
Less salient, lower contrast disks appear to be more numerous than more salient, higher contrast disks when intermingled in equal numbers into the same display (Lei and Reeves, 2018), but they are equal in perceived numerosity when segregated into different displays. Comparative judgements indicate that the apparent numerosity of the lower contrast disks is unaffected by being intermingled with high contrast disks, whereas the high contrast disks are reduced in numerosity by being intermingled with the low contrast ones (Lei and Reeves, 2018). Here, we report that this illusion also occurs for absolute judgements of the numerosities of displays of from 20 to 80 disks. A model based on luminance-difference contrast normalization (LDCN) explains the illusory loss of high-contrast (salient) items along with veridical perception of the low-contrast ones. The model correctly predicts that perceived numerosity is linearly related to the square-root of the number of disks, with the extent of the illusion depending on an attentionally-weighted function of contrast and assimilation.
Keywords: contrast; contrast-dependent numerosity illusion; illusion; model; numerosity perception; segregation.
Copyright © 2022 Lei and Reeves.
Conflict of interest statement
The authors declare that the research was conducted in the absence of any commercial or financial relationships that could be construed as a potential conflict of interest.
Figures


Similar articles
-
When the weaker conquer: A contrast-dependent illusion of visual numerosity.J Vis. 2018 Jul 2;18(7):8. doi: 10.1167/18.7.8. J Vis. 2018. PMID: 30029271
-
Numerosity depends on normalized contrast energy: Review and square-root law model.Vision Res. 2023 Oct;211:108280. doi: 10.1016/j.visres.2023.108280. Epub 2023 Jul 5. Vision Res. 2023. PMID: 37418900
-
How Illusory Is the Solitaire Illusion? Assessing the Degree of Misperception of Numerosity in Adult Humans.Front Psychol. 2016 Oct 27;7:1663. doi: 10.3389/fpsyg.2016.01663. eCollection 2016. Front Psychol. 2016. PMID: 27833577 Free PMC article.
-
The influence of visual illusion perception on numerosity estimation could be evolutionarily conserved: exploring the numerical Delboeuf illusion in humans (Homo sapiens) and fish (Poecilia reticulata).Anim Cogn. 2023 Jun;26(3):823-835. doi: 10.1007/s10071-022-01721-6. Epub 2022 Nov 27. Anim Cogn. 2023. PMID: 36436087
-
Geometrical illusions are not always where you think they are: a review of some classical and less classical illusions, and ways to describe them.Front Hum Neurosci. 2014 Oct 28;8:856. doi: 10.3389/fnhum.2014.00856. eCollection 2014. Front Hum Neurosci. 2014. PMID: 25389400 Free PMC article. Review.
Cited by
-
Implied occlusion and subset underestimation contribute to the weak-outnumber-strong numerosity illusion.J Vis. 2024 Oct 3;24(11):14. doi: 10.1167/jov.24.11.14. J Vis. 2024. PMID: 39417755 Free PMC article.
References
LinkOut - more resources
Full Text Sources

