Phase-dependent Brain Activation of the Frontal and Parietal Regions During Walking After Stroke - An fNIRS Study
- PMID: 35928123
- PMCID: PMC9343616
- DOI: 10.3389/fneur.2022.904722
Phase-dependent Brain Activation of the Frontal and Parietal Regions During Walking After Stroke - An fNIRS Study
Abstract
Background: Recovery of walking post-stroke is highly variable. Accurately measuring and documenting functional brain activation characteristics during walking can help guide rehabilitation. Previous work in this area has been limited to investigations of frontal brain regions and have not utilized recent technological and analytical advances for more accurate measurements. There were three aims for this study: to characterize the hemodynamic profile during walking post-stroke, to investigate regional changes in brain activation during different phases of walking, and to related brain changes to clinical measures.
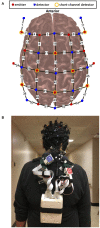
Methods: Functional near-infrared spectroscopy (fNIRS) along the pre-frontal, premotor, sensorimotor, and posterior parietal cortices was used on twenty individuals greater than six months post-stroke. Individual fNIRS optodes were digitized and used to estimate channel locations on each participant and short separation channels were used to control for extracerebral hemodynamic changes. Participants walked at their comfortable pace several times along a hallway while brain activation was recorded. Exploratory cluster analysis was conducted to determine if there was a link between brain activation and clinical measures.
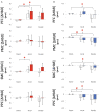
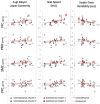
Results: Sustained activation was observed in the pre-frontal cortex with the ipsilesional hemisphere showing greater activation compared to the contralesional side. Sensorimotor cortex was active during the early, acceleration stage of walking only. Posterior parietal cortex showed changes in activation during the later, steady-state stage of walking. Faster gait speeds also related to increased activation in contralesional sensorimotor and posterior parietal cortices. Exploratory analysis clustered participants into two distinct groups based on their brain activation profiles and generally showed that individuals with greater activation tended to have better physical outcomes.
Conclusions: These findings can guide future research for obtaining adequate power and determining factors that can be used as effect modifiers to reduce inter-subject variability. Overall, this is the first study to report specific oxygenated and deoxygenated hemoglobin changes in frontal to parietal regions during walking in the stroke population. Our results shed light on the importance of measuring brain activation across the cortex and show the importance of pre-frontal, sensorimotor, and posterior parietal cortices in walking after a stroke.
Keywords: functional near-infrared spectroscopy (fNIRS); gait; posterior parietal cortex (PPC); pre-frontal cortex (PFC); premotor cortex (PMC); sensorimotor cortex (SMC); stroke.
Copyright © 2022 Lim, Yang, Peters, Liu-Ambrose, Boyd and Eng.
Conflict of interest statement
The authors declare that the research was conducted in the absence of any commercial or financial relationships that could be construed as a potential conflict of interest.
Figures


Similar articles
-
Frontal, Sensorimotor, and Posterior Parietal Regions Are Involved in Dual-Task Walking After Stroke.Front Neurol. 2022 Jun 22;13:904145. doi: 10.3389/fneur.2022.904145. eCollection 2022. Front Neurol. 2022. PMID: 35812105 Free PMC article.
-
Premotor and Posterior Parietal Cortex Activity is Increased for Slow, as well as Fast Walking Poststroke: An fNIRS Study.Neural Plast. 2023 Oct 13;2023:2403175. doi: 10.1155/2023/2403175. eCollection 2023. Neural Plast. 2023. PMID: 37868191 Free PMC article.
-
Passive, yet not inactive: robotic exoskeleton walking increases cortical activation dependent on task.J Neuroeng Rehabil. 2020 Aug 10;17(1):107. doi: 10.1186/s12984-020-00739-6. J Neuroeng Rehabil. 2020. PMID: 32778109 Free PMC article.
-
Brain activity during real-time walking and with walking interventions after stroke: a systematic review.J Neuroeng Rehabil. 2021 Jan 15;18(1):8. doi: 10.1186/s12984-020-00797-w. J Neuroeng Rehabil. 2021. PMID: 33451346 Free PMC article.
-
[Clinical application of functional near-infrared spectroscopy in rehabilitation medicine].Brain Nerve. 2010 Feb;62(2):125-32. Brain Nerve. 2010. PMID: 20192032 Review. Japanese.
Cited by
-
How aging impacts cortical dynamics and gait during dual-task turning revealed by fNIRS.Geroscience. 2025 May 23. doi: 10.1007/s11357-025-01687-6. Online ahead of print. Geroscience. 2025. PMID: 40410646
-
Functional Near-Infrared Spectroscopy in neurodegenerative disease: a review.Front Neurosci. 2024 Oct 2;18:1469903. doi: 10.3389/fnins.2024.1469903. eCollection 2024. Front Neurosci. 2024. PMID: 39416953 Free PMC article. Review.
-
Auditory Cue Effects on Gait-Phase-Dependent Electroencephalogram (EEG) Modulations during Overground and Treadmill Walking.Sensors (Basel). 2024 Feb 28;24(5):1548. doi: 10.3390/s24051548. Sensors (Basel). 2024. PMID: 38475084 Free PMC article. Clinical Trial.
-
Frontal and parietal cortices activation during walking is repeatable in older adults based on fNIRS.Heliyon. 2024 May 1;10(9):e30197. doi: 10.1016/j.heliyon.2024.e30197. eCollection 2024 May 15. Heliyon. 2024. PMID: 38756562 Free PMC article.
-
Altered neural recruitment during single and dual tasks in athletes with repeat concussion.Front Hum Neurosci. 2024 Dec 11;18:1515514. doi: 10.3389/fnhum.2024.1515514. eCollection 2024. Front Hum Neurosci. 2024. PMID: 39723417 Free PMC article.
References
LinkOut - more resources
Full Text Sources
Miscellaneous

