

Neighborhood Disadvantage Associated With Blunted Amygdala Reactivity to Predictable and Unpredictable Threat in a Community Sample of Youth
- PMID: 35928141
- PMCID: PMC9348572
- DOI: 10.1016/j.bpsgos.2022.03.006
Neighborhood Disadvantage Associated With Blunted Amygdala Reactivity to Predictable and Unpredictable Threat in a Community Sample of Youth
Abstract
Background: Childhood socioeconomic disadvantage is a form of adversity associated with alterations in critical frontolimbic circuits involved in the pathophysiology of psychiatric disorders. Most work has focused on individual-level socioeconomic position, yet individuals living in deprived communities typically encounter additional environmental stressors that have unique effects on the brain and health outcomes. Notably, chronic and unpredictable stressors experienced in the everyday lives of youth living in disadvantaged neighborhoods may impact neural responsivity to uncertain threat.
Methods: A community sample of children (N = 254) ages 8 to 15 years (mean = 12.15) completed a picture anticipation task during a functional magnetic resonance imaging scan, during which neutral and negatively valenced photos were presented in a temporally predictable or unpredictable manner. Area Deprivation Index (ADI) scores were derived from participants' home addresses as an index of relative neighborhood disadvantage. Voxelwise analyses examined interactions of ADI, valence, and predictability on neural response to picture presentation.
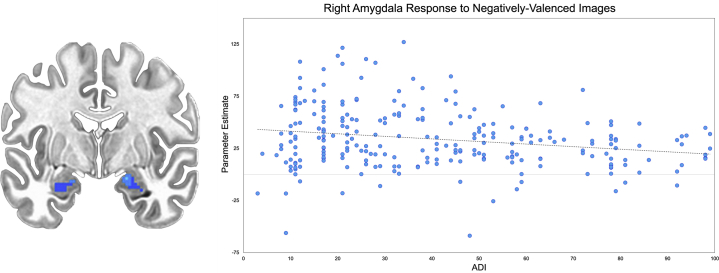
Results: There was a significant ADI × valence interaction in the middle temporal gyrus, anterior cingulate cortex, hippocampus, and amygdala. Higher ADI was associated with less amygdala activation to negatively valenced images. ADI also interacted with predictability. Higher ADI was associated with greater activation of lingual and calcarine gyri for unpredictably presented stimuli. There was no three-way interaction of ADI, valence, and predictability.
Conclusions: Neighborhood disadvantage may impact how the brain perceives and responds to potential threats. Future longitudinal work is critical for delineating how such effects may persist across the life span and how health outcomes may be modifiable with community-based interventions and policies.
Figures


Similar articles
-
Neighborhood Socioeconomic Disadvantage and the Neurobiology of Uncertainty in Traumatically Injured Adults.Biol Psychiatry Glob Open Sci. 2022 Jul;2(3):263-272. doi: 10.1016/j.bpsgos.2022.02.006. Epub 2022 Mar 2. Biol Psychiatry Glob Open Sci. 2022. PMID: 35903110 Free PMC article.
-
Neighborhood Disadvantage and Neural Correlates of Threat and Reward Processing in Survivors of Recent Trauma.JAMA Netw Open. 2023 Sep 5;6(9):e2334483. doi: 10.1001/jamanetworkopen.2023.34483. JAMA Netw Open. 2023. PMID: 37721751 Free PMC article.
-
Relations Between Neighborhood Disadvantage and Electrocortical Reward Processing in Youth at High and Low Risk for Depression.Res Child Adolesc Psychopathol. 2024 Jul;52(7):1037-1045. doi: 10.1007/s10802-024-01180-2. Epub 2024 Mar 19. Res Child Adolesc Psychopathol. 2024. PMID: 38502404
-
The impact of neighborhood disadvantage on amygdala reactivity: Pathways through neighborhood social processes.Dev Cogn Neurosci. 2022 Apr;54:101061. doi: 10.1016/j.dcn.2022.101061. Epub 2022 Jan 12. Dev Cogn Neurosci. 2022. PMID: 35042163 Free PMC article.
-
Area Deprivation Index as a Surrogate of Resilience in Aging and Dementia.Front Psychol. 2022 Jun 29;13:930415. doi: 10.3389/fpsyg.2022.930415. eCollection 2022. Front Psychol. 2022. PMID: 35846636 Free PMC article. Review.
Cited by
-
Neighborhood Perceptions Are Associated With Intrinsic Amygdala Activity and Resting-State Connectivity With Salience Network Nodes Among Older Adults.Psychosom Med. 2024 Feb-Mar 01;86(2):116-123. doi: 10.1097/PSY.0000000000001272. Epub 2023 Dec 28. Psychosom Med. 2024. PMID: 38150567 Free PMC article.
-
Childhood Community Disadvantage and MRI-Derived Structural Brain Integrity After Age 65 Years.JAMA Netw Open. 2024 Nov 4;7(11):e2443703. doi: 10.1001/jamanetworkopen.2024.43703. JAMA Netw Open. 2024. PMID: 39509129 Free PMC article.
-
The neurophysiological consequences of racism-related stressors in Black Americans.Neurosci Biobehav Rev. 2024 Jun;161:105638. doi: 10.1016/j.neubiorev.2024.105638. Epub 2024 Mar 24. Neurosci Biobehav Rev. 2024. PMID: 38522814 Free PMC article. Review.
-
Neighborhood disadvantage and parenting predict longitudinal clustering of uncinate fasciculus microstructural integrity and clinical symptomatology in adolescents.Dev Cogn Neurosci. 2024 Apr;66:101368. doi: 10.1016/j.dcn.2024.101368. Epub 2024 Mar 20. Dev Cogn Neurosci. 2024. PMID: 38547783 Free PMC article.
-
Radically reframing studies on neurobiology and socioeconomic circumstances: A call for social justice-oriented neuroscience.Front Integr Neurosci. 2022 Sep 2;16:958545. doi: 10.3389/fnint.2022.958545. eCollection 2022. Front Integr Neurosci. 2022. PMID: 36118113 Free PMC article.
References
-
- Shrider E.A., Kollar M., Chen F., Semega J. U.S. Government Publishing Office; Washington DC: 2021. Income and poverty in the United States: 2020.
-
- Hatfield B.E., Lower J.K., Cassidy D.J., Faldowski R.A. Inequities in access to quality early care and education: Associations with funding and community context. Early Child Res Q. 2015;30:316–326.
-
- Musterd S., Ostendorf W., De Vos S. Neighbourhood effects and social mobility: A longitudinal analysis. Hous Stud. 2003;18:877–892.
Grants and funding
LinkOut - more resources
Full Text Sources
