

Homology-based reconstruction of regulatory networks for bacterial and archaeal genomes
- PMID: 35928164
- PMCID: PMC9344073
- DOI: 10.3389/fmicb.2022.923105
Homology-based reconstruction of regulatory networks for bacterial and archaeal genomes
Abstract
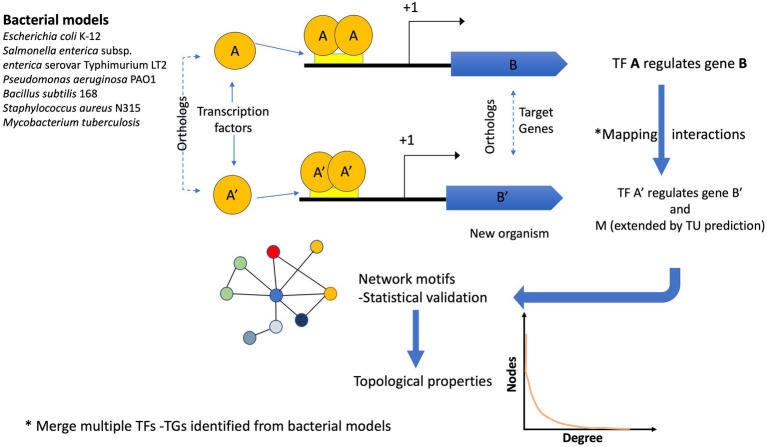
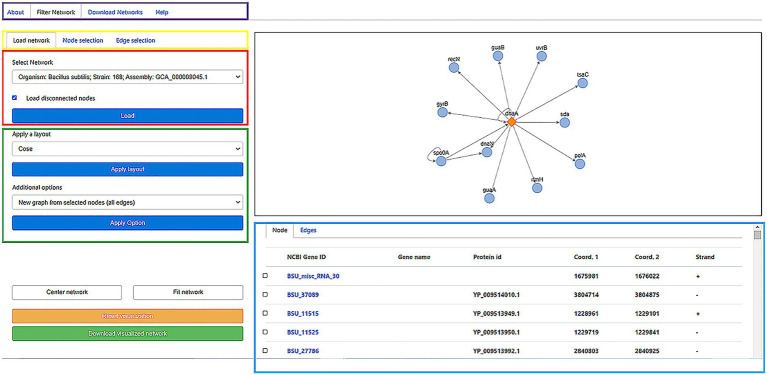
Gene regulation is a key process for all microorganisms, as it allows them to adapt to different environmental stimuli. However, despite the relevance of gene expression control, for only a handful of organisms is there related information about genome regulation. In this work, we inferred the gene regulatory networks (GRNs) of bacterial and archaeal genomes by comparisons with six organisms with well-known regulatory interactions. The references we used are: Escherichia coli K-12 MG1655, Bacillus subtilis 168, Mycobacterium tuberculosis, Pseudomonas aeruginosa PAO1, Salmonella enterica subsp. enterica serovar typhimurium LT2, and Staphylococcus aureus N315. To this end, the inferences were achieved in two steps. First, the six model organisms were contrasted in an all-vs-all comparison of known interactions based on Transcription Factor (TF)-Target Gene (TG) orthology relationships and Transcription Unit (TU) assignments. In the second step, we used a guilt-by-association approach to infer the GRNs for 12,230 bacterial and 649 archaeal genomes based on TF-TG orthology relationships of the six bacterial models determined in the first step. Finally, we discuss examples to show the most relevant results obtained from these inferences. A web server with all the predicted GRNs is available at https://regulatorynetworks.unam.mx/ or http://132.247.46.6/.
Keywords: genomics; orthology; regulatory modules; regulatory networks; transcription units.
Copyright © 2022 Romero, Contreras-Riquelme, Lira, Martin and Perez-Rueda.
Conflict of interest statement
The authors declare that the research was conducted in the absence of any commercial or financial relationships that could be construed as a potential conflict of interest.
Figures
Similar articles
-
Comparison of DeltarelA strains of Escherichia coli and Salmonella enterica serovar Typhimurium suggests a role for ppGpp in attenuation regulation of branched-chain amino acid biosynthesis.J Bacteriol. 2001 Nov;183(21):6184-96. doi: 10.1128/JB.183.21.6184-6196.2001. J Bacteriol. 2001. PMID: 11591661 Free PMC article.
-
Abasy Atlas v2.2: The most comprehensive and up-to-date inventory of meta-curated, historical, bacterial regulatory networks, their completeness and system-level characterization.Comput Struct Biotechnol J. 2020 May 16;18:1228-1237. doi: 10.1016/j.csbj.2020.05.015. eCollection 2020. Comput Struct Biotechnol J. 2020. PMID: 32542109 Free PMC article.
-
Operon-mapper: a web server for precise operon identification in bacterial and archaeal genomes.Bioinformatics. 2018 Dec 1;34(23):4118-4120. doi: 10.1093/bioinformatics/bty496. Bioinformatics. 2018. PMID: 29931111 Free PMC article.
-
Transcriptional Regulation in Archaea: From Individual Genes to Global Regulatory Networks.Annu Rev Genet. 2017 Nov 27;51:143-170. doi: 10.1146/annurev-genet-120116-023413. Annu Rev Genet. 2017. PMID: 29178818 Review.
-
Enhancer-dependent transcription in Salmonella enterica Typhimurium: new members of the sigmaN regulon inferred from protein sequence homology and predicted promoter sites.J Mol Microbiol Biotechnol. 2002 Jul;4(4):367-74. J Mol Microbiol Biotechnol. 2002. PMID: 12125817 Review.
Cited by
-
RhizoBindingSites v2.0 Is a Bioinformatic Database of DNA Motifs Potentially Involved in Transcriptional Regulation Deduced From Their Genomic Sites.Bioinform Biol Insights. 2024 Sep 6;18:11779322241272395. doi: 10.1177/11779322241272395. eCollection 2024. Bioinform Biol Insights. 2024. PMID: 39246685 Free PMC article.
-
Characterization of radiation-resistance mechanism in Spirosoma montaniterrae DY10T in terms of transcriptional regulatory system.Sci Rep. 2023 Mar 23;13(1):4739. doi: 10.1038/s41598-023-31509-8. Sci Rep. 2023. PMID: 36959250 Free PMC article.
References
LinkOut - more resources
Full Text Sources
Miscellaneous