Air Pollution's Impact on Cardiac Remodeling in an Experimental Model of Chagas Cardiomyopathy
- PMID: 35928208
- PMCID: PMC9343625
- DOI: 10.3389/fcimb.2022.830761
Air Pollution's Impact on Cardiac Remodeling in an Experimental Model of Chagas Cardiomyopathy
Abstract
Background: Chagas disease is characterized by intense myocardial fibrosis stimulated by the exacerbated production of inflammatory cytokines, oxidative stress, and apoptosis. Air pollution is a serious public health problem and also follows this same path. Therefore, air pollution might amplify the inflammatory response of Chagas disease and increase myocardial fibrosis.
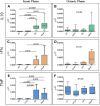
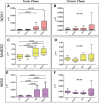
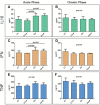
Methods: We studied groups of Trypanosoma cruzi infected Sirius hamsters (Chagas=CH and Chagas exposed to pollution=CH+P) and 2 control groups (control healthy animals=CT and control exposed to pollution=CT+P). We evaluated acute phase (60 days post infection) and chronic phase (10 months). Echocardiograms were performed to assess left ventricular systolic and diastolic diameter, in addition to ejection fraction. Interstitial collagen was measured by morphometry in picrosirius red staining tissue. The evaluation of inflammation was performed by gene and protein expression of cytokines IL10, IFN-γ, and TNF; oxidative stress was quantified by gene expression of NOX1, MnSOD, and iNOS and by analysis of reactive oxygen species; and apoptosis was performed by gene expression of BCL2 and Capsase3, in addition to TUNEL analysis.
Results: Chagas groups had increased collagen deposition mainly in the acute phase, but air pollution did not increase this deposition. Also, Chagas groups had lower ejection fraction in the acute phase (p = 0.002) and again air pollution did not worsen ventricular function or dilation. The analysis of the inflammation and oxidative stress pathways were also not amplified by air pollution. Apoptosis analysis showed increased expression of BCL2 and Caspase3 genes in chagasic groups in the acute phase, with a marginal p of 0.054 in BCL2 expression among infected groups, and TUNEL technique showed amplified of apoptotic cells by pollution among infected groups.
Conclusions: A possible modulation of the apoptotic pathway was observed, inferring interference from air pollution in this pathway. However, it was not enough to promote a greater collagen deposition, or worsening ventricular function or dilation caused by air pollution in this model of Chagas cardiomyopathy.
Keywords: Chagas disease; air pollution; cardiomyopathy; myocardial fibrosis; remodeling.
Copyright © 2022 Fonseca, Pessoa, Ribeiro, Hotta, Ianni, Fernandes, Ferreira Rivero, Saldiva, Mady and Ramires.
Conflict of interest statement
The authors declare that the research was conducted in the absence of any commercial or financial relationships that could be construed as a potential conflict of interest.
Figures


Similar articles
-
The effect of beta-blockade on myocardial remodelling in Chagas' cardiomyopathy.Clinics (Sao Paulo). 2012 Sep;67(9):1063-9. doi: 10.6061/clinics/2012(09)14. Clinics (Sao Paulo). 2012. PMID: 23018305 Free PMC article.
-
Histopathological Correlates of Global and Segmental Left Ventricular Systolic Dysfunction in Experimental Chronic Chagas Cardiomyopathy.J Am Heart Assoc. 2016 Jan 21;5(1):e002786. doi: 10.1161/JAHA.115.002786. J Am Heart Assoc. 2016. PMID: 26796255 Free PMC article.
-
The Oxidative Stress and Chronic Inflammatory Process in Chagas Disease: Role of Exosomes and Contributing Genetic Factors.Oxid Med Cell Longev. 2021 Dec 23;2021:4993452. doi: 10.1155/2021/4993452. eCollection 2021. Oxid Med Cell Longev. 2021. PMID: 34976301 Free PMC article. Review.
-
MnSODtg mice control myocardial inflammatory and oxidative stress and remodeling responses elicited in chronic Chagas disease.J Am Heart Assoc. 2013 Oct 17;2(5):e000302. doi: 10.1161/JAHA.113.000302. J Am Heart Assoc. 2013. PMID: 24136392 Free PMC article.
-
Molecular mechanisms of cardiac electromechanical remodeling during Chagas disease: Role of TNF and TGF-β.Trends Cardiovasc Med. 2017 Feb;27(2):81-91. doi: 10.1016/j.tcm.2016.08.003. Epub 2016 Aug 11. Trends Cardiovasc Med. 2017. PMID: 27622432 Review.
Cited by
-
Effect of neurohormonal therapeutic in left ventricle global and regional function in Chagas cardiomyopathy in a translational animal experimental model.Sci Rep. 2025 Apr 12;15(1):12595. doi: 10.1038/s41598-025-96676-2. Sci Rep. 2025. PMID: 40221465 Free PMC article.
References
-
- Armstrong W. F., Ryan T. (2011). Feigenbaum's Echocardiography. Seventh Edition (Philadelphia: Lippincott Williams & Wilkins; ).
Publication types
MeSH terms
Substances
LinkOut - more resources
Full Text Sources
Medical

