

Genome-wide association analysis and pathway enrichment provide insights into the genetic basis of photosynthetic responses to drought stress in Persian walnut
- PMID: 35928405
- PMCID: PMC9343916
- DOI: 10.1093/hr/uhac124
Genome-wide association analysis and pathway enrichment provide insights into the genetic basis of photosynthetic responses to drought stress in Persian walnut
Abstract
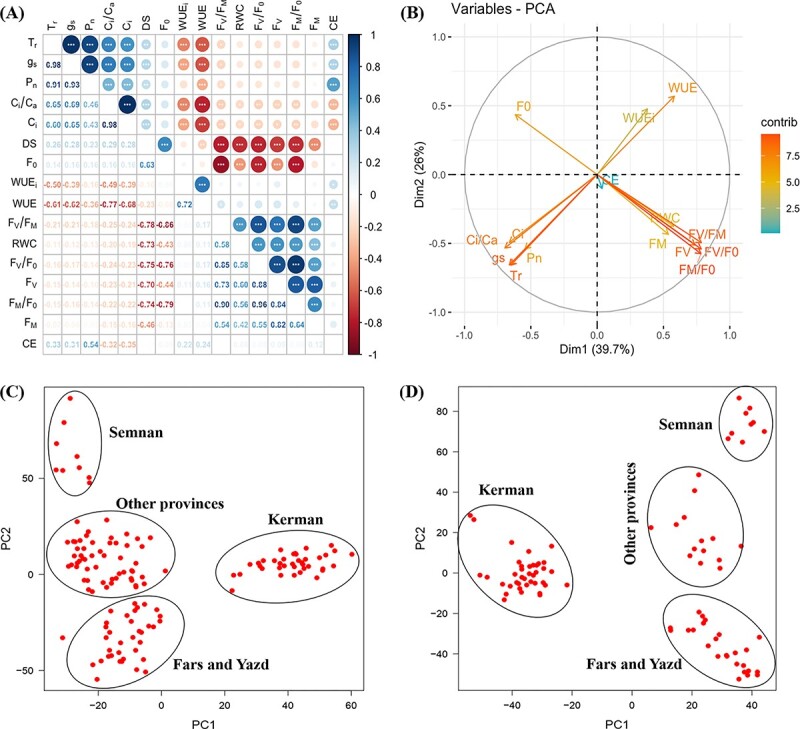
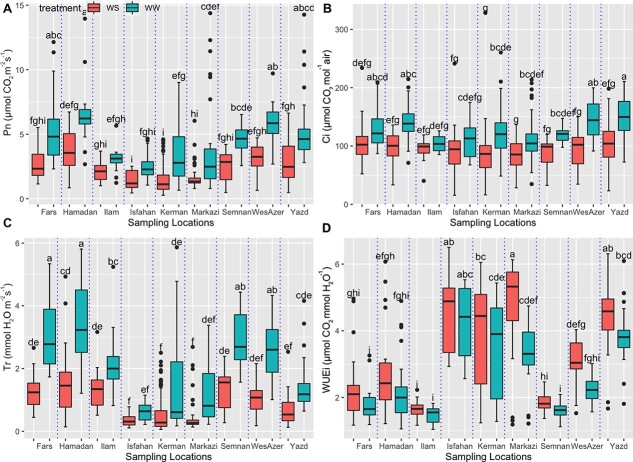
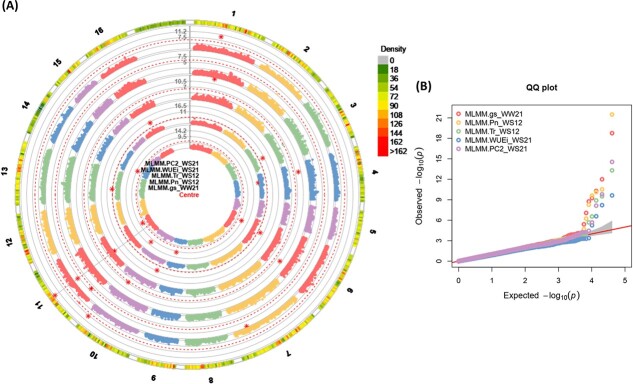
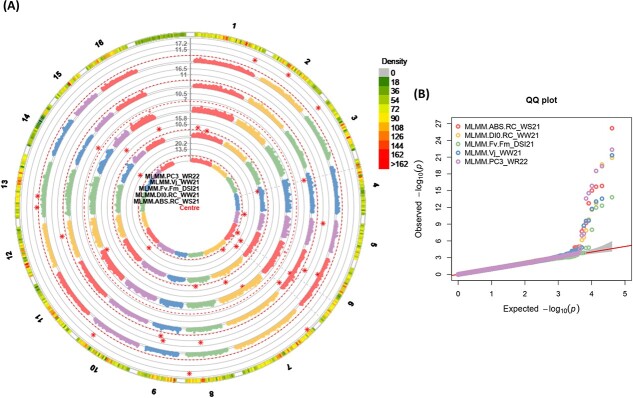
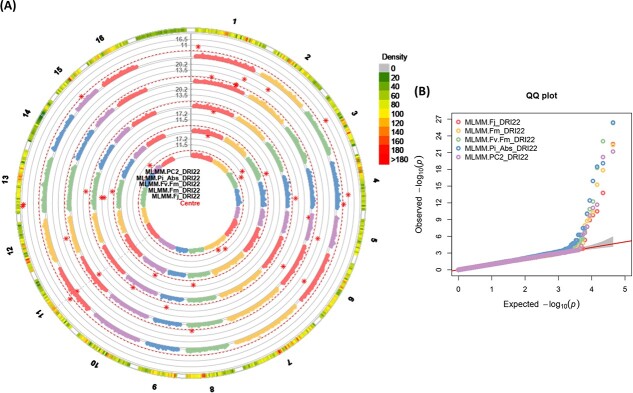
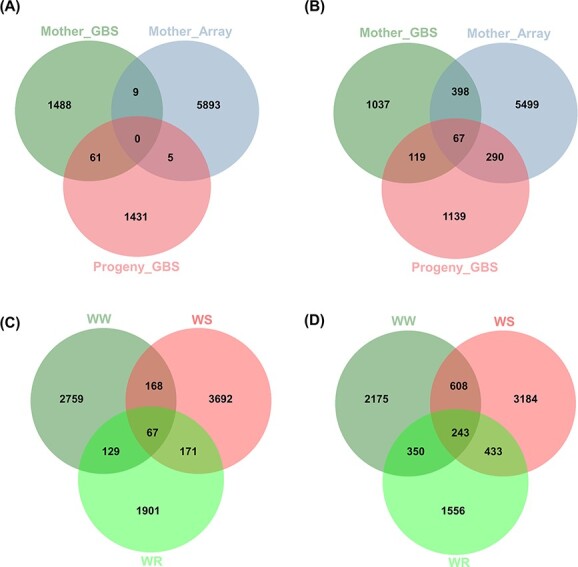
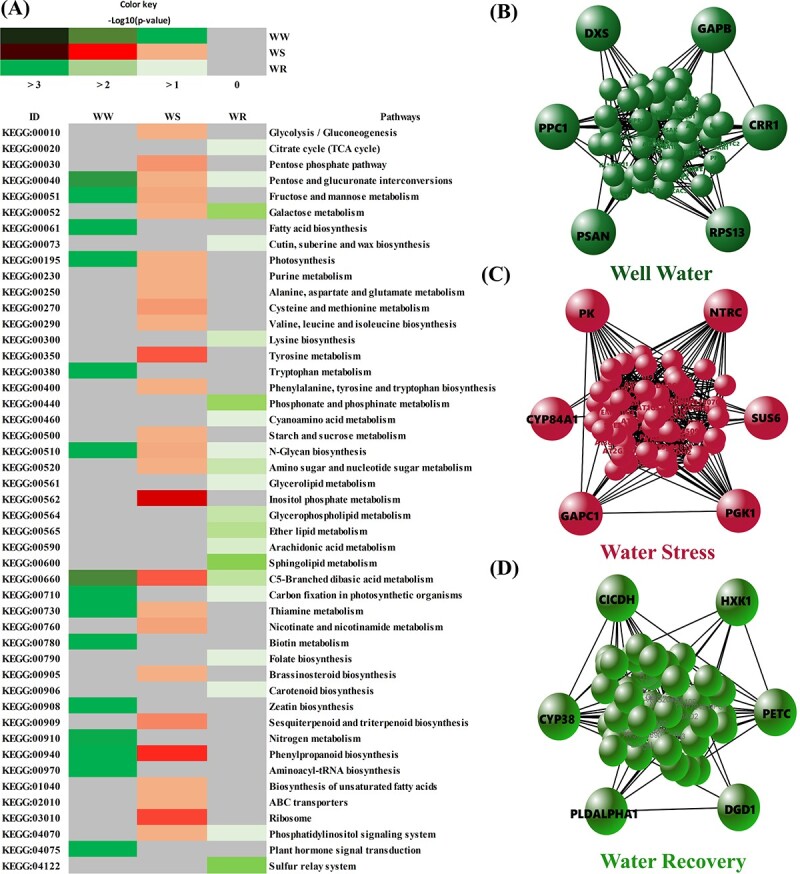
Uncovering the genetic basis of photosynthetic trait variation under drought stress is essential for breeding climate-resilient walnut cultivars. To this end, we examined photosynthetic capacity in a diverse panel of 150 walnut families (1500 seedlings) from various agro-climatic zones in their habitats and grown in a common garden experiment. Photosynthetic traits were measured under well-watered (WW), water-stressed (WS) and recovery (WR) conditions. We performed genome-wide association studies (GWAS) using three genomic datasets: genotyping by sequencing data (∼43 K SNPs) on both mother trees (MGBS) and progeny (PGBS) and the Axiom™ Juglans regia 700 K SNP array data (∼295 K SNPs) on mother trees (MArray). We identified 578 unique genomic regions linked with at least one trait in a specific treatment, 874 predicted genes that fell within 20 kb of a significant or suggestive SNP in at least two of the three GWAS datasets (MArray, MGBS, and PGBS), and 67 genes that fell within 20 kb of a significant SNP in all three GWAS datasets. Functional annotation identified several candidate pathways and genes that play crucial roles in photosynthesis, amino acid and carbohydrate metabolism, and signal transduction. Further network analysis identified 15 hub genes under WW, WS and WR conditions including GAPB, PSAN, CRR1, NTRC, DGD1, CYP38, and PETC which are involved in the photosynthetic responses. These findings shed light on possible strategies for improving walnut productivity under drought stress.
© The Author(s) 2022. Published by Oxford University Press on behalf of Nanjing Agricultural University.
Figures


Similar articles
-
Combining phenotype, genotype, and environment to uncover genetic components underlying water use efficiency in Persian walnut.J Exp Bot. 2020 Jan 23;71(3):1107-1127. doi: 10.1093/jxb/erz467. J Exp Bot. 2020. PMID: 31639822
-
A new genomic tool for walnut (Juglans regia L.): development and validation of the high-density Axiom™ J. regia 700K SNP genotyping array.Plant Biotechnol J. 2019 Jun;17(6):1027-1036. doi: 10.1111/pbi.13034. Epub 2018 Dec 4. Plant Biotechnol J. 2019. PMID: 30515952 Free PMC article.
-
Genome-wide patterns of population structure and association mapping of nut-related traits in Persian walnut populations from Iran using the Axiom J. regia 700K SNP array.Sci Rep. 2019 Apr 23;9(1):6376. doi: 10.1038/s41598-019-42940-1. Sci Rep. 2019. PMID: 31015545 Free PMC article.
-
Deciphering of the Genetic Control of Phenology, Yield, and Pellicle Color in Persian Walnut (Juglans regia L.).Front Plant Sci. 2019 Sep 20;10:1140. doi: 10.3389/fpls.2019.01140. eCollection 2019. Front Plant Sci. 2019. PMID: 31616449 Free PMC article.
-
Genome-wide association analysis of 101 accessions dissects the genetic basis of shell thickness for genetic improvement in Persian walnut (Juglans regia L.).BMC Plant Biol. 2022 Sep 13;22(1):436. doi: 10.1186/s12870-022-03824-1. BMC Plant Biol. 2022. PMID: 36096735 Free PMC article.
Cited by
-
Inheritance patterns of pomological traits in walnut hybridization breeding: influence of parental varieties on nut traits.BMC Plant Biol. 2025 Jan 23;25(1):98. doi: 10.1186/s12870-025-06124-6. BMC Plant Biol. 2025. PMID: 39844031 Free PMC article.
-
Elucidating the regulatory role of long non-coding RNAs in drought stress response during seed germination in leaf mustard.PeerJ. 2024 Jul 5;12:e17661. doi: 10.7717/peerj.17661. eCollection 2024. PeerJ. 2024. PMID: 38978758 Free PMC article.
-
Genome-wide association study (GWAS) provides insights into the genomic basis of reproduction-related traits in Chouardia litardierei (Asparagaceae).BMC Plant Biol. 2025 May 2;25(1):577. doi: 10.1186/s12870-025-06617-4. BMC Plant Biol. 2025. PMID: 40316938 Free PMC article.
-
The complete chloroplast genome sequences of nine melon varieties (Cucumis melo L.): lights into comparative analysis and phylogenetic relationships.Front Genet. 2024 Jul 9;15:1417266. doi: 10.3389/fgene.2024.1417266. eCollection 2024. Front Genet. 2024. PMID: 39045329 Free PMC article.
-
Characteristics of wild hazelnut populations in Northeast China and selection of superior provenances.PLoS One. 2024 Dec 3;19(12):e0313954. doi: 10.1371/journal.pone.0313954. eCollection 2024. PLoS One. 2024. PMID: 39625918 Free PMC article.
References
-
- Vahdati K, Arab MM, Sarikhani S et al. Advances in Persian walnut (Juglans regia L.) breeding strategies. In: Al-Khayri JM, Jain SM, Johnson DV. (eds.), Advances in Plant Breeding Strategies: Nut and Beverage Crops: Volume 4. New York: Springer, 2019, 401–72.
-
- Vahdati K, Arab MM, Sarikhani S. Advances in biotechnology and propagation of nut trees in Iran. In: Egorov E, Ilina I, Zaporozhets N. (eds.), BIO Web of Conferences. Krasnodar, Russia: EDP Sciences, 2020;25:01003.
-
- Arab MM, Morrano A, Abdollahi-Arpanahi R et al. Combining phenotype, genotype, and environment to uncover genetic components underlying water use efficiency in Persian walnut. Comparative Study. 2020;71:1107–27. - PubMed
-
- Vahdati K, Lofti N, Kholdebarin B et al. Screening for drought-tolerant genotypes of Persian walnuts (Juglans regia L) during seed germination. Hort Science. 2009;44:1815–9.
-
- Famula RA, Richards JH, Famula TR et al. Association genetics of carbon isotope discrimination and leaf morphology in a breeding population of Juglans regia L. Tree Genet Genomes. 2019;15:1–13. - PubMed
