

RPP30 is a novel diagnostic and prognostic biomarker for gastric cancer
- PMID: 35928448
- PMCID: PMC9343801
- DOI: 10.3389/fgene.2022.888051
RPP30 is a novel diagnostic and prognostic biomarker for gastric cancer
Abstract
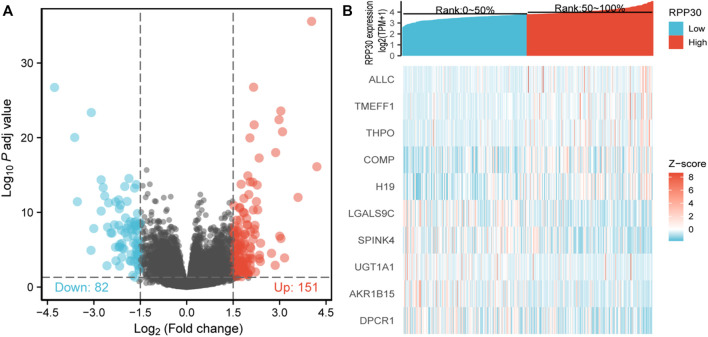
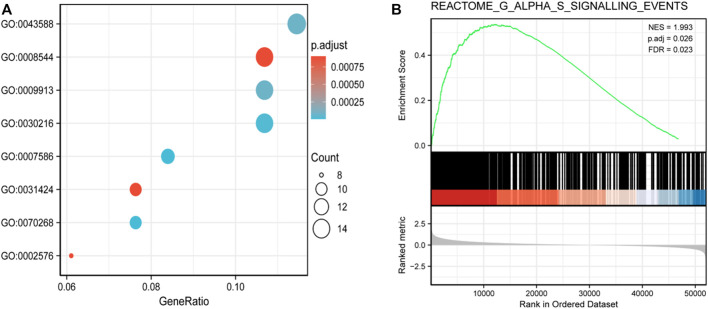
Objective: This study aimed to identify the hub gene in gastric cancer (GC) tumorigenesis. A biomarker prediction model was constructed and analyzed, and protein expression in histopathological samples was verified in a validation cohort. Methods: Differentially expressed genes (DEGs) were identified from GC projects in The Cancer Genome Atlas (TCGA) database. Functional enrichment analysis of DEGs was performed between the high- and low- Ribonuclease P protein subunit p30 (RPP30) expression groups. ROC analysis was performed to assess RPP30 expression to discriminate GC from normal tissues. Functional enrichment pathways and immune infiltration of DEGs were analyzed using GSEA and ssGSEA. Survival analysis and nomogram construction were performed to predict patient survival. Immunohistochemical staining of GC tissues was performed to validate RPP30 expression in GC and paracancerous samples. Results: Gene expression data and clinical information of 380 cases (375 GC samples and 32 para-cancerous tissues) were collected from TCGA database. The AUC for RPP30 expression was found to be 0.785. The G alpha S signaling pathway was the most significantly enriched signaling pathway. Primary therapy outcome (p < 0.001, HR = 0.243, 95% CI = 0.156-0.379), age (p = 0.012, HR = 1.748, 95% CI = 1.133-2.698), and RPP30 expression (p < 0.001, HR = 2.069, 95% CI = 1.346-3.181) were identified as independent prognostic factors. As a quantitative approach, a nomogram constructed based on RPP30 expression, age, and primary therapy outcome performed well in predicting patient survival. Nineteen of the 25 tissue samples from the validation cohort showed positive RPP30 expression in GC tissues, whereas 16 cases showed negative RPP30 staining in normal tissues. The difference between the two was statistically significant. Conclusion: High RPP30 expression was significantly correlated with disease progression and poor survival in GC, promoting tumorigenesis and angiogenesis via tRNA dysregulation. This study provides new and promising insights into the molecular pathogenesis of tRNA in GC.
Keywords: RPP30; bioinformatics analysis; early diagnosis; gastric cancer; prognosis.
Copyright © 2022 Kan, Lu, Feng, Yang, Ma, Gong and Yang.
Conflict of interest statement
The authors declare that the research was conducted in the absence of any commercial or financial relationships that could be construed as a potential conflict of interest.
Figures


Similar articles
-
New insights into the role of ribonuclease P protein subunit p30 from tumor to internal reference.Front Oncol. 2022 Oct 13;12:1018279. doi: 10.3389/fonc.2022.1018279. eCollection 2022. Front Oncol. 2022. PMID: 36313673 Free PMC article. Review.
-
THBS2 is Closely Related to the Poor Prognosis and Immune Cell Infiltration of Gastric Cancer.Front Genet. 2022 Feb 3;13:803460. doi: 10.3389/fgene.2022.803460. eCollection 2022. Front Genet. 2022. PMID: 35186032 Free PMC article.
-
High expression of oncogene cadherin-6 correlates with tumor progression and a poor prognosis in gastric cancer.Cancer Cell Int. 2021 Sep 16;21(1):493. doi: 10.1186/s12935-021-02071-y. Cancer Cell Int. 2021. PMID: 34530820 Free PMC article.
-
HTRA3 Is a Prognostic Biomarker and Associated With Immune Infiltrates in Gastric Cancer.Front Oncol. 2020 Dec 23;10:603480. doi: 10.3389/fonc.2020.603480. eCollection 2020. Front Oncol. 2020. PMID: 33425760 Free PMC article.
-
ELANE is a promising prognostic biomarker that mediates pyroptosis in gastric cancer.Heliyon. 2024 Jul 15;10(14):e34360. doi: 10.1016/j.heliyon.2024.e34360. eCollection 2024 Jul 30. Heliyon. 2024. PMID: 39130462 Free PMC article.
Cited by
-
New insights into the role of ribonuclease P protein subunit p30 from tumor to internal reference.Front Oncol. 2022 Oct 13;12:1018279. doi: 10.3389/fonc.2022.1018279. eCollection 2022. Front Oncol. 2022. PMID: 36313673 Free PMC article. Review.
-
DKK3 and SERPINB5 as novel serum biomarkers for gastric cancer: facilitating the development of risk prediction models for gastric cancer.Front Oncol. 2025 Mar 31;15:1536491. doi: 10.3389/fonc.2025.1536491. eCollection 2025. Front Oncol. 2025. PMID: 40231256 Free PMC article.
References
-
- Global Burden of Disease Cancer C., Fitzmaurice C., Abate D., et al. (2019). Global, regional, and national cancer incidence, mortality, years of Life lost, years lived with disability, and disability-adjusted life-years for 29 cancer groups, 1990 to 2017: A systematic analysis for the global burden of disease study[J]. JAMA Oncol. 5 (12), 1749–1768. - PMC - PubMed
LinkOut - more resources
Full Text Sources
Research Materials
Miscellaneous