

Identification and Validation of a Three Pyroptosis-Related lncRNA Signature for Prognosis Prediction in Lung Adenocarcinoma
- PMID: 35928454
- PMCID: PMC9345371
- DOI: 10.3389/fgene.2022.838624
Identification and Validation of a Three Pyroptosis-Related lncRNA Signature for Prognosis Prediction in Lung Adenocarcinoma
Abstract
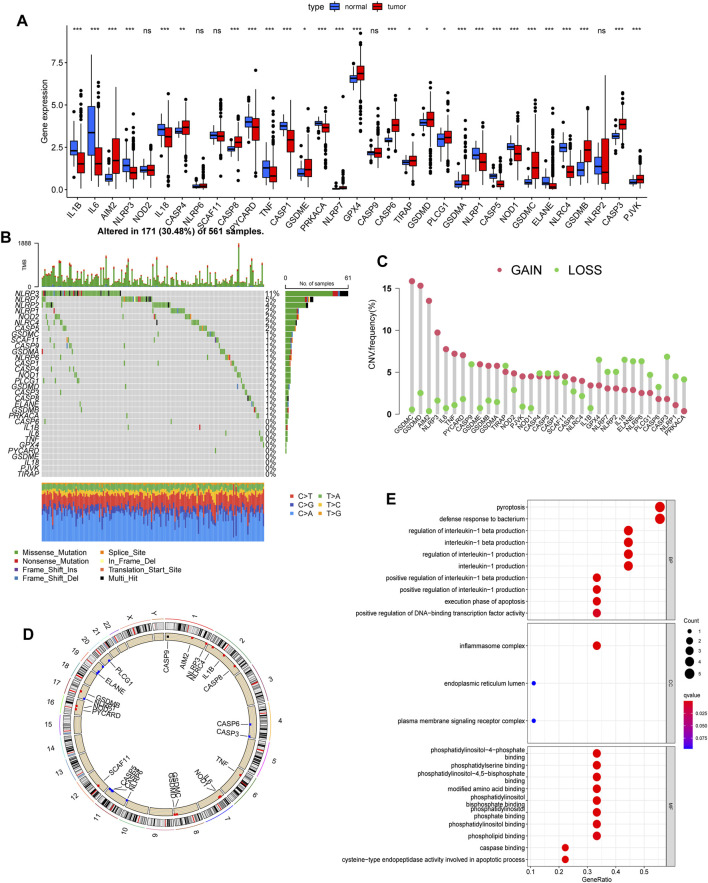
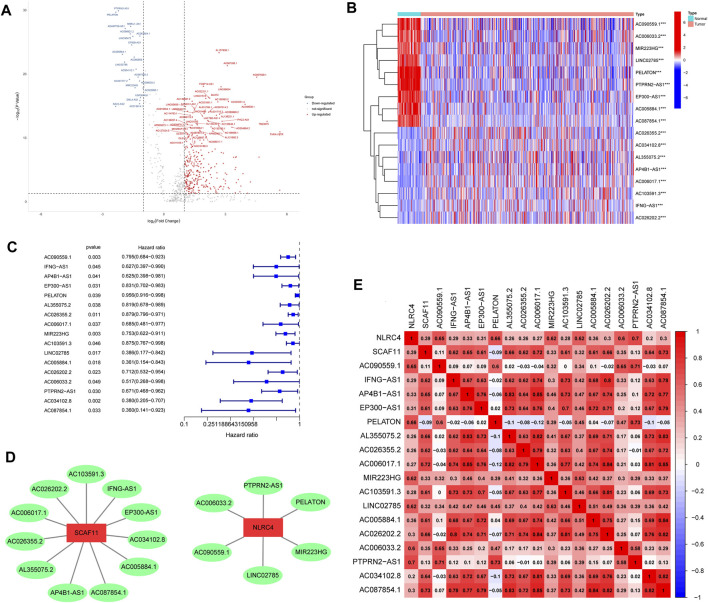
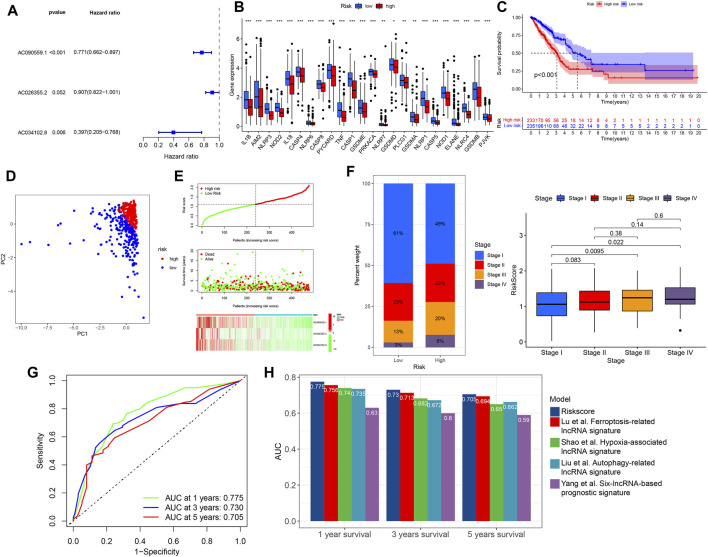
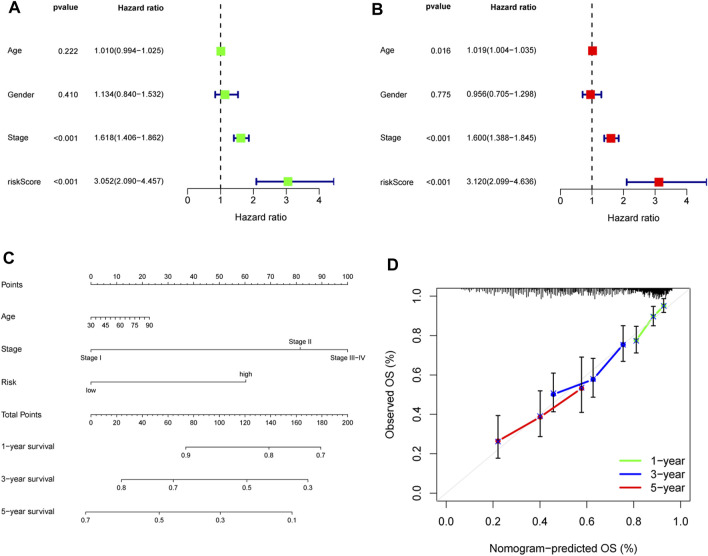
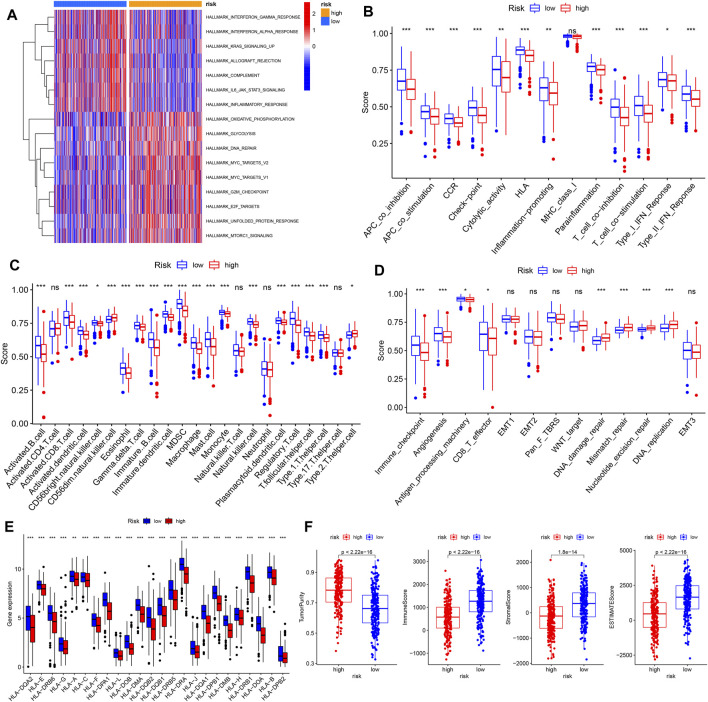
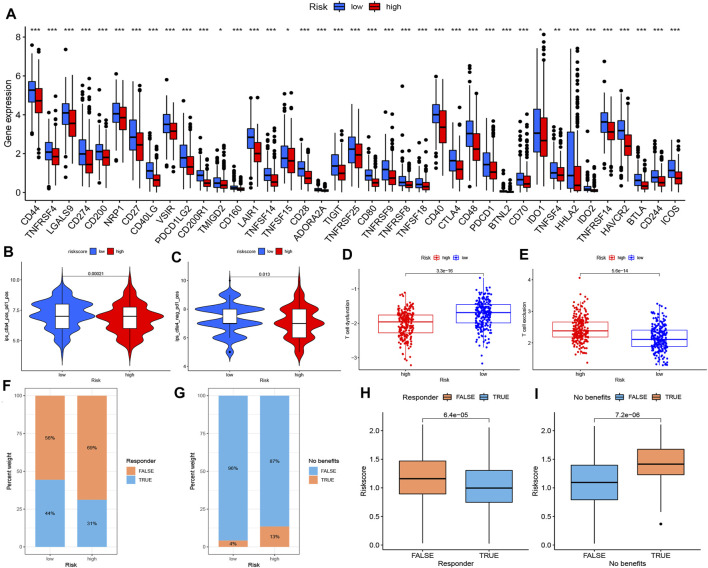
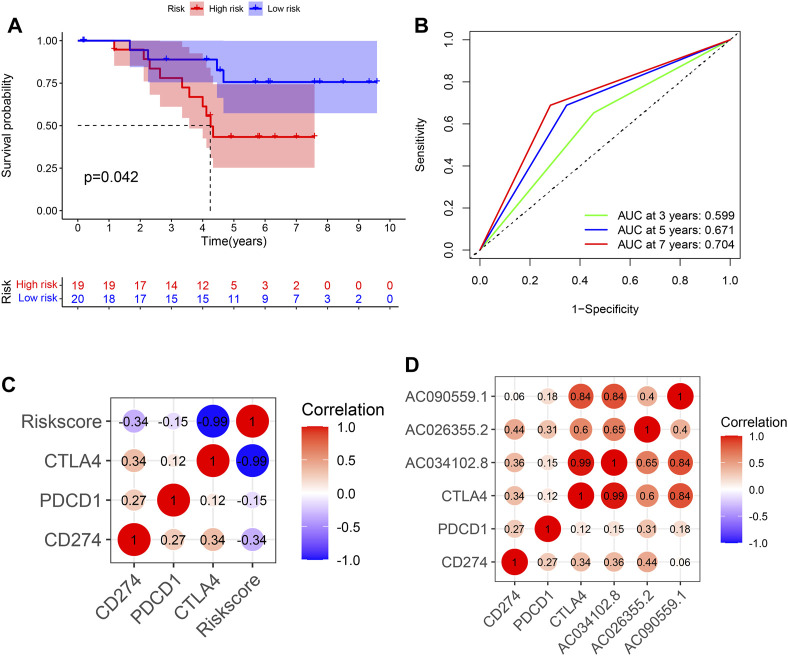
Pyroptosis, defined as programmed cell death, results in the release of inflammatory mediators. Recent studies have revealed that pyroptosis plays essential roles in antitumor immunity and immunotherapy efficacy. Long noncoding RNAs (lncRNAs) are involved in a variety of biological behaviors in tumor cells, although the roles and mechanisms of lncRNAs in pyroptosis are rarely studied. Our study aimed to establish a novel pyroptosis-related lncRNA signature as a forecasting tool for predicting prognosis and ascertaining immune value. Based on lung adenocarcinoma (LUAD) patients from The Cancer Genome Atlas (TCGA), we performed Pearson's correlation analysis to identify pyroptosis-related lncRNAs. After differentially expressed gene analysis and univariate Cox regression analysis, we selected prognosis-related and differentially expressed lncRNAs. Finally, we performed multivariate Cox regression analysis to establish the three pyroptosis-related lncRNA signature. Kaplan-Meier (KM) survival analyses and receiver operating characteristic (ROC) curves indicated the excellent performance for predicting the prognosis of LUAD patients. At the same time, we applied multidimensional approaches to further explore the functional enrichment, tumor microenvironment (TME) landscape, and immunotherapy efficacy among the different risk groups. A nomogram was constructed by integrating risk scores and clinical characteristics, which was validated using calibrations and ROC curves. Three lncRNAs, namely, AC090559.1, AC034102.8, and AC026355.2, were involved in this signature and used to classify LUAD patients into low- and high-risk groups. Overall survival time (OS) was higher in the low-risk group than in the high-risk group, which was also validated in our LUAD cohort from Shandong Provincial Hospital. TME landscape analyses revealed that a higher abundance of infiltrating immune cells and a greater prevalence of immune-related events existed in the low-risk group. Meanwhile, higher expression of immune checkpoint (ICP) genes, higher immunophenoscore (IPSs), and greater T cell dysfunction in the low-risk group demonstrated a better response to immunotherapy than the high-risk group. Combined with predictions from the Tumor Immune Dysfunction and Exclusion (TIDE) website, we found that LUAD patients in the low-risk group significantly benefited from programmed cell death 1 (PD-1) and cytotoxic T-lymphocyte-associated protein 4 (CTLA4) immune checkpoint blockade (ICB) therapy compared with those in the high-risk group. Furthermore, drug susceptibility analysis identified potential sensitive chemotherapeutic drugs for each risk group. In this study, a novel three pyroptosis-related lncRNA signature was constructed, which could accurately predict the immunotherapy efficacy and prognosis in LUAD patients.
Keywords: immunotherapy; long noncoding RNA; lung adenocarcinoma; prognosis; pyroptosis.
Copyright © 2022 Liu, Liu, Shen, Liu, Wang, Wang and Du.
Conflict of interest statement
The authors declare that the research was conducted in the absence of any commercial or financial relationships that could be construed as a potential conflict of interest.
Figures
Similar articles
-
Development and validation of a prognostic risk signature for lung adenocarcinoma constructed by six ferroptosis, necroptosis, and pyroptosis-related lncRNAs.J Thorac Dis. 2022 Oct;14(10):3955-3974. doi: 10.21037/jtd-22-1151. J Thorac Dis. 2022. PMID: 36389299 Free PMC article.
-
A Novel Necroptosis-Related lncRNA Signature Predicts the Prognosis of Lung Adenocarcinoma.Front Genet. 2022 Mar 17;13:862741. doi: 10.3389/fgene.2022.862741. eCollection 2022. Front Genet. 2022. PMID: 35368663 Free PMC article.
-
Identification of a pyroptosis-related lncRNA signature in the regulation of prognosis, metabolism signals and immune infiltration in lung adenocarcinoma.Front Endocrinol (Lausanne). 2022 Aug 10;13:964362. doi: 10.3389/fendo.2022.964362. eCollection 2022. Front Endocrinol (Lausanne). 2022. PMID: 36034461 Free PMC article.
-
A novel prognostic signature for lung adenocarcinoma based on cuproptosis-related lncRNAs: A Review.Medicine (Baltimore). 2022 Dec 9;101(49):e31924. doi: 10.1097/MD.0000000000031924. Medicine (Baltimore). 2022. PMID: 36626411 Free PMC article. Review.
-
Pyroptosis and the tumor immune microenvironment: A new battlefield in ovarian cancer treatment.Biochim Biophys Acta Rev Cancer. 2024 Mar;1879(2):189058. doi: 10.1016/j.bbcan.2023.189058. Epub 2023 Dec 17. Biochim Biophys Acta Rev Cancer. 2024. PMID: 38113952 Review.
Cited by
-
Establishment of a prognostic signature for lung adenocarcinoma using cuproptosis-related lncRNAs.BMC Bioinformatics. 2023 Mar 6;24(1):81. doi: 10.1186/s12859-023-05192-5. BMC Bioinformatics. 2023. PMID: 36879187 Free PMC article.
-
A cuproptosis-related lncRNA signature-based prognostic model featuring on metastasis and drug selection strategy for patients with lung adenocarcinoma.Front Pharmacol. 2023 Sep 7;14:1236655. doi: 10.3389/fphar.2023.1236655. eCollection 2023. Front Pharmacol. 2023. PMID: 37745054 Free PMC article.
-
The role of mitochondria-related lncRNAs in characterizing the immune landscape and supervising the prognosis of osteosarcoma.J Bone Oncol. 2023 Oct 5;43:100506. doi: 10.1016/j.jbo.2023.100506. eCollection 2023 Dec. J Bone Oncol. 2023. PMID: 37868616 Free PMC article.
-
Signatures of tumor microenvironment-related genes and long noncoding RNAs predict poor prognosis in osteosarcoma.PLoS One. 2025 Jul 16;20(7):e0326876. doi: 10.1371/journal.pone.0326876. eCollection 2025. PLoS One. 2025. PMID: 40668798 Free PMC article.
-
The role of pyroptosis-related lncRNA risk signature in ovarian cancer prognosis and immune system.Discov Oncol. 2023 Aug 19;14(1):149. doi: 10.1007/s12672-023-00767-3. Discov Oncol. 2023. PMID: 37597098 Free PMC article.
References
LinkOut - more resources
Full Text Sources