

Epidemiology and spatial examination of bicycle-motor vehicle crashes in Iowa, 2001-2011
- PMID: 35928557
- PMCID: PMC9348608
- DOI: 10.1016/j.jth.2014.08.006
Epidemiology and spatial examination of bicycle-motor vehicle crashes in Iowa, 2001-2011
Abstract
Purpose: To identify how person, crash, environment, and population characteristics differ between bicycle-motor vehicle crashes that occur at intersections and non-intersections.
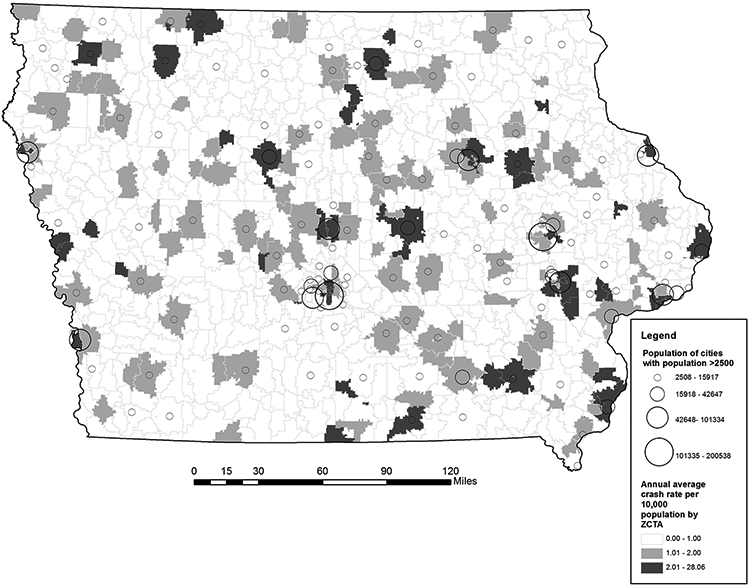
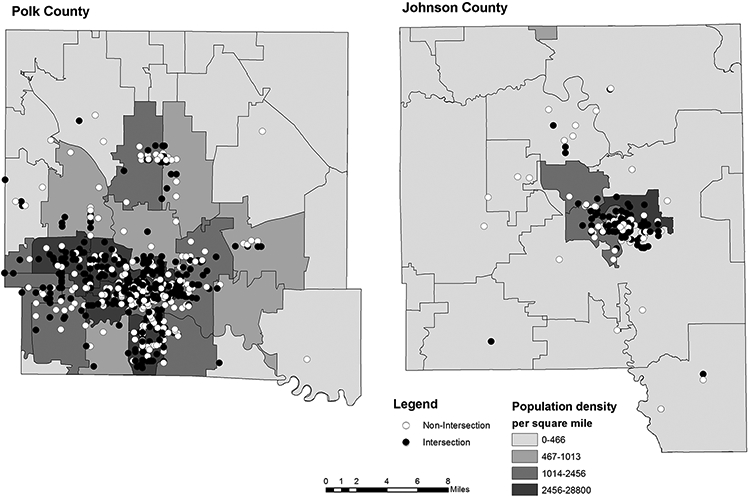
Methods: The Iowa Department of Transportation crash database for the years 2001 through 2011 was used to identify bicycle-motor vehicle (BMV) crashes and associated person, crash, and environment characteristics. Population-level data were drawn from the 2010 U.S. Census and the 2010 American Community Survey. Descriptive statistics, GIS mapping, and multivariable logistic regression were used to examine factors associated with crash risk and crash location.
Results: Compared to intersections, non-intersection BMV crashes had higher odds of involving young bicyclists (<10 years old; OR: 1.8, 95%CI: 1.2-2.6), location outside city limits (OR: 5.7, 95%CI: 3.9-8.3), with driver vision obscured (OR: 1.5, 95% CI: 1.2-1.8), reduced lighting on roadway (OR: 1.9, 95% CI: 1.5-2.4), and lower odds when the bicyclist (OR: 0.4, 95% CI: 0.3-0.6) or motorist (OR: 0.6, 95% CI: 0.4-0.8) failed to yield right of way.
Conclusions: Environmental factors, as well as developmental (age) and behavioral factors of bicycle-motor vehicle crashes vary by location (intersection/non-intersection). Results from this study can be used to tailor and target multiple intervention approaches, such as making infrastructure changes, increasing safety behavior among both motorists and bicyclists, and identifying which age groups and locations would most benefit from intervention.
Keywords: bicycling; environment; epidemiology; public health; traffic accidents.
Figures
Similar articles
-
Determinants of bicycle crashes at urban signalized intersections.J Safety Res. 2023 Dec;87:132-142. doi: 10.1016/j.jsr.2023.09.011. Epub 2023 Sep 20. J Safety Res. 2023. PMID: 38081688
-
Behavioral pathways in bicycle-motor vehicle crashes: From contributing factors, pre-crash actions, to injury severities.J Safety Res. 2021 Jun;77:229-240. doi: 10.1016/j.jsr.2021.02.015. Epub 2021 Mar 18. J Safety Res. 2021. PMID: 34092313
-
Road factors and bicycle-motor vehicle crashes at unsignalized priority intersections.Accid Anal Prev. 2011 May;43(3):853-61. doi: 10.1016/j.aap.2010.11.005. Epub 2010 Dec 7. Accid Anal Prev. 2011. PMID: 21376876
-
The impact of transportation infrastructure on bicycling injuries and crashes: a review of the literature.Environ Health. 2009 Oct 21;8:47. doi: 10.1186/1476-069X-8-47. Environ Health. 2009. PMID: 19845962 Free PMC article. Review.
-
Macro-level vulnerable road users crash analysis: A Bayesian joint modeling approach of frequency and proportion.Accid Anal Prev. 2017 Oct;107:11-19. doi: 10.1016/j.aap.2017.07.020. Epub 2017 Jul 25. Accid Anal Prev. 2017. PMID: 28753415 Review.
Cited by
-
Motor Vehicle Crashes Involving a Bicycle Before and After Introduction of a Bike Share Program in Philadelphia, Pennsylvania, 2010-2018.Am J Public Health. 2020 Jun;110(6):863-867. doi: 10.2105/AJPH.2020.305613. Epub 2020 Apr 16. Am J Public Health. 2020. PMID: 32298172 Free PMC article.
-
Characteristics of cyclist crashes in Italy using latent class analysis and association rule mining.PLoS One. 2017 Feb 3;12(2):e0171484. doi: 10.1371/journal.pone.0171484. eCollection 2017. PLoS One. 2017. PMID: 28158296 Free PMC article.
References
-
- Alliance for Biking & Walking. Bicycling and walking in the United States: 2012. benchmarking report Available at: www.peoplepoweredmovement.org/benchmarking. Accessed June 5, 2012.
-
- Beck LF, Dellinger AM, O'Neil ME. Motor vehicle crash injury rates by mode of travel, united states: Using exposure-based methods to quantify differences. Am J Epidemiol. 2007;166(2):212–218. - PubMed
-
- Delmelle EC, Thill JC, Ha HH. Spatial epidemiologic analysis of relative collision risk factors among urban bicyclists and pedestrians. Transportation. 2012;39(2):433–448.
-
- Demelle EC, Thill JC. Urban bicyclists: Spatial analysis of adult and youth traffic hazard intensity. Transport Res Rec. 2008; 2074:31–39.
-
- Edwards P, Green J, Lachowycz K, Grundy C, Roberts I. Serious injuries in children: variation by area deprivation and settlement type. Archives of disease in childhood. 2008. Jun;93(6):485–9. PubMed PMID: 18381345. - PubMed
Grants and funding
LinkOut - more resources
Full Text Sources