. 2022 Jul 19:16:871532.
doi: 10.3389/fncel.2022.871532. eCollection 2022.

Long-Term Intranasal Nerve Growth Factor Treatment Favors Neuron Formation in de novo Brain Tissue

Affiliations

Long-Term Intranasal Nerve Growth Factor Treatment Favors Neuron Formation in de novo Brain Tissue

Nina Colitti et al. Front Cell Neurosci. .

Abstract

Objective: To date, no safe and effective pharmacological treatment has been clinically validated for improving post-stroke neurogenesis. Growth factors are good candidates but low safety has limited their application in the clinic. An additional restraint is the delivery route. Intranasal delivery presents many advantages.

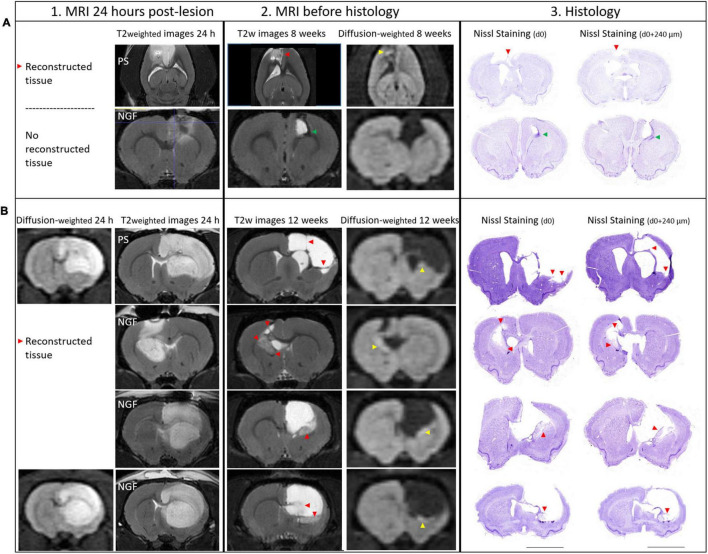
Materials and methods: A brain lesion was induced in twenty-four rats. Nerve growth factor (NGF) 5 μg/kg/day or vehicle was given intranasally from day 10 post-lesion for two periods of five weeks, separated by a two-week wash out period with no treatment. Lesion volume and atrophy were identified by magnetic resonance imaging (MRI). Anxiety and sensorimotor recovery were measured by behavior tests. Neurogenesis, angiogenesis and inflammation were evaluated by histology at 12 weeks.

Results: Remarkable neurogenesis occurred and was visible at the second and third months after the insult. Tissue reconstruction was clearly detected by T2 weighted MRI at 8 and 12 weeks post-lesion and confirmed by histology. In the new tissue (8.1% of the lesion in the NGF group vs. 2.4%, in the control group at 12 weeks), NGF significantly increased the percentage of mature neurons (19% vs. 7%). Angiogenesis and inflammation were not different in the two groups. Sensorimotor recovery was neither improved nor hampered by NGF during the first period of treatment, but NGF treatment limited motor recovery in the second period.

Interpretation: The first five-week period of treatment was very well tolerated. This study is the first presenting the effects of a long treatment with NGF and has shown an important tissue regeneration rate at 8 and 12 weeks post-injury. NGF may have increased neuronal differentiation and survival and favored neurogenesis and neuron survival through subventricular zone (SVZ) neurogenesis or reprogramming of reactive astrocytes. For the first time, we evidenced a MRI biomarker of neurogenesis and tissue reconstruction with T2 and diffusion weighted imaging.

Keywords: MRI; acute brain lesion; intranasal; nerve growth factor; regeneration.


Conflict of interest statement

The authors declare that the research was conducted in the absence of any commercial or financial relationships that could be construed as a potential conflict of interest.

Figures

FIGURE 1
FIGURE 1
Flowchart of the study, with the details on the rats excluded from the protocol: n = 4 died after the surgery (excessive edema); n = 1 excluded because of light deficit and performance >60% at the grip strength test. Rats were sacrificed at 8 weeks (n = 2 per group) and 12 weeks (n = 7 per group) to evaluate the presence of reconstructed tissue at the different time points. PS: physiological saline; NGF: nerve growth factor; MRI: Magnetic Resonance Imaging.
FIGURE 2
FIGURE 2
Detailed study protocol. Behavioral tests started before injury and were performed at time points: day 2 and 4, and week 2, 3, 4, 8, and 12 post-injury. Intranasal administration of PS (vehicle) or NGF started at day 10 post-injury and lasted for 10 weeks (5 weeks + 5 weeks with 2 weeks of wash-out). MRI acquisitions were performed at day 1- and 8-weeks or 12-weeks post-injury. The gray arrow indicates stroke evolution: acute phase until day 7, early subacute phase from day 7 to week 8 post-injury; mid subacute phase from week 8 to 12 post-injury. Each light blue-dash indicates one week. Yellow oblique-parallel lines on the gray arrow indicate the wash-out period. PS: physiological saline; NGF: nerve growth factor; MRI: magnetic resonance imaging; BrdU: 5′-bromo-2-deoxyuridine.
FIGURE 3
FIGURE 3
Histology of brain sections and characterization of the reconstructed tissue and edge of the lesion: glio- and angiogensesis. Representative images and quantification of GFAP (A,D), Iba1 (B,E) and PDGFRB (C,F) mean intensity in PS (left) and NGF (middle) groups. There was no significant difference between the groups, as reported in the graphs (D–F). All the graphs show the distribution of individual values and the median and the interquartile range. PS group: n = 6; NGF group: n = 7 Scale bars: 50 μm. PS: physiological saline; NGF: nerve growth factor; GFAP: glial fibrillary acidic protein; PDGFRB: platelet-derived growth factor receptor beta; L: lesion; RT: reconstructed tissue; HT: healthy tissue.
FIGURE 4
FIGURE 4
Characterization of the lesion. (A) Coronal section corresponding to the malonate injection site (red asterisk) and lesion size (red dashed line), adapted from Paxinos Atlas. (B) Representative T2-weighted MRI color-coded images showing the localization of the lesion in the two groups of rats (PS: left panel; NGF: right panel). The panels show the overlap map of injured voxels, providing an overview of the lesioned brain areas 24 h after the injection of malonate for the groups. Color indicates the number of rats injured at each voxel. (C) Graph showing the correlation between the lesion volume 24 h after the injection of malonate and motor deficits (NSS score) measured 48 h post-injury (p < 0.0001). (D) Notch box plots showing the distribution of lesion volumes, expressed in mm3, 24 h (left) and 12 weeks (right) post-injury. PS group: n = 9; NGF group: n = 9. PS: physiological saline; NGF: nerve growth factor; NSS: neurological severity scale; MRI: magnetic resonance imaging.
FIGURE 5
FIGURE 5
MRI at 24 h (vertical section 1), 8 and 12 weeks (section 2) and Histology of brain sections (section 3) and characterization of the lesion: the reconstructed tissue at 8 and 12 weeks post-injury. 1. At 24 h post-lesion, T2 weighted and diffusion weighted images show hyperintense edematous regions, vasogenic and cytotoxic edema, respectively. Diffusion images were not acquired for all rats at 24 h. Lesions are characterized by an increase in T2 signal and an decrease in water diffusion (hyperintense area on diffusion-weighted images). 2. As tissue becomes necrotic, T2 and water diffusion increase. The reconstructed tissue was observed both on MRI slices and at the exact same location on histology sections (red arrowheads). Restricted water diffusion is evidenced by hyperintensities in the core of the reconstructed tissue (yellow arrowheads). 3. Nissl staining on two coronal sections separated by 240 μm and the corresponding MRI slice (section 2, thickness 300 μm) showing the reconstructed tissue. (A) Brain images from two rats sacrificed at 8 weeks are shown: PS rat (upper panel) and NGF rat (lower panel). Axial images are shown for the PS rat because a MRI artifact, probably coming from a blood clot, caused a distortion in the coronal slices near the skull. Reconstructed tissue is detectable in PS rat, while it is not in NGF rat, because the ventricle is dilated and reaches the skull. In the perilesional area of NGF rat, a hypointense area on T2 images appears (green arrowhead), compatible with newly generated cells (DCX+ and BrdU+ cells, data not shown). (B) Brain images from four different rats that were sacrificed at 12 weeks post-injury are shown. The upper panel shows PS group, while the lower three panels the NGF group. For the PS rat, thin filaments of reconstructed tissue could be detected by MRI (red arrowheads). Diffusion weighted images corresponding to the same section are shown on the right. Histological assay may damage the fragile neotissue (Nissl staining). Scale bars: 5 mm. MRI: magnetic resonance imaging; PS: physiological saline; NGF: Nerve Growth Factor; DCX: doublecortin and BrdU: BrdU: 5′-bromo-2-deoxyuridine.
FIGURE 6
FIGURE 6
Histology of brain sections and characterization of the lesion: the glial scar and the reconstructed tissue at 12 weeks post-injury. (A) Quantification of the glial scar thickness (expressed in μm) based on GFAP mean intensity (fluorescence) in PS and NGF groups. There was no significant difference between the groups. (B) Quantification showing the microglia (Iba1 mean intensity) in the glial scar in PS and NGF groups. There was no significant difference between the groups. (C,D) Nissl staining on coronal sections (left) and magnifications (middle) showing the edges of the lesion (black dashed lines) and the reconstructed tissue (red dotted lines) 12 weeks post-injury in PS (C) and NGF (D) groups. A migration pathway is observed between the ventricle and the lesion edge [Panel (C,D), Red arrow]. (E) magnifications showing pyknotic tissue (green arrowhead) and migration pathway (red arrow). (F): Graph showing the quantification of the reconstructed tissue (RT) normalized by the lesion volume in PS and NGF groups. All the graphs show the distribution of individual values and the median and the interquartile range. PS group: n = 6; NGF group: n = 7. Scale bars: 5 mm. PS: physiological saline; NGF: nerve growth factor; GFAP: glial fibrillary acidic protein; a.u: arbitrary unit.
FIGURE 7
FIGURE 7
Histology of brain sections and characterization of the reconstructed tissue neurogenesis. Representative images and quantification of DCX (A,F), beta 3 tubulin (D,I) mean intensity, NeuN (E,J) cell number (percentage of DAPI+ cells) and BrdU (B,H) cell number (percentage of DAPI+ cells) in the reconstructed tissue in PS (left) and NGF (middle) groups. Double staining with BrdU/DCX and BrdU/NeuN is shown in panel (C,E) (inserts). (C) Representative image showing BrdU (green) and DCX (red) staining. The inserts show the cells expressing both markers (white arrowheads). (E) Representative image showing NeuN (red) staining. The inserts show nuclei positives for BrdU (green) and NeuN markers (white arrowheads). No significant difference was observed for DCX, beta 3 tubulin and BrdU between the groups, as reported in the graphs (F–I). A significant difference in percentage of NeuN positive-cells was observed between the groups (## p = 0.0043). All the graphs show the distribution of individual values and the median and the interquartile range. PS group: n = 6; NGF group: n = 7 except for BrdU. Scale bars: 50 μm. PS: physiological saline; NGF: nerve growth factor; DCX: doublecortin; NeuN: neuronal nuclei; BrdU: 5-bromo-2-deoxyuridine. L: lesion; RT: reconstructed tissue; HT: healthy tissue.
FIGURE 8
FIGURE 8
Pie chart showing the percent of cell types detected in the brain sections of PS (left) and NGF (right) groups identified by histology 12 weeks post-injury. PS group: n = 6; NGF group: n = 7. PS: physiological saline; NGF: nerve growth factor; DCX: doublecortin; NeuN: neuronal nuclei; GFAP: glial fibrillary acidic protein; PDGFRB: platelet-derived growth factor receptor beta; β3-Tub: beta 3 tubulin.
FIGURE 9
FIGURE 9
Behavioral tests following injury to the sensorimotor cortex. (A) Grip strength test shows the grip strength of the front paw contralateral to the injected hemisphere compared to the other paw, expressed as %. The Wilcoxon test compares the values measured 2 days post- compared to the pre-injury ones for the PS (gray triangles) and NGF (light yellow squares) groups (**p < 0.01). The Bonferroni corrected Mann Whitney test compares the results between the PS and the NGF groups, significant at 12 weeks post-injury (#p = 0.014). (B) The limb-use asymmetry test measures the asymmetric limb use, meaning the difference of use for the ipsilateral - contralateral paws compared to the number of supports in %. Both groups were significantly impaired on the contralateral limb 1 week post-injury compared to pre-injury values (Wilcoxon test, **p < 0.01). The difference between PS (white bars) and NGF (dark gray bars) groups is significant 8 weeks post-injury (Mann Whitney test, #p < 0.05). (C) The NSS shows the sensorimotor deficits after malonate injection (scored out of 16). Both groups were significantly impaired 2 days post-injury compared to pre-injury values (Wilcoxon test, **p < 0.01). A significant improvement in NSS was observed in both groups [PS (gray triangles) and NGF (light yellow squares)] 12 weeks compared to 2 days post-injury (*p < 0.05). (D) The anxiety test showing that the latency to take out two front limbs was significantly increased between the pre-injury and 1 week post-injury values for both groups [PS (white bars) and NGF (dark gray bars)] (Wilcoxon test, **p < 0.01). The latency significantly decreased between 1 week and 12 weeks post-injury in both groups, independently of the treatment (*p < 0.05). The Mann-Whitney test did not show any difference between the two groups 12 weeks post-injury. The graphs show the median values and their interquartile ranges; For (A–D), sham: n = 1; PS group: n = 9; NGF group n = 9; n corresponds to the number of individuals. (E,F) Notch box plots showing the level of VEGF (left) and BDNF (right) measured in the plasma of PS and NGF groups 12 weeks post-injury. The graphs show the distribution of individual values and the median and the interquartile range. PS group: n = 5; NGF group n = 7. PS: physiological saline; NGF: nerve growth factor; NSS: neurological severity scale; VEGF: Vascular endothelial growth factor; BDNF: brain-derived growth factor.

Similar articles

Cited by

References

    1. Agrawal M., Saraf S., Saraf S., Antimisiaris S. G., Chougule M. B., Shoyele S. A., et al. (2018). Nose-to-brain drug delivery: an update on clinical challenges and progress towards approval of anti-Alzheimer drugs. J. Control. Release 281 139–177. 10.1016/j.jconrel.2018.05.011 - DOI - PubMed
    1. Alcalá-Barraza S. R., Lee M. S., Hanson L. R., McDonald A. A., Frey W. H., McLoon L. K. (2010). Intranasal delivery of neurotrophic factors BDNF, CNTF, EPO, and NT-4 to the CNS. J. Drug Target. 18 179–190. 10.3109/10611860903318134 - DOI - PMC - PubMed
    1. Aloe L., Rocco M. L., Bianchi P., Manni L. (2012). Nerve growth factor: from the early discoveries to the potential clinical use. J. Transl. Med. 10:239. 10.1186/1479-5876-10-239 - DOI - PMC - PubMed
    1. Aloe L., Rocco M., Balzamino B., Micera A. (2015). Nerve growth factor: a focus on neuroscience and therapy. Curr. Neuropharmacol. 13 294–303. 10.2174/1570159x13666150403231920 - DOI - PMC - PubMed
    1. Anderson M. A., Burda J. E., Ren Y., Ao Y., O’Shea T. M., Kawaguchi R., et al. (2016). Astrocyte scar formation aids central nervous system axon regeneration. Nature 532 195–200. 10.1038/nature17623 - DOI - PMC - PubMed

LinkOut - more resources