. 2022 Jul 26:2022:3621496.
doi: 10.1155/2022/3621496. eCollection 2022.

Myeloid-Derived Suppressor Cells and CD68+CD163+M2-Like Macrophages as Therapeutic Response Biomarkers Are Associated with Plasma Inflammatory Cytokines: A Preliminary Study for Non-Small Cell Lung Cancer Patients in Radiotherapy

Affiliations

Myeloid-Derived Suppressor Cells and CD68+CD163+M2-Like Macrophages as Therapeutic Response Biomarkers Are Associated with Plasma Inflammatory Cytokines: A Preliminary Study for Non-Small Cell Lung Cancer Patients in Radiotherapy

Minghe Lv et al. J Immunol Res. .

Abstract

Background: Recent studies show that myeloid-derived suppressor cells (MDSCs) and M2-like macrophages are involved in the treatment of tumors; however, their therapeutic response role is rarely known in non-small cell lung cancer (NSCLC) during radiotherapy. We aim to explore the dynamic alteration of the circulating MDSCs and M2-like macrophages, to examine their relationship, and to evaluate their therapeutic response value for NSCLC patients in radiotherapy.

Methods: Peripheral blood mononuclear cells from healthy controls and NSCLC patients with different radiotherapy phases were isolated to examine the circulating MDSCs and M2-like macrophages by flow cytometry. 40 plasma inflammatory cytokines were measured by multiplex ELISA.

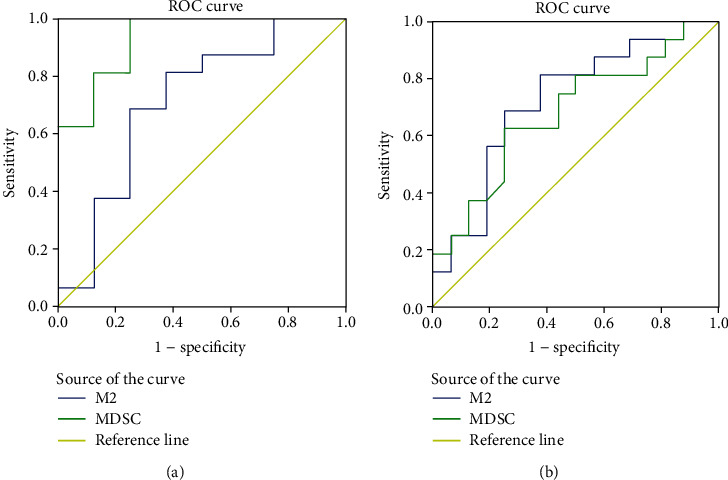
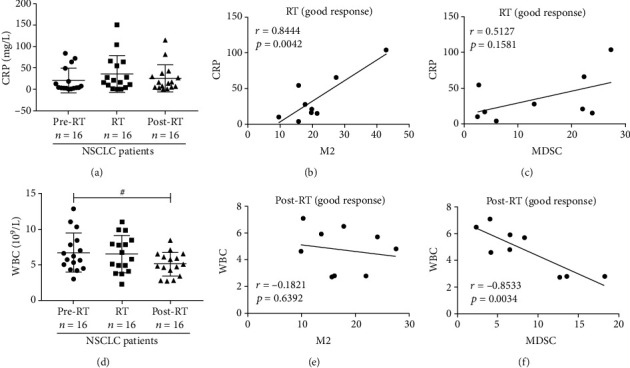
Results: In comparison with healthy controls, the percentages of MDSCs and CD68+CD163+M2-like macrophages of NSCLC patients were significantly elevated and were distinctly higher in radiotherapy than in preradiotherapy. MDSCs were correlated positively with CD68+CD163+M2-like macrophages in NSCLC patients in radiotherapy and postradiotherapy. Especially, we found that in comparison with those in the poor group, the percentages of two cells in the good response group were markedly increased during radiotherapy and they had a significantly positive correlation. During radiotherapy, the proportions of MDSCs were clearly increased in adenocarcinoma patients and the percentages of CD68+CD163+M2-like macrophages were markedly elevated in squamous carcinoma patients. We found that after radiotherapy, the expressions of eotaxin, MIP-1β, MCP-1, and BLC were significantly increased in NSCLC patients. Further results showed that the low levels of eotaxin and TNF RII expression before radiotherapy could predict a good therapeutic response. IL-1ra and MIP-1β had a positive relation with MDSCs or CD68+CD163+M2-like macrophages in NSCLC patients during radiotherapy, and eotaxin was correlated with CD68+CD163+M2-like macrophages but not MDSCs in NSCLC patients after radiotherapy.

Conclusions: MDSCs and CD68+CD163+M2-like macrophages serve as therapeutic response biomarkers and are associated with the expressions of plasma inflammatory cytokines for NSCLC patients during radiotherapy.


Conflict of interest statement

The authors declare that they have no competing interests.

Figures

Figure 1
Figure 1
Peripheral MDSCs and CD68+CD163+M2-like macrophages in HC and NSCLC patients. (a, b) Representative dot plots and peak plots of CD11b+CD33+HLA-DR MDSCs and CD68+CD163+M2-like macrophages in HC and NSCLC patients. (c, d) The percentages of peripheral MDSCs and CD68+CD163+M2-like macrophages were significantly elevated in NSCLC patients. p < 0.05, ∗∗p < 0.01, and ∗∗∗p < 0.001, compared to HC in two-tailed Student's t-test. #p < 0.05. The bars denote mean ± SD.
Figure 2
Figure 2
The correlation between peripheral MDSCs and CD68+CD163+M2-like macrophages in HC and NSCLC patients. (a) The relationship between peripheral MDSCs and CD68+CD163+M2-like macrophages in HC. The correlation between MDSCs and CD68+CD163+M2-like macrophages in NSCLC patients among (b) pre-RT, (c) RT, and (d) post-RT group. Data were analyzed by Pearson's correlation test.
Figure 3
Figure 3
The percentages of MDSCs and CD68+CD163+M2-like macrophages of NSCLC patients in various clinical characteristics. (a, b) The proportions of MDSCs and CD68+CD163+M2-like macrophages in NSCLC patients with or without metastasis. (c, d) The percentages of MDSCs and CD68+CD163+M2-like macrophages in NSCLC patients with a different radiotherapy area. (e, f) The proportions of MDSCs and CD68+CD163+M2-like macrophages in NSCLC patients with diverse pathologic types. p < 0.05, ∗∗p < 0.01, and ∗∗∗p < 0.001, compared to the HC group in two-tailed Student's t-test. #p < 0.05. The bars denote mean ± SD.
Figure 4
Figure 4
The ROC curve analysis about MDSCs and CD68+CD163+M2-like macrophages in NSCLC diagnosis and radiotherapy. (a) The ROC curve analysis in NSCLC diagnosis. (b) The ROC curve analysis in NSCLC radiotherapy.
Figure 5
Figure 5
The therapeutic response role of the percentages of MDSCs and CD68+CD163+M2-like macrophages of NSCLC patients. (a, c) The percentages of CD68+CD163+M2-like macrophages of good and poor groups in pre-RT, RT, and post-RT. (b, d) The frequencies of MDSCs of good and poor in pre-RT, RT, and post-RT. (e, f) The correlation between MDSCs and CD68+CD163+M2-like macrophages of NSCLC patients of the good and poor groups during radiotherapy. #p < 0.05. Data were analyzed by Pearson's correlation test. The bars denote mean ± SD.
Figure 6
Figure 6
The crossed correlation analysis of CRP and WBCs with MDSCs and CD68+CD163+ M2-like macrophages in NSCLC patients. (a) The bar graph of the expressions of CRPs in NSCLC patients of pre-RT, RT, and post-RT groups. (b, c) The correlation of CRPs of the good response group with CD68+CD163+ M2-like macrophages and MDSCs of NSCLC patients during radiotherapy. (d) The plot of the expressions of WBCs in NSCLC patients of pre-RT, RT, and post-RT groups. (e, f) The correlation of WBCs of the good response group with CD68+CD163+M2-like macrophages and MDSCs of NSCLC patients after radiotherapy. #p < 0.05. Data were analyzed by Pearson's correlation test.
Figure 7
Figure 7
The expressions of plasma cytokines in HC and NSCLC patients. (a–d) The expressions of eotaxin, MCP-1, BLC, and MIP-1β in HC and NSCLC patients. (e, f) Histogram of the expressions of eotaxin and TNF RII in the good and poor response groups. p < 0.05, ∗∗p < 0.01, ∗∗∗p < 0.001, and ∗∗∗∗p < 0.0001 compared with the HC group. #p < 0.05 and ##p < 0.01. The bars denote mean ± SD.
Figure 8
Figure 8
Correlation between the expressions of plasma cytokines and MDSCs as well as CD68+CD163+M2-like macrophages of NSCLC patients in RT and post-RT groups. (a–d) The expressions of MDSCs were correlated with IL-1ra, MIP-1β, TIMP-2, and TNF RI in NSCLC patients during radiotherapy. (e–h) The expressions of CD68+CD163+M2-like macrophages were correlated with IL-1ra, MIP-1β, IL-6, and IL-12p40 in NSCLC patients during radiotherapy. (i) Correlation between the expression of MDSCs and MIP-1d after radiotherapy. (j) Correlation between the expression of M2-like macrophage and eotaxin after radiotherapy. Data were analyzed by Pearson's correlation test.

Similar articles

Cited by

References

    1. Bray F., Ferlay J., Soerjomataram I., Siegel R. L., Torre L. A., Jemal A. Global cancer statistics 2018: GLOBOCAN estimates of incidence and mortality worldwide for 36 cancers in 185 countries. CA: A Cancer Journal for Clinicians . 2018;68(6):394–424. doi: 10.3322/caac.21492. - DOI - PubMed
    1. Torre L. A., Bray F., Siegel R. L., Ferlay J., Lortet-Tieulent J., Jemal A. Global cancer statistics, 2012. CA: A Cancer Journal for Clinicians . 2015;65(2):87–108. doi: 10.3322/caac.21262. - DOI - PubMed
    1. Gridelli C., Rossi A., Carbone D. P., et al. Non-small-cell lung cancer. Nature Reviews. Disease Primers . 2015;1(1, article 15009) doi: 10.1038/nrdp.2015.9. - DOI - PubMed
    1. Siegel R. L., Miller K. D., Jemal A. Cancer statistics, 2016. CA: A Cancer Journal for Clinicians . 2016;66(1):7–30. doi: 10.3322/caac.21332. - DOI - PubMed
    1. Kalman N. S., Weiss E., Walker P. R., Rosenman J. G. Local radiotherapy intensification for locally advanced non-small-cell lung cancer - a call to arms. Clinical Lung Cancer . 2018;19(1):17–26. doi: 10.1016/j.cllc.2017.05.024. - DOI - PubMed

MeSH terms