. 2022 Jul;9(4):044004.
doi: 10.1117/1.JMI.9.4.044004. Epub 2022 Aug 1.

High-dynamic-range micro-CT for nondestructive testing of titanium 3D-printed medical components

Affiliations

High-dynamic-range micro-CT for nondestructive testing of titanium 3D-printed medical components

Santiago Fabian Cobos et al. J Med Imaging (Bellingham). 2022 Jul.

Abstract

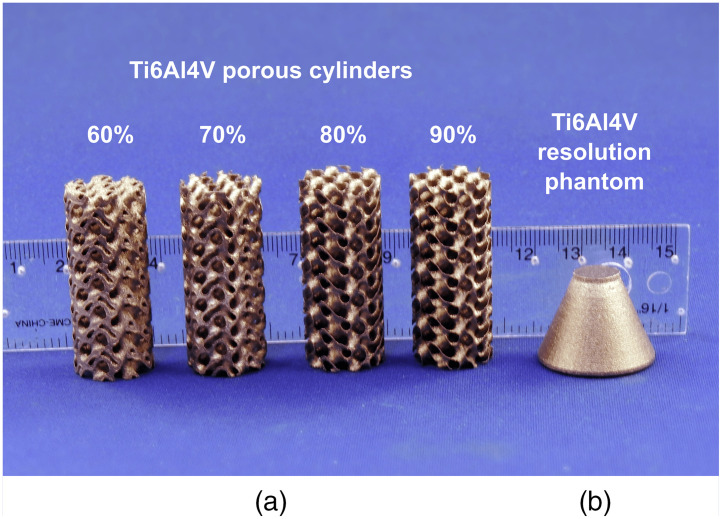
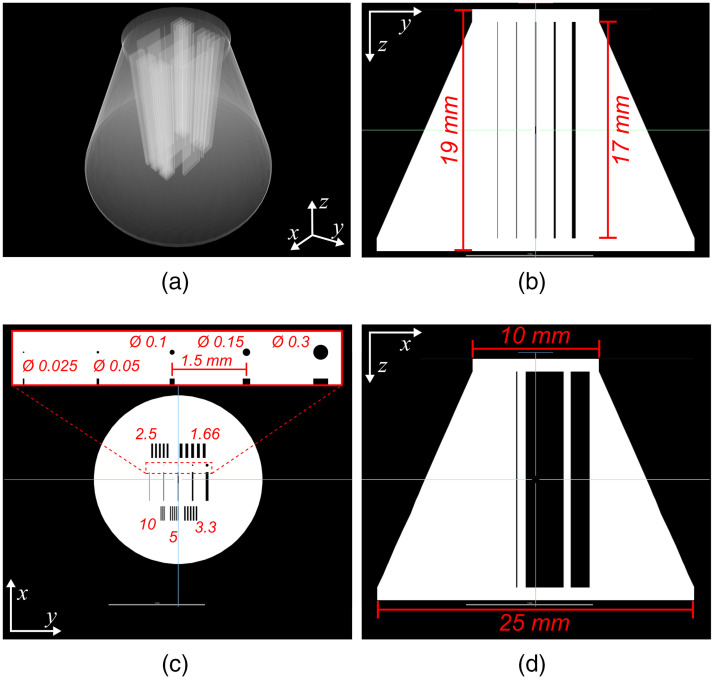
Purpose: Industrial microcomputed tomography (micro-CT) scanners are suitable for nondestructive testing (NDT) of metal, 3D-printed medical components. Typically, these scanners are equipped with high-energy sources that require heavy shielding and costly infrastructure to operate safely, making routine NDT of medical components prohibitively expensive. Alternatively, fixed-current, low-cost x-ray units could be implemented to perform CT-based NDT of 3D-printed medical parts in a subset of cases, if there is sufficient x-ray transmission for the CT reconstruction. A lack of signal-caused by areas of high attenuation in two-dimensional-projection images of metal objects-leads to artifacts that can make an image-based NDT unreliable. We present the implementation of a dual-exposure technique devised to extend the dynamic range (DR) of a commercially available CT scanner equipped with a low-cost low-energy (80 kV) x-ray unit, increasing the signal-to-noise ratio of highly attenuated areas for NDT of 3D-printed medical components. Approach: Our high-dynamic-range CT (HDR-CT) technique adequately combines projection images acquired at two exposure levels by modifying the integration times of each protocol. We evaluate the performance and limitations of this HDR-CT technique by imaging a series of titanium-alloy test-samples. One of the test-samples was a resolution and conspicuity phantom designed to assess the improvements in void visualization of the proposed methodology. The other test-samples were four porous cylinders, 17 × 40 mm , with 60%, 70%, 80%, and 90% nominal internal porosities. Results: Our HDR-CT technique adequately combines projection images acquired at two exposure levels by modifying the integration times of each protocol. Our results demonstrate that the 12-bit native DR of the CT scanner was increased to effective values of between 14 and 16 bits. Conclusions: The HDR-CT reconstructions showed improved contrast-to-noise and void conspicuity, when compared with conventional CT scans. This extension of DR has the potential to improve defect visualization during NDT of medium-size, titanium-alloy, 3D-printed medical components.

Keywords: additive manufacturing; high-dynamic-range radiography; laser powder bed fusion; micro-CT imaging; nondestructive testing; x-ray imaging.


Figures

Fig. 1
Fig. 1
Test samples scanned in this project. (a) Titanium-alloy, gyroid-based, and cylindrical samples with porosity fractions of 60%, 70%, 80%, and 90%. (b) Titanium-alloy, resolution, and conspicuity phantom. The internal features of this resolution phantom are shown in Fig. 2.
Fig. 2
Fig. 2
Detailed schematics of the titanium-alloy, resolution, and conspicuity phantom. (a) Perspective view of the 3D-rendering of the CAD with a transparency filter. (b) Central, trans-coronal, synthetic slice of the phantom’s CAD. (c) Central, trans-axial, synthetic slice of the phantom’s CAD, showing the details of the internal voids. The bar patterns are described in lp mm1. All other measurements are shown in mm. (d) Central, trans-sagittal synthetic slice of the phantom’s CAD.
Fig. 3
Fig. 3
Projection images used to generate HDR data showing the location of the 95% saturation and 75% saturation threshold boundaries. (a) Projection image of the titanium-alloy, resolution phantom acquired using the EV0 protocol. (b) Projection image of the titanium-alloy, resolution phantom acquired using the EV4 protocol.
Fig. 4
Fig. 4
Scaling factors [Eq. (1)] for matching the intensity of EV0 projection images to EVn as a function of projection angle for the 60% porosity cylinder for: (a) the EV0, EV2 HDR pair and (b) the EV0, EV3 HDR pair, and for the resolution and conspicuity phantom for: (c) the EV0, EV2 HDR pair; (d) the EV0, EV3 HDR pair; and (e) the EV0, EV4 HDR pair.
Fig. 5
Fig. 5
HDR strategy for the combination of EV0 with EVn projection images. (a) Dark-corrected, EV0 projection image of the resolution and conspicuity phantom, scaled to match the intensity values of EV4 (i.e., intensity-matched, IM EV0). Due to a long ray path through the metal in the central region of the phantom, pixels were underexposed in the EV0 image and were discarded from the final HDR projection image. (b) Corresponding, dark-corrected EV4 projection, showing regions with saturated pixels and valid data. (c) Line-profile through pixels marked by the red-dotted line in (a) and (b) showing the sin2+cos2, weighted-average combination strategy for pixels with intensity values between the 95% (t95) and 75% (t75) saturation thresholds.
Fig. 6
Fig. 6
Results of the CT reconstructions for the 60% titanium-alloy, porous cylinder. (a)–(c) A trans-axial slice through the data for the conventional-DR, the EV0 EV2 pair, and the EV0 EV3 pair, respectively. (d) A 3D-rendering of the data in a perspective view. (e) and (f) The voxel values through a line-profile following the red-dotted line in (a) to compare the differences in SNR between datasets.
Fig. 7
Fig. 7
Results of the CT reconstructions for the 70% and 80% titanium-alloy, porous cylinders. (a) and (b) A trans-axial slice through the 70% porous cylinder for the conventional-DR and the EV0 EV3 pair, respectively. (d) and (e) A trans-axial slice through the 80% porous cylinder for the conventional-DR and the EV0 EV2 pair, respectively. (c) and (f) The voxel values through a line-profile following the red-dotted line in (a) and (d) to compare the differences in SNR between the respective datasets.
Fig. 8
Fig. 8
CT reconstructions for the resolution and conspicuity phantom. (a), (b), (d), and (e) A trans-coronal slice through the reconstructed data for the conventional-DR, the EV0 EV2, the EV0 EV3, and EV0 EV4 pairs, respectively. The red arrows in these images describe the location of the void conspicuity limit for the 30- and the 300-μm-wide prismatic voids. The red horizontal lines mark the void conspicuity limit reached by the immediately shorter HDR reconstruction. The red circle in (e) shows the location of a discontinuity artifact for the EV0 EV4 dataset. (c) A 3D rendering of a perspective view of the EV0 EV3 HDR reconstruction with the top portion of the phantom clipped at the level marked in (a). (f) The intensity values of voxels in a profile-line located along the longitudinal axis of the phantom and within the 300  μm wide prismatic void.

Similar articles

References

    1. De Chiffre L., et al. , “Industrial applications of computed tomography,” CIRP Ann. 63(2), 655–677 (2014)CIRAAT10.1016/j.cirp.2014.05.011 - DOI
    1. Ewert U., Fuchs T., “Progress in digital industrial radiology. Pt. 2, Computed tomography (CT),” Badania Nieniszczące i Diagnostyka, 7–14 (2017).10.26357/BNID.2017.018 - DOI
    1. du Plessis A., le Roux S. G., Guelpa A., “Comparison of medical and industrial x-ray computed tomography for non-destructive testing,” Case Stud. Nondestruct. Test. Eval. 6, 17–25 (2016).10.1016/j.csndt.2016.07.001 - DOI
    1. Lowther M., et al. , “Clinical, industrial, and research perspectives on powder bed fusion additively manufactured metal implants,” Addit. Manuf. 28, 565–584 (2019).10.1016/j.addma.2019.05.033 - DOI
    1. Fox T., et al. , “Dynamic range extension of x-ray imaging system used in non-invasive inspection of contraband in vehicles, involves amplifying identical samples of x-ray beams using respective gain values, and forming x-ray image,” US Patent 2005047546-A1 (2005).