Combining PET with MRI to improve predictions of progression from mild cognitive impairment to Alzheimer's disease: an exploratory radiomic analysis study
- PMID: 35928737
- PMCID: PMC9347042
- DOI: 10.21037/atm-21-4349
Combining PET with MRI to improve predictions of progression from mild cognitive impairment to Alzheimer's disease: an exploratory radiomic analysis study
Abstract
Background: This study aimed to explore the potential of a combination of 18F-fluorodeoxyglucose positron emission tomography (18F-FDG PET) and magnetic resonance imaging (MRI) to improve predictions of conversion from mild cognitive impairment (MCI) to Alzheimer's disease (AD). The predictive performances and specific associated biomarkers of these imaging techniques used alone (single-modality imaging) and in combination (dual-modality imaging) were compared.
Methods: This study enrolled 377 patients with MCI and 94 healthy control participants from 2 medical centers. Enrolment was based on the patients' brain MRI and PET images. Radiomic analysis was performed to evaluate the predictive performance of dual-modality 18F-FDG PET and MRI scans. Regions of interest (ROIs) were determined using an a priori brain atlas. Radiomic features in these ROIs were extracted from the MRI and 18F-FDG PET scan data. These features were either concatenated or used separately to select features and construct Cox regression models for prediction in each modality. Harrell's concordance index (C-index) was then used to assess the predictive accuracies of the resulting models, and correlations between the MRI and 18F-FDG PET features were evaluated.
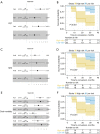
Results: The C-indices for the two test datasets were 0.77 and 0.80 for dual-modality 18F-FDG PET/MRI, 0.75 and 0.73 for single-modality 18F-FDG PET, and 0.74 and 0.76 for single-modality MRI. In addition, there was a significant correlation between the crucial image signatures of the different modalities.
Conclusions: These results indicate the value of imaging features in monitoring the progress of MCI in populations at high risk of developing AD. However, the incremental benefit of combining 18F-FDG PET and MRI is limited, and radiomic analysis of a single modality may yield acceptable predictive results.
Keywords: Cox model; Mild cognitive impairment (MCI); magnetic resonance imaging (MRI); positron emission tomography (PET); radiology.
2022 Annals of Translational Medicine. All rights reserved.
Conflict of interest statement
Conflicts of Interest: All authors have completed the ICMJE uniform disclosure form (available at https://atm.amegroups.com/article/view/10.21037/atm-21-4349/coif). The authors have no conflicts of interest to declare.
Figures


Similar articles
-
Dual-Model Radiomic Biomarkers Predict Development of Mild Cognitive Impairment Progression to Alzheimer's Disease.Front Neurosci. 2019 Jan 11;12:1045. doi: 10.3389/fnins.2018.01045. eCollection 2018. Front Neurosci. 2019. PMID: 30686995 Free PMC article.
-
Radiomics: a novel feature extraction method for brain neuron degeneration disease using 18F-FDG PET imaging and its implementation for Alzheimer's disease and mild cognitive impairment.Ther Adv Neurol Disord. 2019 Mar 29;12:1756286419838682. doi: 10.1177/1756286419838682. eCollection 2019. Ther Adv Neurol Disord. 2019. PMID: 30956687 Free PMC article.
-
Using radiomics-based modelling to predict individual progression from mild cognitive impairment to Alzheimer's disease.Eur J Nucl Med Mol Imaging. 2022 Jun;49(7):2163-2173. doi: 10.1007/s00259-022-05687-y. Epub 2022 Jan 15. Eur J Nucl Med Mol Imaging. 2022. PMID: 35032179
-
FDG-PET for Prediction of AD Dementia in Mild Cognitive Impairment. A Review of the State of the Art with Particular Emphasis on the Comparison with Other Neuroimaging Modalities (MRI and Perfusion SPECT).Curr Alzheimer Res. 2017;14(2):127-142. doi: 10.2174/1567205013666160629081956. Curr Alzheimer Res. 2017. PMID: 27357645 Review.
-
18F-FDG PET for Prediction of Conversion to Alzheimer's Disease Dementia in People with Mild Cognitive Impairment: An Updated Systematic Review of Test Accuracy.J Alzheimers Dis. 2018;64(4):1175-1194. doi: 10.3233/JAD-171125. J Alzheimers Dis. 2018. PMID: 30010119 Free PMC article.
Cited by
-
Beyond Macrostructure: Is There a Role for Radiomics Analysis in Neuroimaging ?Magn Reson Med Sci. 2024 Jul 1;23(3):367-376. doi: 10.2463/mrms.rev.2024-0053. Epub 2024 Jun 14. Magn Reson Med Sci. 2024. PMID: 38880615 Free PMC article. Review.
-
The Alzheimer's Disease Neuroimaging Initiative in the era of Alzheimer's disease treatment: A review of ADNI studies from 2021 to 2022.Alzheimers Dement. 2024 Jan;20(1):652-694. doi: 10.1002/alz.13449. Epub 2023 Sep 12. Alzheimers Dement. 2024. PMID: 37698424 Free PMC article. Review.
-
Early detection and classification of Alzheimer's disease through data fusion of MRI and DTI images using the YOLOv11 neural network.Front Neurosci. 2025 Mar 11;19:1554015. doi: 10.3389/fnins.2025.1554015. eCollection 2025. Front Neurosci. 2025. PMID: 40134415 Free PMC article.
-
Radiomics insight into the neurodegenerative "hot" brain: A narrative review from the nuclear medicine perspective.Front Nucl Med. 2023 Feb 27;3:1143256. doi: 10.3389/fnume.2023.1143256. eCollection 2023. Front Nucl Med. 2023. PMID: 39355054 Free PMC article. Review.
-
Age- and Sex-Specific Gut Microbiota Signatures Associated with Dementia-Related Brain Pathologies: An LEfSe-Based Metagenomic Study.Brain Sci. 2025 Jun 5;15(6):611. doi: 10.3390/brainsci15060611. Brain Sci. 2025. PMID: 40563782 Free PMC article.
References
-
- Sanchez-Catasus CA, Stormezand GN, van Laar PJ, et al. . FDG-PET for Prediction of AD Dementia in Mild Cognitive Impairment. A Review of the State of the Art with Particular Emphasis on the Comparison with Other Neuroimaging Modalities (MRI and Perfusion SPECT). Curr Alzheimer Res 2017;14:127-42. 10.2174/1567205013666160629081956 - DOI - PubMed
Grants and funding
LinkOut - more resources
Full Text Sources
