

Investigation of CACNA1I Cav3.3 Dysfunction in Hemiplegic Migraine
- PMID: 35928792
- PMCID: PMC9345121
- DOI: 10.3389/fnmol.2022.892820
Investigation of CACNA1I Cav3.3 Dysfunction in Hemiplegic Migraine
Abstract
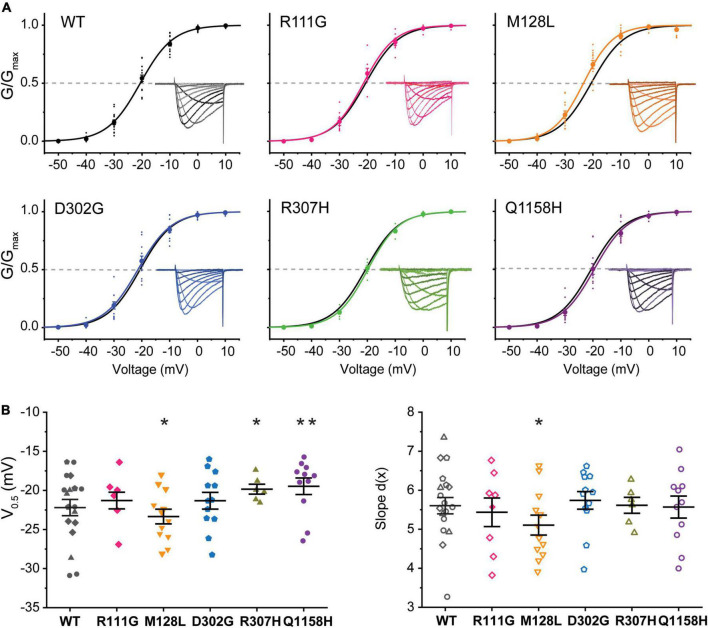
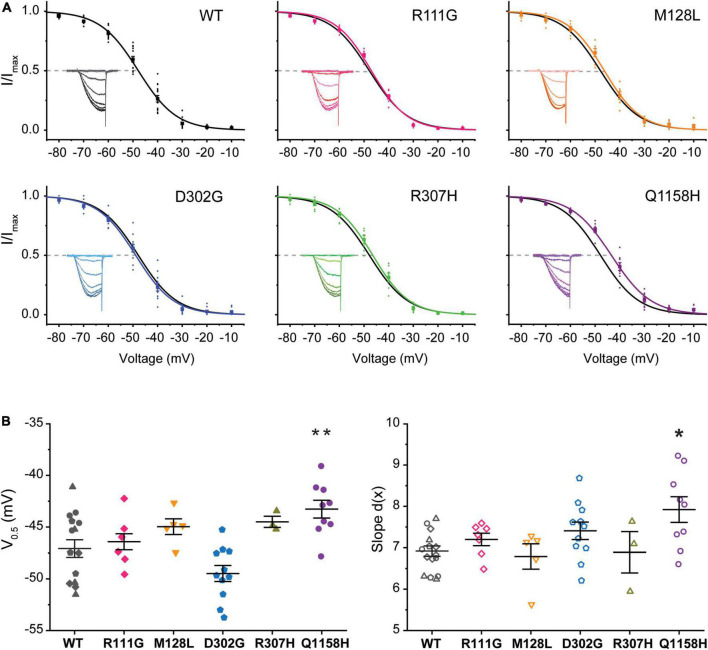
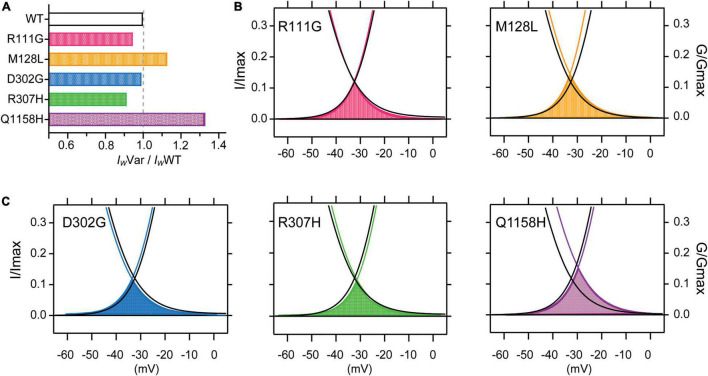
Familial hemiplegic migraine (FHM) is a severe neurogenetic disorder for which three causal genes, CACNA1A, SCN1A, and ATP1A2, have been implicated. However, more than 80% of referred diagnostic cases of hemiplegic migraine (HM) are negative for exonic mutations in these known FHM genes, suggesting the involvement of other genes. Using whole-exome sequencing data from 187 mutation-negative HM cases, we identified rare variants in the CACNA1I gene encoding the T-type calcium channel Cav3.3. Burden testing of CACNA1I variants showed a statistically significant increase in allelic burden in the HM case group compared to gnomAD (OR = 2.30, P = 0.00005) and the UK Biobank (OR = 2.32, P = 0.0004) databases. Dysfunction in T-type calcium channels, including Cav3.3, has been implicated in a range of neurological conditions, suggesting a potential role in HM. Using patch-clamp electrophysiology, we compared the biophysical properties of five Cav3.3 variants (p.R111G, p.M128L, p.D302G, p.R307H, and p.Q1158H) to wild-type (WT) channels expressed in HEK293T cells. We observed numerous functional alterations across the channels with Cav3.3-Q1158H showing the greatest differences compared to WT channels, including reduced current density, right-shifted voltage dependence of activation and inactivation, and slower current kinetics. Interestingly, we also found significant differences in the conductance properties exhibited by the Cav3.3-R307H and -Q1158H variants compared to WT channels under conditions of acidosis and alkalosis. In light of these data, we suggest that rare variants in CACNA1I may contribute to HM etiology.
Keywords: CACNA1I; Cav3.3; T-type calcium channels; familial hemiplegic migraine; hemiplegic migraine; ion channel; migraine genetics; voltage gated calcium channels.
Copyright © 2022 Maksemous, Blayney, Sutherland, Smith, Lea, Tran, Ibrahim, McArthur, Haupt, Cader, Finol-Urdaneta, Adams and Griffiths.
Conflict of interest statement
The authors declare that the research was conducted in the absence of any commercial or financial relationships that could be construed as a potential conflict of interest.
Figures
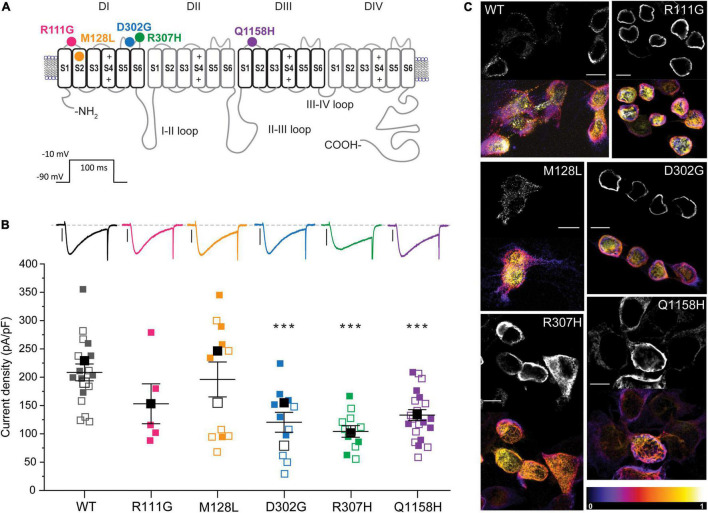
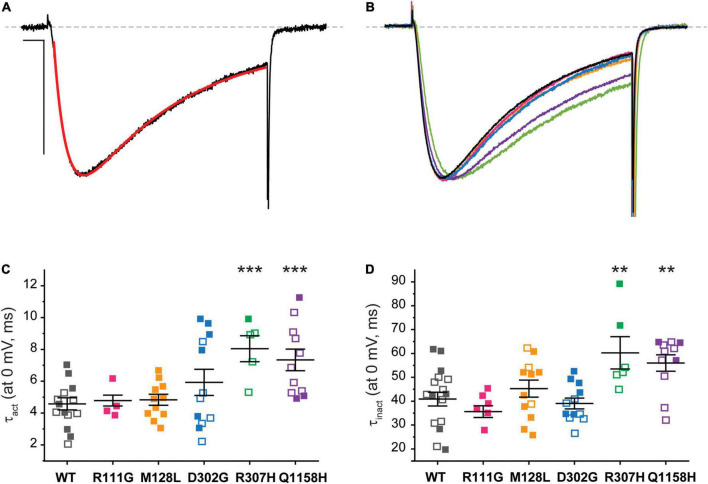
 ), M128L (
 ), D302G (
 ), R307H (
 ), and Q1158H (
 ). (B)
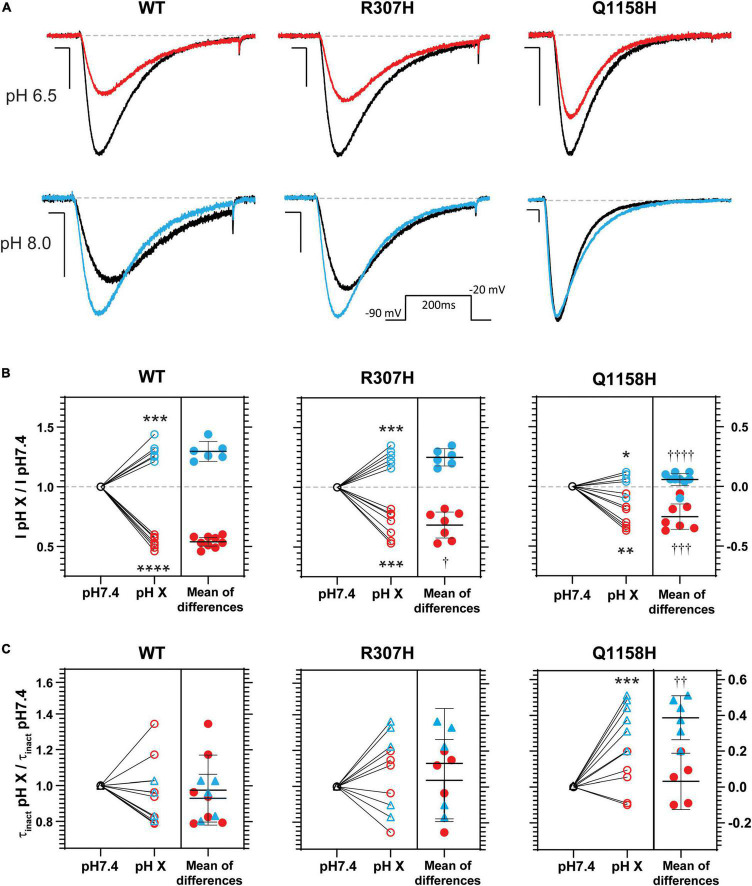
 ; pH 8.0:
  ; difference between pH 6.5:
  , or pH 8.0:
  ). (C) Relative changes in inactivation time constant (τinact pH X/τinact pH7.4) for WT and HM-associated Cav3.3 variants (pH 7.4: ○;, △; pH 6.5: ; pH 8.0:
  ; difference between pH 6.5: , or pH 8.0:
  ). In (B,C) paired t-test for pH 7.4 vs. pH X: *p ≤ 0.05; **p ≤ 0.05; ***p < 0.005; ****p < 0.0005. One-way ANOVA with Tukey’s multiple comparisons test for WT vs. variant: †p ≤ 0.05; ††p ≤ 0.05; †††p ≤ 0.005; ††††p ≤ 0.0001.
References
Grants and funding
LinkOut - more resources
Full Text Sources