Predictive value of PIMREG in the prognosis and response to immune checkpoint blockade of glioma patients
- PMID: 35928818
- PMCID: PMC9344140
- DOI: 10.3389/fimmu.2022.946692
Predictive value of PIMREG in the prognosis and response to immune checkpoint blockade of glioma patients
Abstract
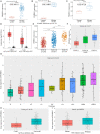
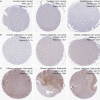
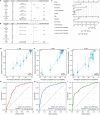
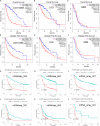
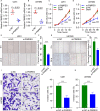
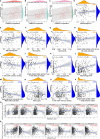
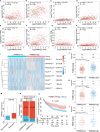
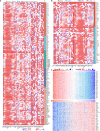
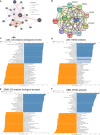
Glioma is the most common primary brain tumor in the human brain. The present study was designed to explore the expression of PIMREG in glioma and its relevance to the clinicopathological features and prognosis of glioma patients. The correlations of PIMREG with the infiltrating levels of immune cells and its relevance to the response to immunotherapy were also investigated. PIMREG expression in glioma was analyzed based on the GEO, TCGA, and HPA databases. Kaplan-Meier survival analysis was used to examine the predictive value of PIMREG for the prognosis of patients with glioma. The correlation between the infiltrating levels of immune cells in glioma and PIMREG was analyzed using the CIBERSORT algorithm and TIMRE database. The correlation between PIMREG and immune checkpoints and its correlation with the patients' responses to immunotherapy were analyzed using R software and the GEPIA dataset. Cell experiments were conducted to verify the action of PIMREG in glioma cell migration and invasion. We found that PIMREG expression was upregulated in gliomas and positively associated with WHO grade. High PIMREG expression was correlated with poor prognosis of LGG, prognosis of all WHO grade gliomas, and prognosis of recurrent gliomas. PIMREG was related to the infiltration of several immune cell types, such as M1 and M2 macrophages, monocytes and CD8+ T cells. Moreover, PIMREG was correlated with immune checkpoints in glioma and correlated with patients' responses to immunotherapy. KEGG pathway enrichment and GO functional analysis illustrated that PIMREG was related to multiple tumor- and immune-related pathways. In conclusion, PIMREG overexpression in gliomas is associated with poor prognosis of patients with glioma and is related to immune cell infiltrates and the responses to immunotherapy.
Keywords: PIMREG; glioma; immune cell infiltrates; immune checkpoint; immune checkpoint blockade (ICB) therapy.
Copyright © 2022 Zhu, Hu, Feng, Gu, Jian, Zou and Xiong.
Conflict of interest statement
The authors declare that the research was conducted in the absence of any commercial or financial relationships that could be construed as a potential conflict of interest.
Figures
Similar articles
-
SYT16 is a prognostic biomarker and correlated with immune infiltrates in glioma: A study based on TCGA data.Int Immunopharmacol. 2020 Jul;84:106490. doi: 10.1016/j.intimp.2020.106490. Epub 2020 Apr 11. Int Immunopharmacol. 2020. PMID: 32289666
-
PLEKHA4 Is a Prognostic Biomarker and Correlated with Immune Infiltrates in Glioma.Biomed Res Int. 2023 Jan 17;2023:4504474. doi: 10.1155/2023/4504474. eCollection 2023. Biomed Res Int. 2023. PMID: 36714030 Free PMC article.
-
Elevated TYROBP expression predicts poor prognosis and high tumor immune infiltration in patients with low-grade glioma.BMC Cancer. 2021 Jun 23;21(1):723. doi: 10.1186/s12885-021-08456-6. BMC Cancer. 2021. PMID: 34162355 Free PMC article.
-
A Systematic Review of the Tumor-Infiltrating CD8+ T-Cells/PD-L1 Axis in High-Grade Glial Tumors: Toward Personalized Immuno-Oncology.Front Immunol. 2021 Sep 17;12:734956. doi: 10.3389/fimmu.2021.734956. eCollection 2021. Front Immunol. 2021. PMID: 34603316 Free PMC article.
-
Mutational burden and immune recognition of gliomas.Curr Opin Oncol. 2021 Nov 1;33(6):626-634. doi: 10.1097/CCO.0000000000000787. Curr Opin Oncol. 2021. PMID: 34651608 Review.
Cited by
-
Predictive value of procollagen c-protease enhancer protein on the prognosis of glioma patients.Heliyon. 2024 Mar 17;10(6):e28089. doi: 10.1016/j.heliyon.2024.e28089. eCollection 2024 Mar 30. Heliyon. 2024. PMID: 38533063 Free PMC article.
-
CSF3R as a potential prognostic biomarker and immunotherapy target in glioma.Cent Eur J Immunol. 2024;49(2):155-168. doi: 10.5114/ceji.2024.140651. Epub 2024 Jun 21. Cent Eur J Immunol. 2024. PMID: 39381559 Free PMC article.
-
TGF-β-activated circRYK drives glioblastoma progression by increasing VLDLR mRNA expression and stability in a ceRNA- and RBP-dependent manner.J Exp Clin Cancer Res. 2024 Mar 8;43(1):73. doi: 10.1186/s13046-024-03000-3. J Exp Clin Cancer Res. 2024. PMID: 38454465 Free PMC article.
-
Low expression of ACOT13 predicts poor prognosis and immunotherapy outcome in ovarian cancer.Am J Transl Res. 2024 Apr 15;16(4):1424-1441. doi: 10.62347/OIQB4997. eCollection 2024. Am J Transl Res. 2024. PMID: 38715807 Free PMC article.
-
APOL4, a Novel Immune-Related Prognostic Biomarker for Glioma.J Clin Med. 2022 Sep 29;11(19):5765. doi: 10.3390/jcm11195765. J Clin Med. 2022. PMID: 36233633 Free PMC article.
References
Publication types
MeSH terms
Substances
LinkOut - more resources
Full Text Sources
Medical
Research Materials

