

Functional Properties of Protein Hydrolysates on Growth, Digestive Enzyme Activities, Protein Metabolism, and Intestinal Health of Larval Largemouth Bass (Micropterus salmoides)
- PMID: 35928824
- PMCID: PMC9343713
- DOI: 10.3389/fimmu.2022.913024
Functional Properties of Protein Hydrolysates on Growth, Digestive Enzyme Activities, Protein Metabolism, and Intestinal Health of Larval Largemouth Bass (Micropterus salmoides)
Abstract
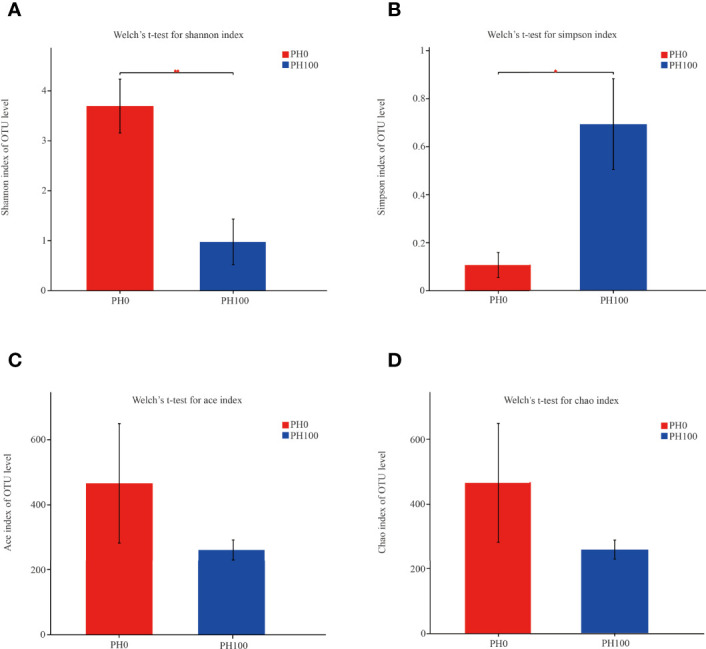
The present study was conducted to investigate the effects of dietary inclusion of protein hydrolysates on growth performance, digestive enzyme activities, protein metabolism, and intestinal health in larval largemouth bass (Micropterus salmoides). The experimental feeding trial presented in this study was based on five isonitrogenous and isolipidic diets formulated with graded inclusion levels of protein hydrolysates, and it showed that protein hydrolysates improved growth performance, reduced larval deformity rate, and increased the activity of digestive enzymes, including pepsin and trypsin. Gene expression results revealed that the supplementation of protein hydrolysates upregulated the expression of intestinal amino acid transporters LAT2 and peptide transporter 2 (PepT2), as well as the amino acid transporters LAT1 in muscle. Dietary provision of protein hydrolysates activated the target of rapamycin (TOR) pathway including the up-regulation of TOR and AKT1, and down-regulation of 4EBP1. Additionally, the expression of genes involved in the amino acids response (AAR) pathway, ATF4 and REDD1, were inhibited. Protein hydrolysates inhibited the transcription of some pro-inflammatory cytokines, including IL-8 and 5-LOX, but promoted the expression of anti-inflammatory cytokines TGF-β and IL-10. The 16S rRNA analysis, using V3-V4 region, indicated that dietary protein hydrolysates supplementation reduced the diversity of the intestine microbial community, increased the enrichment of Plesiomonas and reduced the enrichment of Staphylococcus at the genus level. In summary, protein hydrolysates have been shown to be an active and useful supplement to positively complement other protein sources in the diets for largemouth bass larvae, and this study provided novel insights on the beneficial roles and possible mechanisms of action of dietary protein hydrolysates in improving the overall performance of fish larvae.
Keywords: intestinal development; intestinal microbiota; larval fish; protein hydrolysates; protein metabolism.
Copyright © 2022 Sheng, Turchini, Xu, Fang, Chen, Xie, Zhang and Li.
Conflict of interest statement
The authors declare that the research was conducted in the absence of any commercial or financial relationships that could be construed as a potential conflict of interest.
Figures


Similar articles
-
Effects of Dietary Phospholipids on Growth Performance, Digestive Enzymes Activity and Intestinal Health of Largemouth Bass (Micropterus salmoides) Larvae.Front Immunol. 2022 Jan 11;12:827946. doi: 10.3389/fimmu.2021.827946. eCollection 2021. Front Immunol. 2022. PMID: 35087540 Free PMC article.
-
Intestinal morphology, immunity and microbiota response to dietary fibers in largemouth bass, Micropterus salmoide.Fish Shellfish Immunol. 2020 Aug;103:135-142. doi: 10.1016/j.fsi.2020.04.070. Epub 2020 May 11. Fish Shellfish Immunol. 2020. PMID: 32423866
-
Dietary sodium butyrate supplementation attenuates intestinal inflammatory response and improves gut microbiota composition in largemouth bass (Micropterus salmoides) fed with a high soybean meal diet.Fish Physiol Biochem. 2021 Dec;47(6):1805-1819. doi: 10.1007/s10695-021-01004-w. Epub 2021 Sep 14. Fish Physiol Biochem. 2021. PMID: 34518972
-
Effects of bioprocessed soybean meal and nucleotide supplementation on growth, physiology and histomorphology in largemouth bass, Micropterus salmoides, juveniles.Comp Biochem Physiol A Mol Integr Physiol. 2021 Oct;260:111038. doi: 10.1016/j.cbpa.2021.111038. Epub 2021 Jul 13. Comp Biochem Physiol A Mol Integr Physiol. 2021. PMID: 34271205 Review.
-
Dietary lipid levels affected antioxidative status, inflammation response, apoptosis and microbial community in the intestine of juvenile turbot (Scophthalmus maximus L.).Comp Biochem Physiol A Mol Integr Physiol. 2022 Feb;264:111118. doi: 10.1016/j.cbpa.2021.111118. Epub 2021 Nov 16. Comp Biochem Physiol A Mol Integr Physiol. 2022. PMID: 34793954 Review.
Cited by
-
A Novel Approach in the Development of Larval Largemouth Bass Micropterus salmoides Diets Using Largemouth Bass Muscle Hydrolysates as the Protein Source.Animals (Basel). 2023 Jan 21;13(3):373. doi: 10.3390/ani13030373. Animals (Basel). 2023. PMID: 36766261 Free PMC article.
-
Terrestrial Compound Protein Replacing Dietary Fishmeal Improved Digestive Enzyme Activity, Immune Response, Intestinal Microflora Composition, and Protein Metabolism of Golden Pompano (Trachinotus ovatus).Aquac Nutr. 2023 Oct 4;2023:2716724. doi: 10.1155/2023/2716724. eCollection 2023. Aquac Nutr. 2023. PMID: 37829512 Free PMC article.
-
The preferential utilization of hepatic glycogen as energy substrates in largemouth bass (Micropterus salmoides) under short-term starvation.Fish Physiol Biochem. 2024 Apr;50(2):785-796. doi: 10.1007/s10695-023-01285-3. Epub 2023 Dec 18. Fish Physiol Biochem. 2024. PMID: 38108936
-
Effects of Low Molecular Weight Duck Blood Protein Hydrolysate as a Feed Additive on the Intestinal Microbiome, Antioxidant Activity, and Humoral Immune and Inflammatory Responses in Flowerhorn Fish.Aquac Nutr. 2025 Apr 17;2025:9970984. doi: 10.1155/anu/9970984. eCollection 2025. Aquac Nutr. 2025. PMID: 40276584 Free PMC article.
-
Bioactive Peptides and Protein Hydrolysates as Lipoxygenase Inhibitors.Biology (Basel). 2023 Jun 27;12(7):917. doi: 10.3390/biology12070917. Biology (Basel). 2023. PMID: 37508348 Free PMC article. Review.
References
-
- Gisbert E, Rodriguez A, Castello-Orvay F, Williot P. A Histological Study of the Development of the Digestive Tract of Siberian Sturgeon (Acipenser Baeri) During Early Ontogeny. Aquaculture (1998) 167:195–209. doi: 10.1016/S0044-8486(98)00312-3 - DOI
-
- Cahu CL, Rønnestad I, Grangier V, Zambonio-Infante JL. Expression and Activities of Pancreatic Enzymes in Developing Sea Bass Larvae (Dicentrarchus Labrax) in Relation to Intact and Hydrolyzed Dietary Protein; Involvement of Cholecystokinin. Aquaculture (2004) 238:295–308. doi: 10.1016/j.aquaculture.2004.04.013 - DOI
-
- Johannsdottir J, Heimisdottir HL, Hakonardottir K, Hrolfsdottir L, Steinarsson A, Imsland AK, et al. . Improved Performance of Atlantic Cod (Gadus Morhua L.) Larvae Following Enhancement of Live Feed Using a Fish Protein Hydrolysate. Aquacult Nutr (2014) 20(3):314–23. doi: 10.1111/anu.12080 - DOI
-
- Ovissipour M, Kenari AA, Nazari R, Motamedzadegan A, Rasco B. Tuna Viscera Protein Hydrolysate: Nutritive and Disease Resistance Properties for Persian Sturgeon (Acipenser Persicus L.) Larvae. Aquac Res (2014) 45(4):591–601. doi: 10.1111/j.1365-2109.2012.03257.x - DOI
Publication types
MeSH terms
Substances
LinkOut - more resources
Full Text Sources
Research Materials
Miscellaneous