

The dynamic effects of maternal high-calorie diet on glycolipid metabolism and gut microbiota from weaning to adulthood in offspring mice
- PMID: 35928844
- PMCID: PMC9343994
- DOI: 10.3389/fnut.2022.941969
The dynamic effects of maternal high-calorie diet on glycolipid metabolism and gut microbiota from weaning to adulthood in offspring mice
Abstract
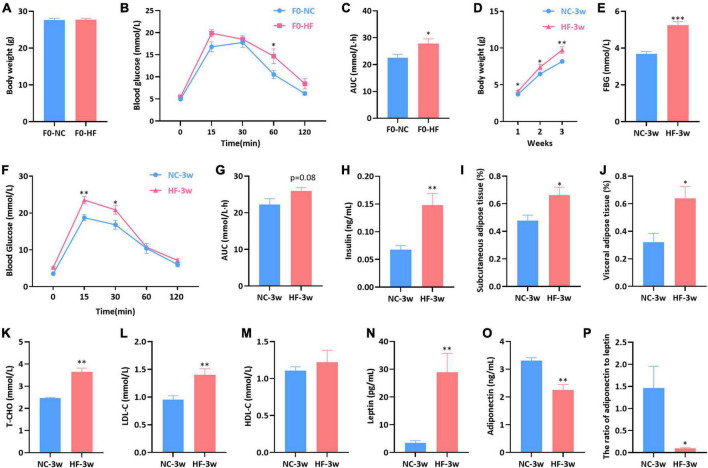
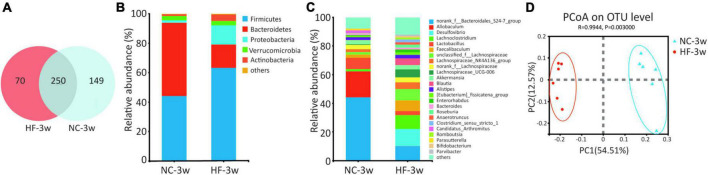
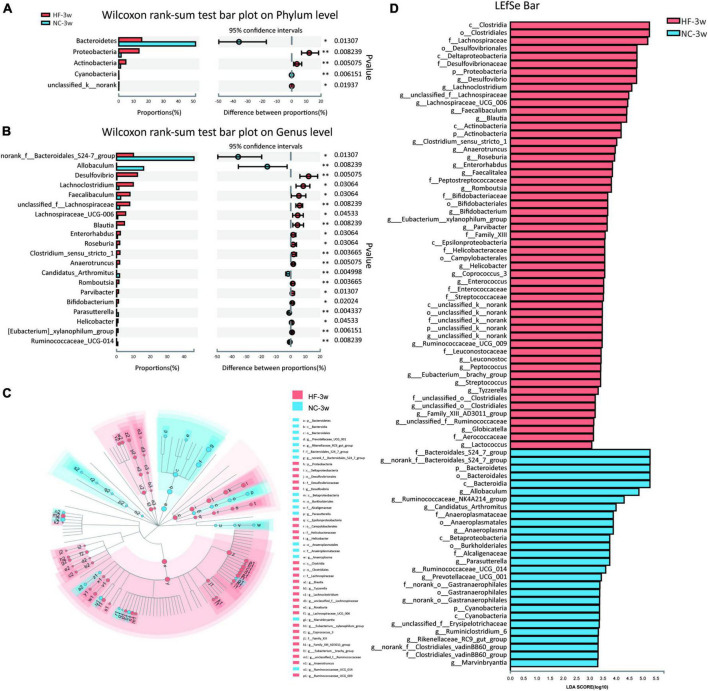
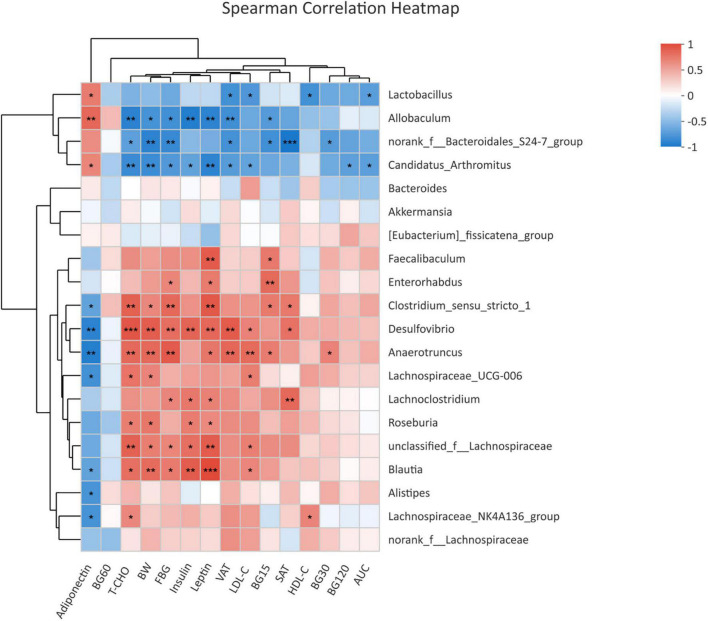
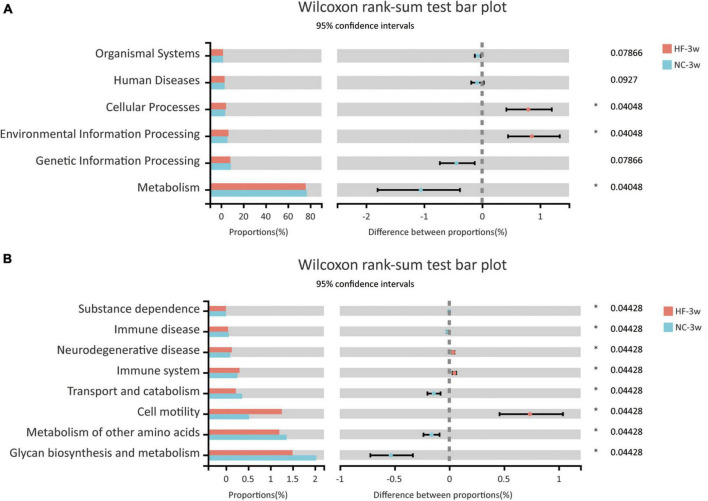
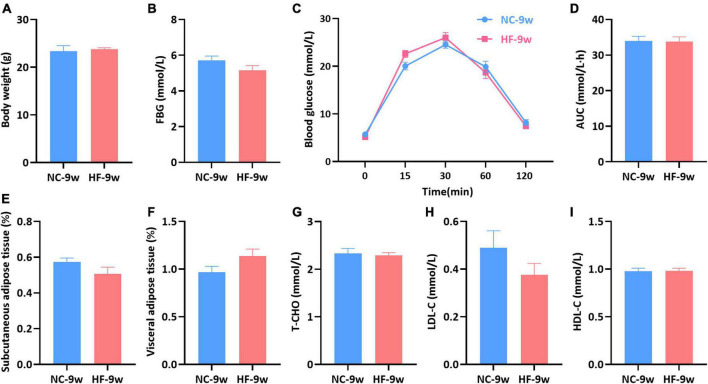
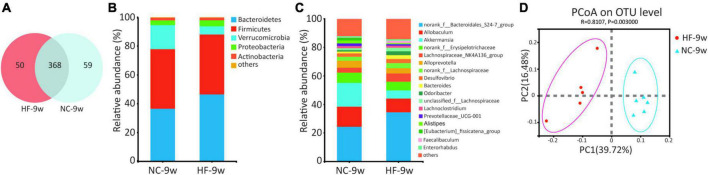
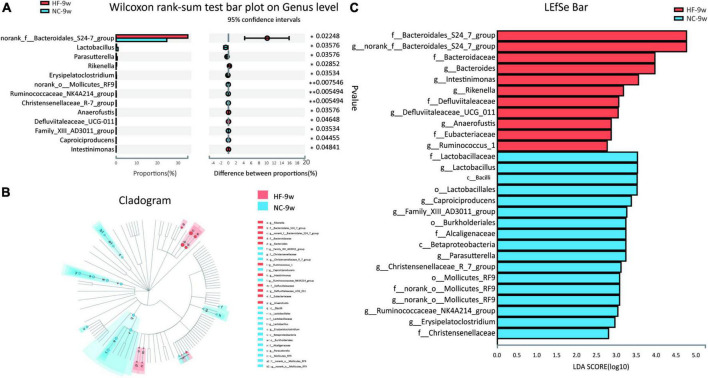
Dysbiosis of gut microbiota can contribute to the progression of diabetes and obesity. Previous studies have shown that maternal high-fat (HF) diet during the perinatal period can alter the microbiota and induce metabolic disorders at weaning. However, whether dysbiosis of gut microbiota and metabolism could be recovered by a normal diet after weaning and the dynamic changes of gut microbiota have not been fully studied. In this study, C57BL/6J female mice were fed with a normal chow (NC) or HF diet for 4 weeks preconception, during gestation, and until pup weaning. After weaning, male offspring were fed with an NC diet until 9 weeks of age. The microbiota of offspring at weaning and 9 weeks of age was collected for 16S rRNA gene amplicon sequencing. We found that dams fed with an HF diet showed glucose intolerance after lactation. Compared with the offspring from NC dams, the offspring from HF dams exhibited a higher body weight, hyperglycemia, glucose intolerance, hyperinsulinemia, hypercholesterolemia, and leptin resistance and lower adiponectin at weaning. Fecal analysis indicated altered microbiota composition between the offspring of the two groups. The decrease in favorable bacteria (such as norank f Bacteroidales S24-7 group) and increase in unfavorable bacteria (such as Lachnoclostridium and Desulfovibrio) were strongly associated with a disturbance of glucose and lipid metabolism. After 6 weeks of normal diet, no difference in body weight, glucose, and lipid profiles was observed between the offspring of the two groups. However, the microbiota composition of offspring in the HF group was still different from that in the NC group, and microbiota diversity was lower in offspring of the HF group. The abundance of Lactobacillus was lower in the offspring of the HF group. In conclusion, a maternal HF diet can induce metabolic homeostasis and gut microbiota disturbance in offspring at weaning. Gut microbiota dysbiosis can persist into adulthood in the offspring, which might have a role in the promotion of susceptibility to obesity and diabetes in the later life of the offspring.
Keywords: glucose metabolism; gut microbiota; lipid metabolism; maternal high-fat diet; offspring.
Copyright © 2022 Zheng, Zhang, Gao, Wu and Zhang.
Conflict of interest statement
The authors declare that the research was conducted in the absence of any commercial or financial relationships that could be construed as a potential conflict of interest.
Figures
Similar articles
-
The effects of maternal and post-weaning diet interaction on glucose metabolism and gut microbiota in male mice offspring.Biosci Rep. 2016 Jun 3;36(3):e00341. doi: 10.1042/BSR20160103. Print 2016 Jul. Biosci Rep. 2016. PMID: 27129301 Free PMC article.
-
Improved Glucose and Lipid Metabolism in the Early Life of Female Offspring by Maternal Dietary Genistein Is Associated With Alterations in the Gut Microbiota.Front Endocrinol (Lausanne). 2018 Sep 4;9:516. doi: 10.3389/fendo.2018.00516. eCollection 2018. Front Endocrinol (Lausanne). 2018. PMID: 30233500 Free PMC article.
-
Maternal Exercise Improves High-Fat Diet-Induced Metabolic Abnormalities and Gut Microbiota Profiles in Mouse Dams and Offspring.Front Cell Infect Microbiol. 2020 Jun 17;10:292. doi: 10.3389/fcimb.2020.00292. eCollection 2020. Front Cell Infect Microbiol. 2020. PMID: 32626663 Free PMC article.
-
Long-Term Effects of Maternal Low-Protein Diet and Post-weaning High-Fat Feeding on Glucose Metabolism and Hypothalamic POMC Promoter Methylation in Offspring Mice.Front Nutr. 2021 Aug 16;8:657848. doi: 10.3389/fnut.2021.657848. eCollection 2021. Front Nutr. 2021. PMID: 34485357 Free PMC article.
-
Mechanisms of Maternal Diet-Induced Obesity Affecting the Offspring Brain and Development of Affective Disorders.Metabolites. 2023 Mar 20;13(3):455. doi: 10.3390/metabo13030455. Metabolites. 2023. PMID: 36984895 Free PMC article. Review.
Cited by
-
Impact of maternal high-fat diet on offspring gut microbiota during short-term high-fat diet exposure in mice.Physiol Rep. 2024 Nov;12(21):e70111. doi: 10.14814/phy2.70111. Physiol Rep. 2024. PMID: 39489538 Free PMC article.
-
High-Carbohydrate Diet Consumption Poses a More Severe Liver Cholesterol Deposition than a High-Fat and High-Calorie Diet in Mice.Int J Mol Sci. 2023 Sep 28;24(19):14700. doi: 10.3390/ijms241914700. Int J Mol Sci. 2023. PMID: 37834148 Free PMC article.
-
Gut microbiota as a residual risk factor causally influencing cardiac structure and function: Mendelian randomization analysis and biological annotation.Front Microbiol. 2024 Jul 26;15:1410272. doi: 10.3389/fmicb.2024.1410272. eCollection 2024. Front Microbiol. 2024. PMID: 39132134 Free PMC article.
-
Interactions between host and gut microbiota in gestational diabetes mellitus and their impacts on offspring.BMC Microbiol. 2024 May 10;24(1):161. doi: 10.1186/s12866-024-03255-y. BMC Microbiol. 2024. PMID: 38730357 Free PMC article. Review.
-
Effects of maternal advanced lipoxidation end products diet on the glycolipid metabolism and gut microbiota in offspring mice.Front Nutr. 2024 Jun 19;11:1421848. doi: 10.3389/fnut.2024.1421848. eCollection 2024. Front Nutr. 2024. PMID: 38962449 Free PMC article.
References
LinkOut - more resources
Full Text Sources
Research Materials
Miscellaneous