. 2022 Jul 19:12:935093.
doi: 10.3389/fonc.2022.935093. eCollection 2022.

Interplay Between Immune and Cancer-Associated Fibroblasts: A Path to Target Metalloproteinases in Penile Cancer

Affiliations

Interplay Between Immune and Cancer-Associated Fibroblasts: A Path to Target Metalloproteinases in Penile Cancer

Sarah Santiloni Cury et al. Front Oncol. .

Abstract

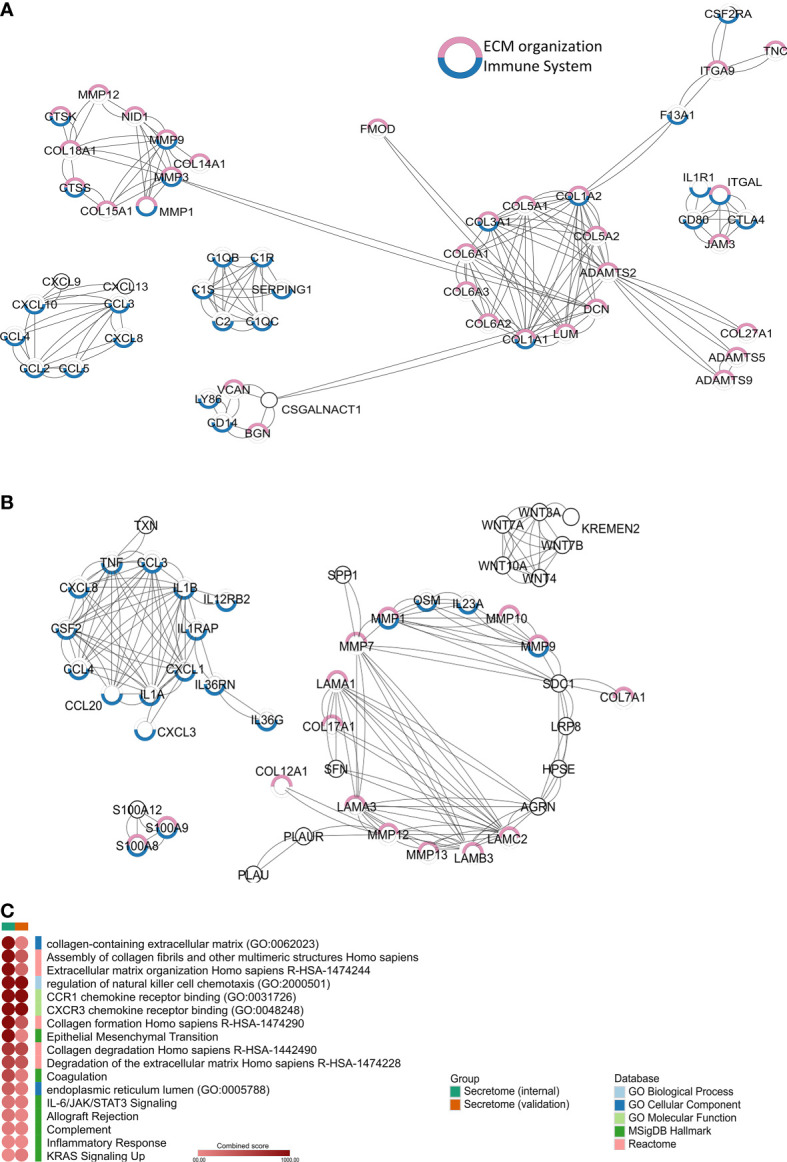
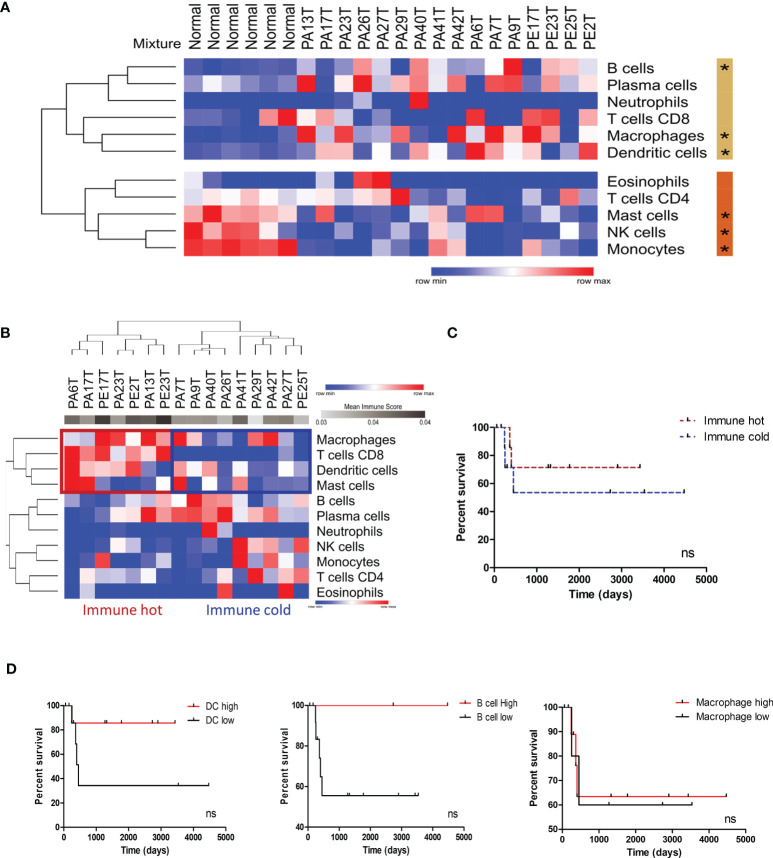
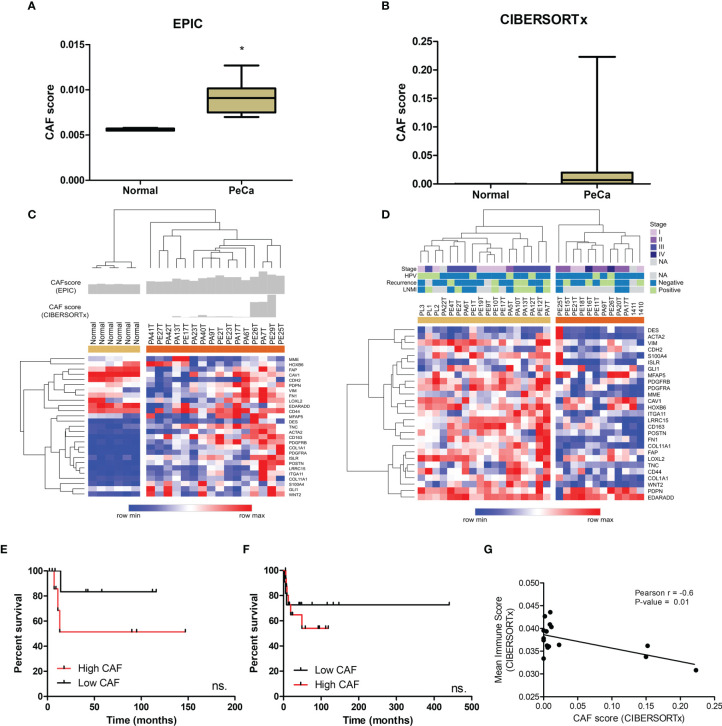
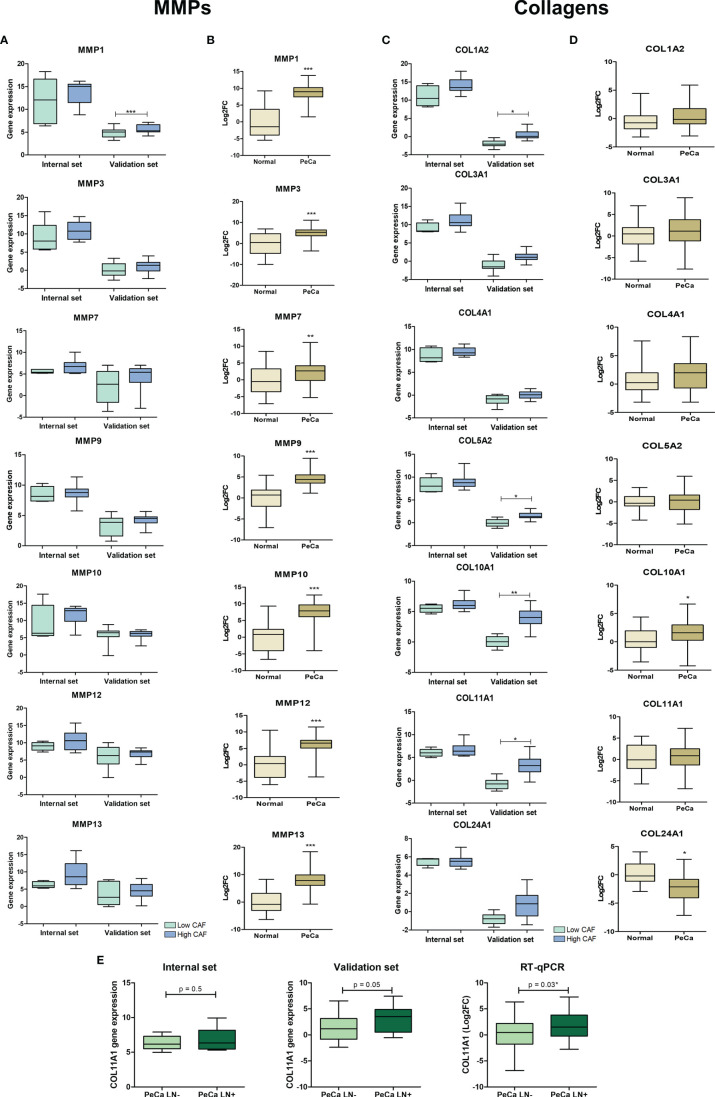
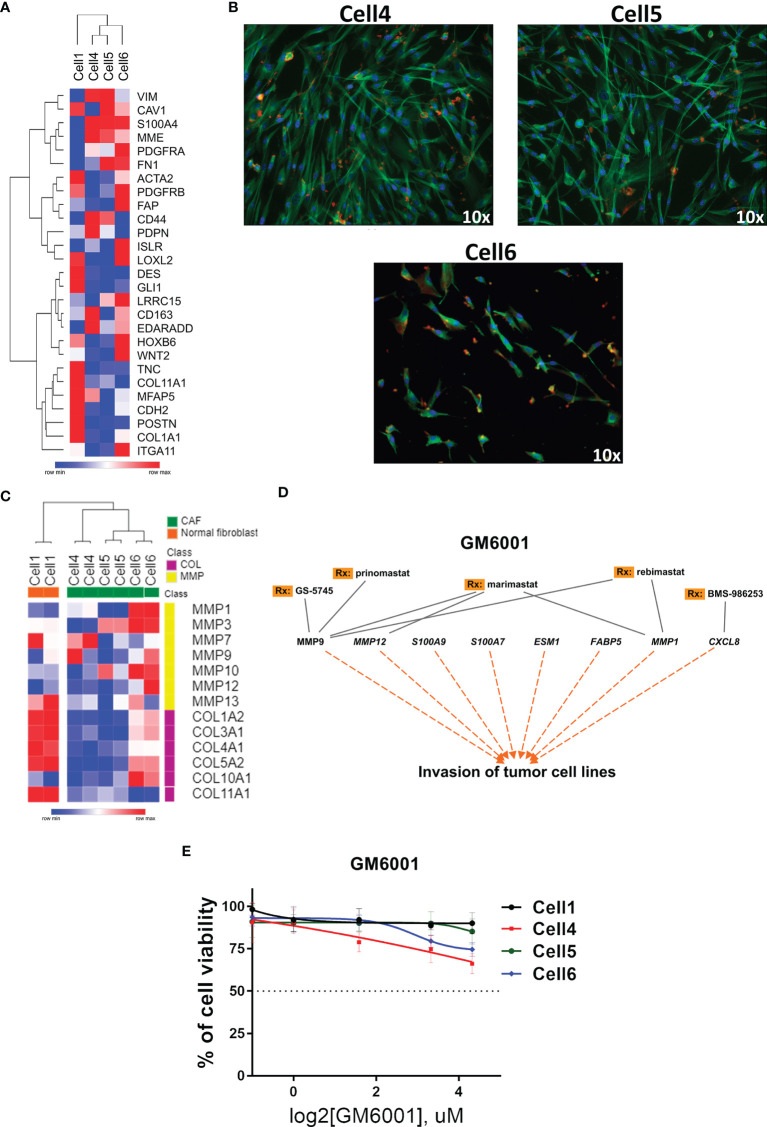
Extracellular matrix (ECM) remodeling and inflammation have been reported in penile carcinomas (PeCa). However, the cell types and cellular crosstalk involved in PeCa are unexplored. We aimed to characterize the complexity of cells and pathways involved in the tumor microenvironment (TME) in PeCa and propose target molecules associated with the TME. We first investigated the prognostic impact of cell types with a secretory profile to identify drug targets that modulate TME-enriched cells. The secretome analysis using the PeCa transcriptome revealed the enrichment of inflammation and extracellular matrix pathways. Twenty-three secreted factors were upregulated, mainly collagens and matrix metalloproteinases (MMPs). The deregulation of collagens and MMPs was confirmed by Quantitative reverse transcription - polymerase chain reaction (RT-qPCR). Further, the deconvolution method (digital cytometry) of the bulk samples revealed a high proportion of macrophages and dendritic cells (DCs) and B cells. Increased DCs and B cells were associated with better survival. A high proportion of cancer-associated fibroblasts (CAFs) was observed in low-survival patients. Patients with increased CAFs had decreased immune cell proportions. The treatment with the MMP inhibitor GM6001 in CAF cells derived from PeCa resulted in altered cell viability. We reported a crosstalk between immune cells and CAFs, and the proportion of these cell populations was associated with prognosis. We demonstrate that a drug targeting MMPs modulates CAFs, expanding the therapeutic options of PeCa.

Keywords: cancer-associated fibroblasts; penile cancer; response to therapy; secretome; transcriptome.


Conflict of interest statement

The authors declare that the research was conducted in the absence of any commercial or financial relationships that could be construed as a potential conflict of interest.

Figures

Figure 1
Figure 1
Secretome profile of penile cancer (PeCa) (A) Protein–protein interactions (PPIs) of secretome genes upregulated in PeCa from the internal dataset (Affymetrix). (B) PPIs of secretome genes upregulated in PeCa from the validation dataset (Agilent). Network generated by STRING (Search Tool for the Retrieval of Interacting Genes/Proteins) using the highest confidence interaction score (0.9). Colored circles indicate the associated ontology; genes associated with the immune system and extracellular matrix (ECM) are highlighted in blue and pink, respectively. Edges represent interaction. (C) Heat-scatter plot of the combined score for the enriched pathways and ontologies. Top categories selected from enrichment analysis of secretome genes from PeCa samples. The intensity of the color in the dotplot indicates the enrichment significance by the combined score. Significant adjusted p-value was found in all included terms. Gene set names are colored according to the Gene Ontology (GO) biological process (light blue), GO cellular component (dark blue), GO molecular function (light green), Kyoto Encyclopedia of Genes and Genomes (KEGG, dark green), MSigDB Hallmark (pink), Reactome (red), and Wiki Pathways (orange).
Figure 2
Figure 2
Immune profile characterization of PeCa samples using digital cytometry. (A) Heatmap representative of the immune cell score in normal and PeCa samples calculated using CIBERSORTx. (*) significant p-values comparing tumor versus normal samples. Rows were clustered based on the Euclidean distance of immune score values. Two clusters were generated using K-means analysis (K-means = 2). The beige and orange bars indicate the clusters of cells enriched in PeCa samples and normal samples, respectively. (B) Heatmap representative of immune cell scores in PeCa samples calculated using CIBERSORTx. Rows and columns were clustered based on the one minus Pearson correlation of immune score values. (C) Kaplan–Meier plot of immune hot and immune cold PeCa patients based on Figure 2B. (D) Kaplan–Meier plot of patients presenting high and low scores of dendritic cells (DCs), B cells, and macrophages. The bets cutoffs for survival analysis were determined by the easyROC web tool. (C, D) The Gehan–Breslow–Wilcoxon Test determined the hazard ratio (HR) with 95% confidence intervals (CIs). ns: p-values not statistically significant.
Figure 3
Figure 3
CAF characterization of PeCa samples using digital cytometry. (A) Bar graph demonstrating the mean score estimated using EPIC. The statistical significance was analyzed using Student’s t-test. *P < 0.001. (B) Bar graph demonstrating mean score estimated using CIBERSORTx. (C) Heatmap representing the gene expression of CAF markers in the internal set of cases (Affymetrix). The top panel indicates the CAF score in normal and PeCa samples calculated using CIBERSORTx and EPIC. Rows and columns were clustered based on the Euclidean distance of CAF marker expression. Three clusters were generated using k-means analysis (K-means = 3). (D) Heatmap representing the gene expression of CAF markers in the validation dataset (Agilent). Rows and columns were clustered based on Euclidean distance of CAFs marker expression. Two clusters were generated using k-means analysis (K-means = 2). (E) Kaplan–Meier plot of patients presenting high and low scores of CAFs (Affymetrix; internal set). (F) Kaplan–Meier plot of patients presenting high and low expression of CAF markers (Agilent; validation set). (E, F) The HR with 95% confidence intervals (CI) was determined by the Gehan–Breslow–Wilcoxon Test. ns, not statistically significant. (G) The partial Pearson’s rank correlation (r) and p-value are given for the CAF score generated by CIBESORTx with the mean immune score also generated by CIBESORTx.
Figure 4
Figure 4
Expression pattern of matrix metalloproteinases and collagens in PeCa samples. (A) Box plots representative of expression levels of MMP1, MMP3, MMP9, MMP10, MMP12, and MMP13 genes in PeCa compared to normal samples from internal [normalized-expression Robust Multi-ArrayAverage (RMA)] and validation set (expression ratio) according to the CAF score. (B) Box plots showing the expression levels of MMP1, MMP3, MMP9, MMP10, MMP12, and MMP13 in PeCa samples compared to normal tissues using RT-qPCR [log2fold change (2−DDCt) relative to GUSB]. The statistical difference was analyzed by the Mann–Whitney U test. (C) Box plot representative of the expression levels of COL11A1, COL1A2, COL4A1, COL3A1, COL5A2, COL10A1, and COL24A1 genes in PeCa samples from internal (normalized-expression RMA) and validation set (expression ratio) according to the CAF score. (D) Box plots showing the expression levels of COL11A1, COL1A2, COL4A1, COL3A1, COL5A2, COL10A1, and COL24A1 genes in PeCa compared to normal samples using RT-qPCR [log2fold change (2−DDCt) relative to GUSB]. Statistical difference was analyzed by the Mann–Whitney U test. (E) Box plot showing the expression levels of COL11A1 in PeCa compared to normal tissues from internal (normalized-expression RMA), validation set (expression ratio), and RT-qPCR according to lymph node (LN) metastasis. LN+: patients positive for LN metastasis; LN-: patients negative for LN metastasis. Statistical difference was analyzed by Student’s t-test. *p-values < 0.05, **p-values < 0.01, and ***p-values < 0.001.
Figure 5
Figure 5
Targeted therapy in PeCa–derived CAF cells. (A) Heatmap representative of gene expression of CAF markers in PeCa–derived cells (Cell4, Cell5, and Cell6) and normal foreskin cell line (Cell 1). Rows and columns were clustered based on the Euclidean distance of CAF marker expression. (B) Immunofluorescence images (Texas Red: actin/phalloidin; FITC: tubulin; and DAPI: nucleus, ×10 magnification, Nikon TE2000) of CAF cells (Cell4, Cell5, and Cell6). (C) Heatmap representative of the expression levels of MMP and collagen genes (same gene set used in the validation) in PeCa-derived cells (Cell4, Cell5, and Cell6) and Cell1. (D) Potential target therapy for secreted genes, especially MMPs (IPA analysis). (E) Cell viability assay using an MMP inhibitor (GM6001—Pan inhibitor of MMPs) at the indicated concentrations for 24 h to treat Cell1, Cell4, Cell5, and Cell6.

Similar articles

Cited by

References

    1. Sung H, Ferlay J, Siegel RL, Laversanne M, Soerjomataram I, Jemal A, et al. . Global Cancer Statistics 2020: GLOBOCAN Estimates of Incidence and Mortality Worldwide for 36 Cancers in 185 Countries. CA A Cancer J Clin (2021) 71:209–49. doi: 10.3322/caac.21660 - DOI - PubMed
    1. Douglawi A, Masterson TA. Updates on the Epidemiology and Risk Factors for Penile Cancer. Transl Androl Urol (2017) 6:785–90. doi: 10.21037/tau.2017.05.19 - DOI - PMC - PubMed
    1. Christodoulidou M, Sahdev V, Houssein S, Muneer A. Epidemiology of Penile Cancer. Curr Problems Cancer (2015) 39:126–36. doi: 10.1016/j.currproblcancer.2015.03.010 - DOI - PubMed
    1. Thomas A, Necchi A, Muneer A, Tobias-Machado M, Tran ATH, Van Rompuy A-S, et al. . Penile Cancer. Nat Rev Dis Primers (2021) 7:11. doi: 10.1038/s41572-021-00246-5 - DOI - PubMed
    1. Peyraud F, Allenet C, Gross-Goupil M, Domblides C, Lefort F, Daste A, et al. . Current Management and Future Perspectives of Penile Cancer: An Updated Review. Cancer Treat Rev (2020) 90:102087. doi: 10.1016/j.ctrv.2020.102087 - DOI - PubMed