. 2022 Jul 19:13:944323.
doi: 10.3389/fendo.2022.944323. eCollection 2022.

Linagliptin in Combination With Metformin Ameliorates Diabetic Osteoporosis Through Modulating BMP-2 and Sclerostin in the High-Fat Diet Fed C57BL/6 Mice

Affiliations

Linagliptin in Combination With Metformin Ameliorates Diabetic Osteoporosis Through Modulating BMP-2 and Sclerostin in the High-Fat Diet Fed C57BL/6 Mice

Nikita Nirwan et al. Front Endocrinol (Lausanne). .

Abstract

Background: Diabetic osteoporosis is a poorly managed serious skeletal complication, characterized by high fracture risk, increased bone resorption, reduced bone formation, and disrupted bone architecture. There is a need to investigate drugs that can improve bone health along with managing glycemic control. DPP-4 inhibitors and metformin have proven benefits in improving bone health. Here, we investigated the effects of linagliptin, a DPP inhibitor, and metformin alone and in combination to treat diabetic osteoporosis in high-fat-fed mice.

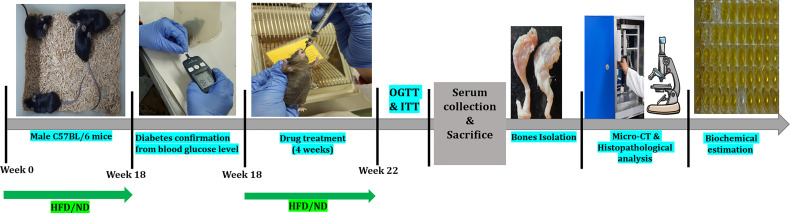
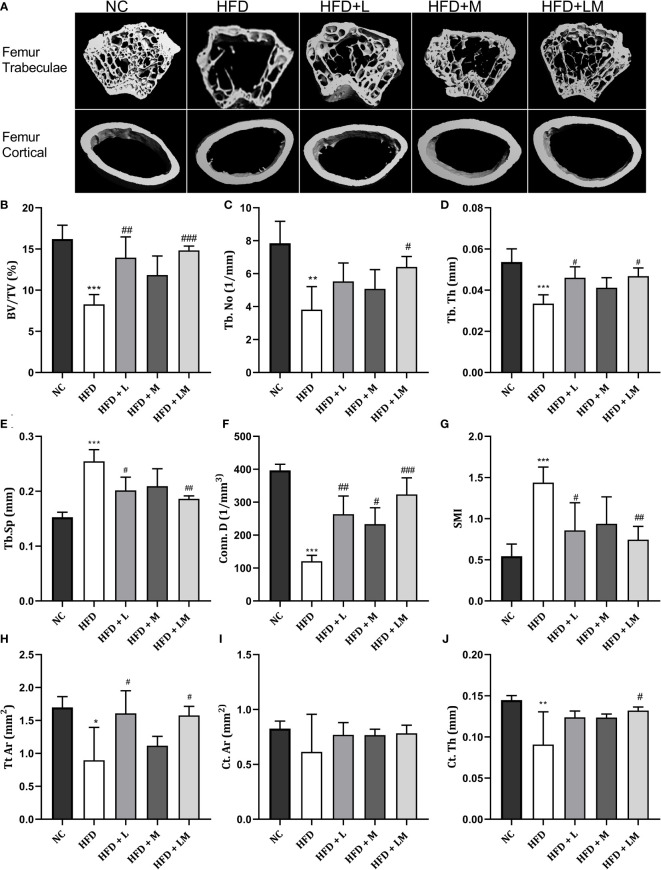
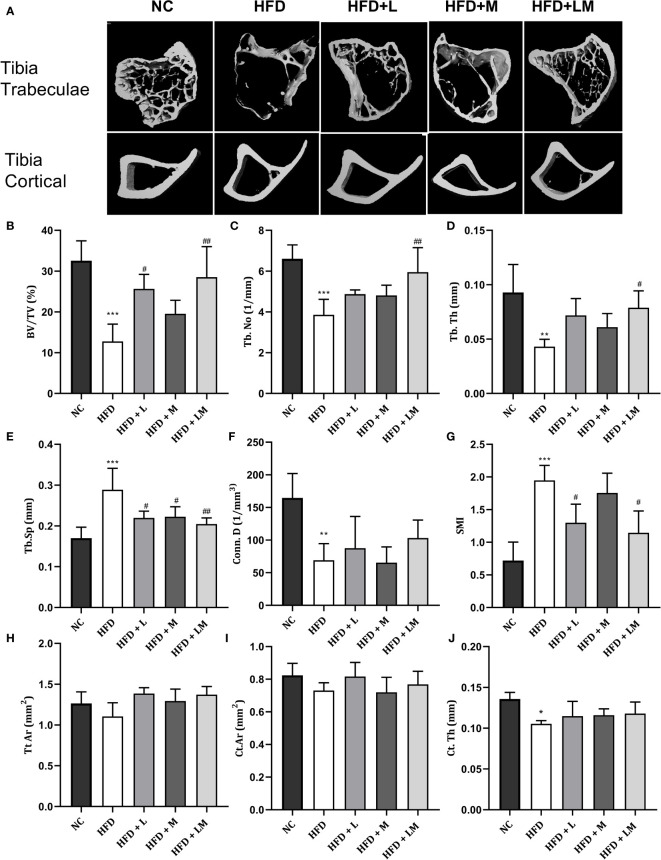
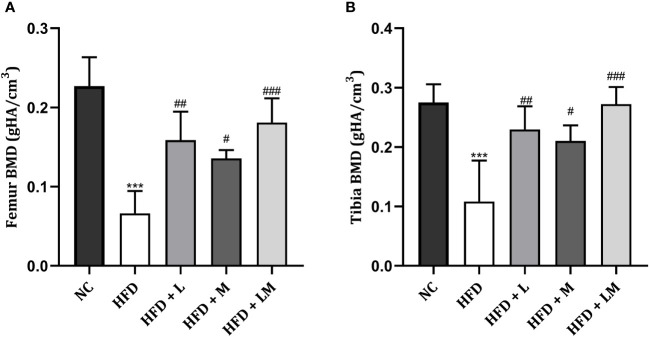
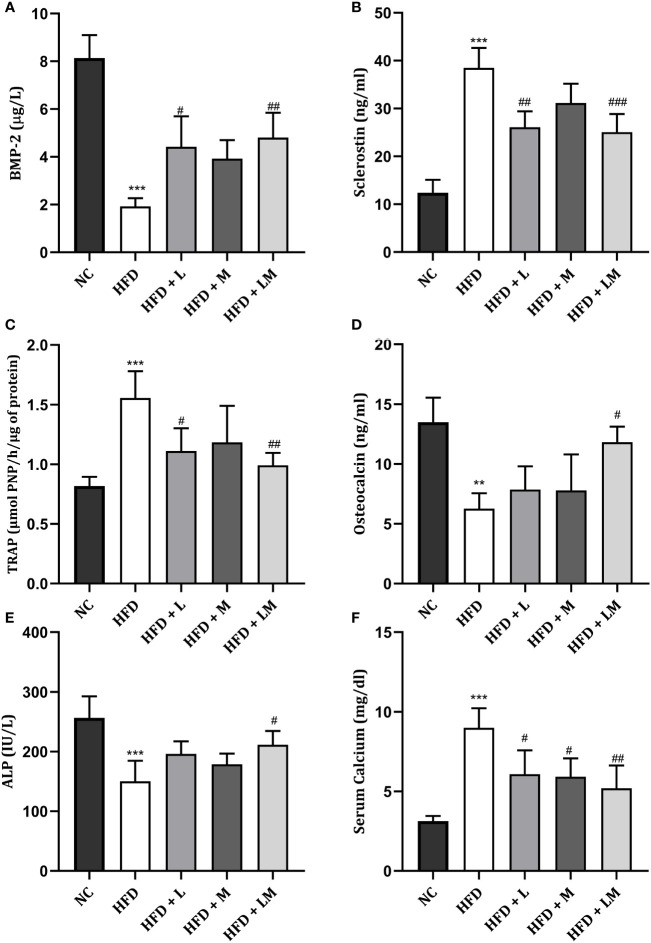
Methods: C57BL/6 mice were kept on the high-fat diet (HFD) for 22 weeks to induce diabetic osteoporosis. Linagliptin (10mg/Kg), metformin (150mg/Kg), and their combination were orally administered to the diabetic mice from the 18th-22nd week. Femur and tibial bone microarchitecture together with bone mineral density (BMD) were evaluated using µCT and histopathological changes were assessed. Further, bone turnover biomarkers namely bone morphogenetic protein-2 (BMP-2), sclerostin, tartrate-resistant acid phosphatase (TRAP), osteocalcin, alkaline phosphatase (ALP), calcium, and pro-inflammatory cytokines were assessed. Additionally, metabolic parameters including body weight, fasting blood glucose (FBG), glucose & insulin tolerance, lipids profile, and leptin were measured.

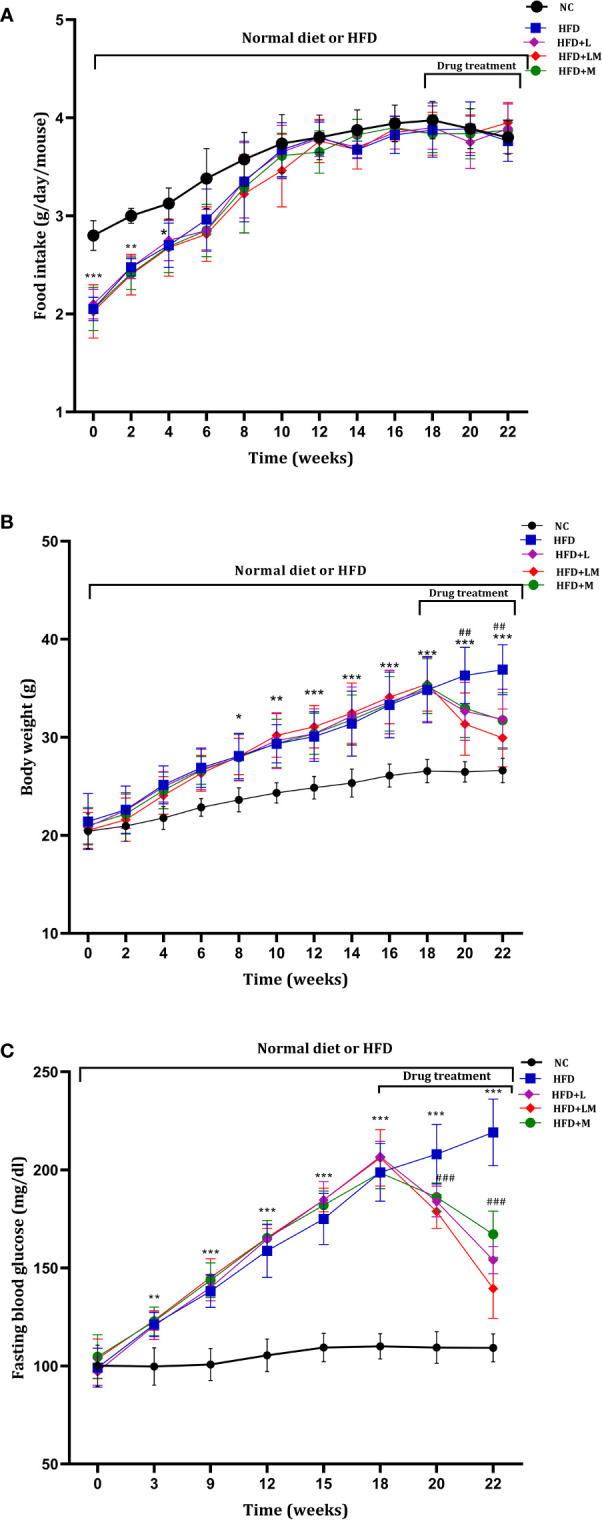
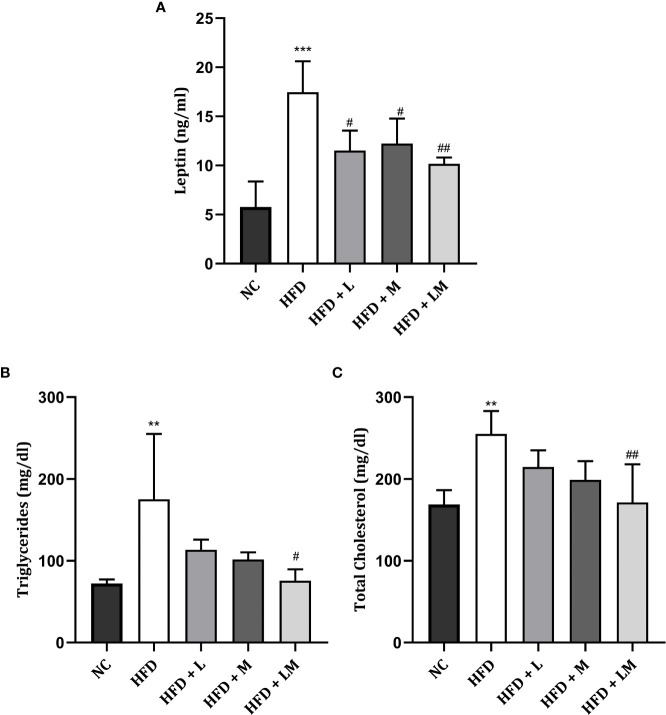
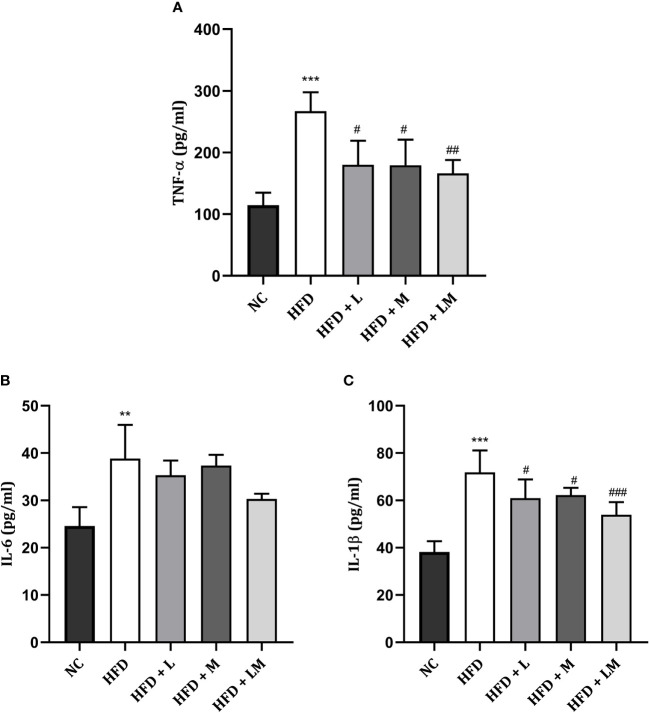
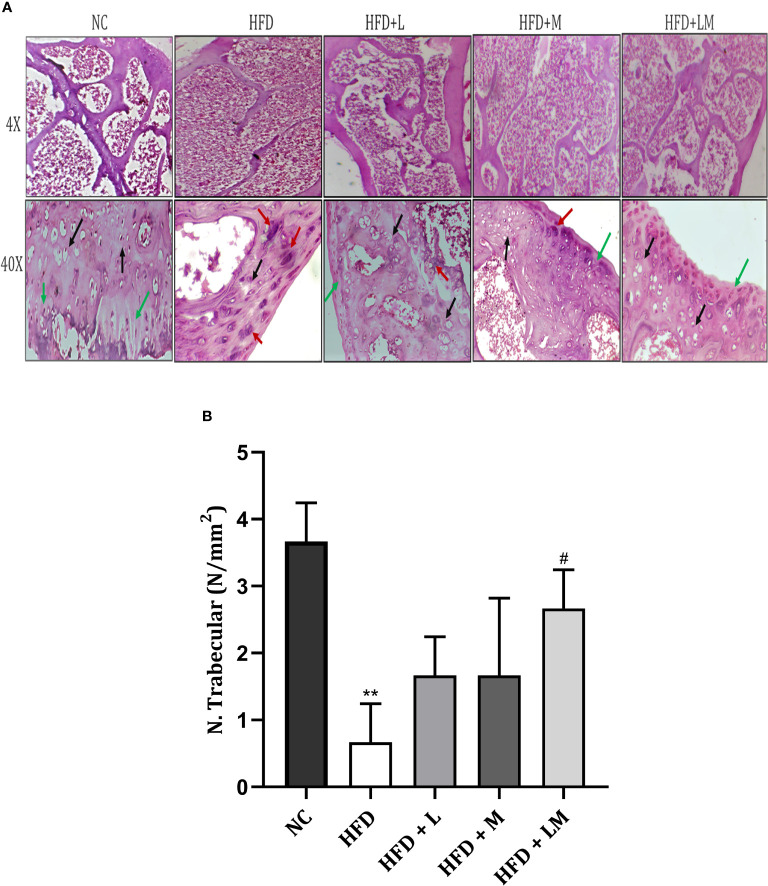
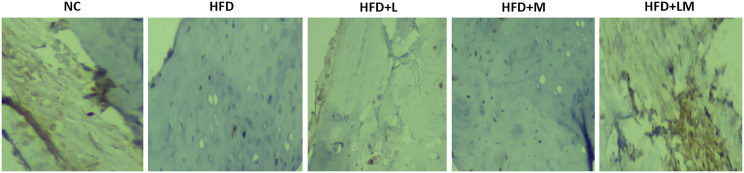
Results: HFD feeding resulted in impaired bone microarchitecture, reduced BMD, distorted bone histology, and altered bone turnover biomarkers as indicated by the significant reduction in bone ALP, BMP-2, osteocalcin, and an increase in sclerostin, TRAP, and serum calcium. Interestingly, treatment with linagliptin and its combination with metformin significantly reverted the impaired bone architecture, BMD, and positively modulated bone turnover biomarkers, while metformin alone did not exhibit any significant improvement. Further, HFD induced diabetes and metabolic abnormalities (including an increase in body weight, FBG, impaired glucose and insulin tolerance, leptin, triglycerides, cholesterol), and pro-inflammatory cytokines (TNF-alpha and IL-1β) were successfully reversed by treatment with linagliptin, metformin, and their combination.

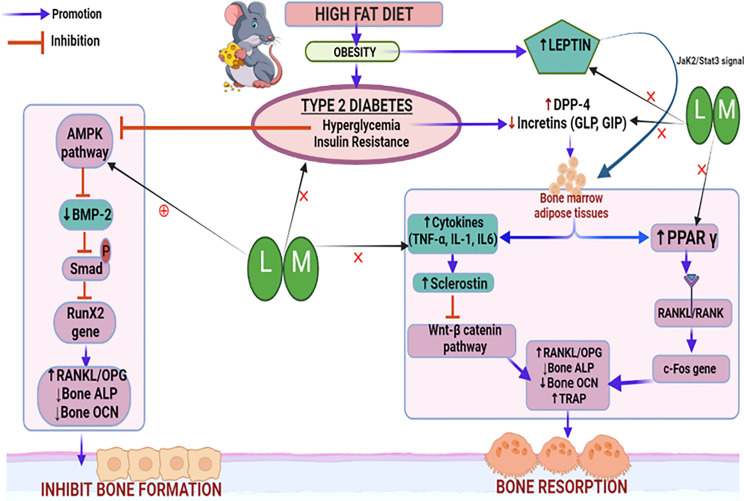
Conclusion: Linagliptin and its combination with metformin successfully ameliorated diabetic osteoporosis in HFD-fed mice possibly through modulation of BMP-2 and sclerostin. The study provides the first evidence for the possible use of linagliptin and metformin combination for managing diabetic osteoporosis.

Keywords: DPP-4 inhibitors; bone architecture; diabetes; high fat diet (HFD); linagliptin; metformin; osteoporosis.


Conflict of interest statement

The authors declare that the research was conducted in the absence of any commercial or financial relationships that could be construed as a potential conflict of interest.

Figures

Figure 1
Figure 1
Schematic presentation of the experimental design of the study. HFD, High-fat diet; ND, Normal pellet diet; OGTT, Oral glucose tolerance test; ITT, Insulin tolerance test.
Figure 2
Figure 2
Weekly changes in (A) food intake, (B) body weight, and (C) fasting blood glucose among different treatment groups. Mice were fed a normal pellet diet (ND) or HFD for 22 weeks and drugs were administered from 18th to 22nd week (n=8) in all treatment groups. All data are presented as mean ± SD. ***p<0.001, **p<0.01 and *p<0.05 when compared with NC group, ###p<0.001 and ##p<0.01 when compared with HFD group. Significance is statistically analyzed by two-way ANOVA followed by the Bonferroni post hoc test. NC, Normal control (0.5% CMC); HFD, High fat diet (0.5% CMC); L, Linagliptin (10mg/kg); M, Metformin (150 mg/kg); LM, Linagliptin & Metformin combination (10mg/kg & 150mg/kg).
Figure 3
Figure 3
Effect of linagliptin, metformin, and their combination on Leptin (A), Triglycerides (B), and Cholesterol (C). Mice were fed a normal pellet diet (ND) or HFD for 22 weeks and the drug was given from the 18th week to the 22nd week in all treatment groups. All data are presented as mean ± SD (n=4). ***p<0.001 and **p<0.01 when compared with NC group, ##p<0.01 and #p<0.05 when compared with HFD group. Significance is statistically analyzed by one-way ANOVA followed by Tukey’s multiple comparisons. NC, Normal control (0.5% CMC); HFD, High fat diet (0.5% CMC); L, Linagliptin (10mg/kg); M, Metformin (150 mg/kg); LM, Linagliptin & Metformin combination (10mg/kg & 150mg/kg).
Figure 4
Figure 4
Effect of linagliptin, metformin, and their combination on HFD impaired trabecular and cortical bone micro-architecture of the femur using μCT. Representative 3D micro-CT images of the distal femur trabecular and mid diaphysis cortical region of different treatment groups (A); Quantification of distal femur trabecular bone parameters i.e., Bone volume/trabecular volume (BV/TV), Trabecular number (Tb. N), Trabecular thickness (Tb. Th), Trabecular separation (Tb. Sp), Connectivity density (Conn. D) and Structural model Index (SMI) (B–G); Quantification of femur mid diaphysis cortical parameters i.e., Total cross-sectional tissue area (Tt. Ar), Cortical Bone area (Ct. Ar) and Cortical Thickness (Cortical. Th) (H–J). All data are presented as mean ± SD (n=4). ***p<0.001, **p<0.01 and *p<0.05 when compared with NC group; ###p<0.001, p<0.01 ##p<0.01 and #p<0.05 when compared with HFD group. Significance is statistically analyzed by one way-ANOVA followed by Tukey’s multiple comparisons. NC, Normal control (0.5% CMC); HFD, High fat diet (0.5% CMC); L, Linagliptin (10mg/kg); M, Metformin (150 mg/kg); LM, Linagliptin & Metformin combination (10mg/kg & 150mg/kg).
Figure 5
Figure 5
Effect of linagliptin, metformin, and their combination on HFD impaired tibial trabecular and cortical bone micro-architecture using μCT. Representative 3D micro-CT images of the proximal tibia trabecular and mid diaphysis cortical region (A); Quantification of proximal tibia trabecular bone parameters i.e., Bone volume/trabecular volume (BV/TV), Trabecular number (Tb. N), Trabecular thickness (Tb. Th), Trabecular separation (Tb. Sp), Connectivity density (Conn. D) and Structural model Index (SMI) (B–G); Quantification of tibia mid diaphysis cortical parameters i.e., Total cross-sectional tissue area (Tt. Ar), Cortical Bone area (Ct. Ar) and Cortical Thickness (Cortical. Th) (H–J). All data are presented as mean ± SD (n=4). ***p<0.001, **p<0.01 and *p<0.05 when compared with NC group; ##p<0.01 and #p<0.05 when compared with HFD group. Significance is statistically analyzed by one way-ANOVA followed by Tukey’s multiple comparisons. NC, Normal control (0.5% CMC); HFD, High fat diet (0.5% CMC); L, Linagliptin (10mg/kg); M, Metformin (150 mg/kg); LM, Linagliptin & Metformin combination (10mg/kg & 150mg/kg).
Figure 6
Figure 6
Effect of linagliptin, metformin and their combination on BMD in HFD fed mice. BMD of distal femur (A) and proximal tibia (B) regions of bone was evaluated using micro-CT. All data is presented as mean ± SD (n=4). ***p<0.001 when compared with NC group, ###p<0.001, ##p<0.01, and #p<0.05 when compared with HFD group. Significance is statistically analyzed by one-way ANOVA followed by Tukey’s multiple comparison. NC, Normal control (0.5% CMC); HFD, High fat diet (0.5% CMC); L, Linagliptin (10mg/kg); M, Metformin (150 mg/kg); LM, Linagliptin & Metformin combination (10mg/kg & 150mg/kg).
Figure 7
Figure 7
Effect of linagliptin, metformin and their combination on bone turnover biomarkers. (A) Bone morphogenetic protein-2 (BMP-2), (B) Sclerostin, (C) Tartrate−resistant acid phosphatase (TRAP), (D) Osteocalcin, (E) Bone specific Alkaline phosphatase (ALP), (F) Serum Calcium. All data is presented as mean ± SD (n=4). ***p<0.001 and **p<0.01 when compared with normal control; ###p<0.001, ##p<0.01 and #p<0.05 when compared with HFD group. Significance is statistically analyzed by one-way ANOVA followed by Tukey’s multiple comparison. NC, Normal control (0.5% CMC); HFD, High fat diet (0.5% CMC); L, Linagliptin (10mg/kg); M, Metformin (150 mg/kg); LM, Linagliptin & Metformin combination (10mg/kg & 150mg/kg).
Figure 8
Figure 8
Effect of linagliptin, metformin and their combination on pro-inflammatory cytokines (A) TNF-α, (B) IL-6, (C) IL-1β. All data is presented as mean ± SD (n=4). ***p<0.001 and **p<0.01 when compared with NC group; ###p<0.001, ##p<0.01 and #p<0.05 when compared with HFD group. Significance is statistically analyzed by one-way ANOVA followed by Tukey’s multiple comparison. NC, Normal control (0.5% CMC); HFD, High fat diet (0.5% CMC); L, Linagliptin (10mg/kg); M, Metformin (150 mg/kg); LM, Linagliptin & Metformin combination (10mg/kg & 150mg/kg).
Figure 9
Figure 9
Effect of linagliptin, metformin, and their combination on bone histopathology. (A) Representative images of H & E staining of femur trabecular bone at 4X and 40X, (B) trabecular number per square millimeter (N/mm2). All data are presented as mean ± SD (n=3). **p<0.01 when compared with NC group; #p<0.05 when compared with HFD group. Significance is statistically analyzed by one-way ANOVA followed by Tukey’s multiple comparisons. NC, Normal control (0.5% CMC); HFD, High fat diet (0.5% CMC); L, Linagliptin (10mg/kg); M, Metformin (150 mg/kg); LM, Linagliptin & Metformin combination (10mg/kg & 150mg/kg).
Figure 10
Figure 10
Effect of linagliptin, metformin, and their combination on immunohistochemistry analysis of BMP-2 protein. Representative images of IHC stained femur trabecular bone at 40X. Cells with negative expression of BMP-2 protein are stained blue, while cells with positive BMP-2 expression is seen by brown staining. NC, Normal control (0.5% CMC); HFD, High fat diet (0.5% CMC); L, Linagliptin (10mg/kg); M, Metformin (150 mg/kg); LM, Linagliptin & Metformin combination (10mg/kg & 150mg/kg).
Figure 11
Figure 11
Schematic representation of the probable mechanistic explanation behind the bone protective effect of linagliptin and metformin in a high-fat diet (HFD) induced diabetic osteoporosis. HFD-induced type 2 diabetes mellitus which is characterized by hyperglycemia and insulin resistance blocks the AMPK pathway, inhibits BMP-2 production, Smad phosphorylation, and bone forming RunX2 gene expression. This results in the alteration of downstream biomarkers including RANKL/OPG, ALP, and OCN which subsequently inhibits bone formation. Another pathway is the hyperglycemia upregulated DPP-4 enzyme which reduces incretins thereby increasing the production of bone marrow adipose tissue which further upregulates pro-inflammatory cytokines and sclerostin, which subsequently inactivates the Wnt signaling pathway. Inactivated Wnt pathway and adipocyte-induced PPARϒ overexpression increase bone resorption by altering bone turnover markers like RANKL/OPG, ALP, TRAP, and OCN. HFD-induced high leptin levels also cause adipocyte formation and reduced bone formation. Treatment with linagliptin (DPP-4 inhibitor) and its combination with metformin mitigate hyperglycemia and leptin production while increasing incretins and bone formation. This is possibly achieved via activating AMPK and Wnt pathways as confirmed by increased BMP-2 expression and reduced sclerostin respectively. L, Linagliptin; M, Metformin; DPP-4, Dipeptidyl peptidase-4; Wnt, Wingless and Int. protein; AMPK, AMP-activated protein kinase; BMP-2, Bone morphogenetic protein; RunX-2, Runt related transcription factor 2; RANKL/OPG, Receptor activator of nuclear factor kappa-B ligand/Osteoprotegerin; ALP, Alkaline phosphatase; TRAP, Tartrate Resistant Acid Phosphatase; OCN, Osteocalcin; PPARϒ, Peroxisome proliferators–activated receptor γ; GLP, Glucagon-like peptide; GIP, Gastric inhibitory polypeptide; TNF-α, Tumor Necrosis Factor-alpha, IL-6, Interleukins-6, IL-β, Interleukins.

Similar articles

Cited by

References

    1. Janghorbani M, Van Dam RM, Willett WC, Hu FB. Systematic Review of Type 1 and Type 2 Diabetes Mellitus and Risk of Fracture. Am J Epidemiol (2007) 166(5):495–505. doi: 10.1093/aje/kwm106 - DOI - PubMed
    1. Vestergaard P. Discrepancies in Bone Mineral Density and Fracture Risk in Patients With Type 1 and Type 2 Diabetes–a Meta-Analysis. Osteoporosis Int (2007) 18(4):427–44. doi: 10.1007/s00198-006-0253-4 - DOI - PubMed
    1. Napoli N, Chandran M, Pierroz DD, Abrahamsen B, Schwartz AV, Ferrari SL. Mechanisms of Diabetes Mellitus-Induced Bone Fragility. Nat Rev Endocrinol (2017) 13(4):208–19. doi: 10.1038/nrendo.2016.153 - DOI - PubMed
    1. Wongdee K, Charoenphandhu N. Update on Type 2 Diabetes-Related Osteoporosis. World J diabetes (2015) 6(5):673–8. doi: 10.4239/wjd.v6.i5.673 - DOI - PMC - PubMed
    1. Johnell O, Kanis JA. An Estimate of the Worldwide Prevalence and Disability Associated With Osteoporotic Fractures. Osteoporosis Int (2006) 17(12):1726–33. doi: 10.1007/s00198-006-0172-4 - DOI - PubMed

Publication types

MeSH terms