. 2022 Jul 19:10:933612.
doi: 10.3389/fbioe.2022.933612. eCollection 2022.

A Novel, Cardiac-Derived Algorithm for Uterine Activity Monitoring in a Wearable Remote Device

Affiliations

A Novel, Cardiac-Derived Algorithm for Uterine Activity Monitoring in a Wearable Remote Device

Muhammad Mhajna et al. Front Bioeng Biotechnol. .

Abstract

Background: Uterine activity (UA) monitoring is an essential element of pregnancy management. The gold-standard intrauterine pressure catheter (IUPC) is invasive and requires ruptured membranes, while the standard-of-care, external tocodynamometry (TOCO)'s accuracy is hampered by obesity, maternal movements, and belt positioning. There is an urgent need to develop telehealth tools enabling patients to remotely access care. Here, we describe and demonstrate a novel algorithm enabling remote, non-invasive detection and monitoring of UA by analyzing the modulation of the maternal electrocardiographic and phonocardiographic signals. The algorithm was designed and implemented as part of a wireless, FDA-cleared device designed for remote pregnancy monitoring. Two separate prospective, comparative, open-label, multi-center studies were conducted to test this algorithm. Methods: In the intrapartum study, 41 laboring women were simultaneously monitored with IUPC and the remote pregnancy monitoring device. Ten patients were also monitored with TOCO. In the antepartum study, 147 pregnant women were simultaneously monitored with TOCO and the remote pregnancy monitoring device. Results: In the intrapartum study, the remote pregnancy monitoring device and TOCO had sensitivities of 89.8 and 38.5%, respectively, and false discovery rates (FDRs) of 8.6 and 1.9%, respectively. In the antepartum study, a direct comparison of the remote pregnancy monitoring device to TOCO yielded a sensitivity of 94% and FDR of 31.1%. This high FDR is likely related to the low sensitivity of TOCO. Conclusion: UA monitoring via the new algorithm embedded in the remote pregnancy monitoring device is accurate and reliable and more precise than TOCO standard of care. Together with the previously reported remote fetal heart rate monitoring capabilities, this novel method for UA detection expands the remote pregnancy monitoring device's capabilities to include surveillance, such as non-stress tests, greatly benefiting women and providers seeking telehealth solutions for pregnancy care.

Keywords: Gynecology & Obstetrics; biomedical signal processing; electrocardiography (ECG); phonocardiography (PCG); telemedicine; uterine activity; uterine contractions; wearable device.


Conflict of interest statement

Authors MM, BS, YZ, and AR were employed by Nuvo-Group, Ltd. The remaining authors declare that the research was conducted in the absence of any commercial or financial relationships that could be construed as a potential conflict of interest.

Figures

FIGURE 1
FIGURE 1
Physiological mechanism of action upon which INVU’s cardiac-based uterine monitoring (CaBUM) algorithm is built.
FIGURE 2
FIGURE 2
INVU sensor band™ inner-side view (the side facing the abdominal skin) is shown, detailing the (1 and 5) rear-closing buckle; (2) electrocardiogram sensors, eight in total; (3) acoustic sensors, four in total; and (4) textile band (this figure was published in N. Schwartz et al., “Novel Uterine Contraction Monitoring to Enable Remote, Self-administered Non-stress Testing,” Am. J. Obstet. Gynecol., 2021)
FIGURE 3
FIGURE 3
System diagram. (A) Biopotential and acoustic signals are acquired by the sensors in the band and are transformed via Bluetooth to a nearby mobile device that had already been paired with the INVU device. (B) Data are then transmitted wirelessly and securely via WiFi from the mobile device to the Cloud Application. The signals are processed at the cloud server level, including signal processing to identify fetal and maternal cardiac signals and uterine contractions, and the results are downloaded in real time to the mobile devices of the pregnant woman and her medical team via a web-based application (C).
FIGURE 4
FIGURE 4
INVU electronic module block diagram. MCU–microcontroller unit; ADC–analog-to-digital converter.
FIGURE 5
FIGURE 5
Maternal uterine contraction algorithm (black) and fetal and maternal heart rate algorithm (blue) components of the wireless, remote prenatal monitor. Details of the heart rate algorithm have been presented previously (Mhajna et al., 2020).
FIGURE 6
FIGURE 6
Raw maternal signals recorded by the sensors and their pre-processed versions. (A) Example of a 6-s raw biopotential signal (blue line) and the result after applying the filtration stage as described in the text (black line). (B) Example of a 6-s raw acoustic signal (blue line), and after passing both a 50 Hz cut-off frequency low-pass IIR filter, and an IIR high-pass filter with the following five cut-off frequencies (shown from top to bottom in the figure): 10, 15, 20, 25, and 30 Hz. For better visualization, these five filtered traces are scaled to the dynamic range of the frequencies in each trace.
FIGURE 7
FIGURE 7
Heartbeat detection. Upward (blue dots) and downward (gray diamonds) pointing maternal heartbeat peaks, as detected by the algorithm, of a 19-year-old pregnant woman, at 38 weeks, with BMI = 36.7 kg/m2. Panes A and B show examples of acoustic data, and panes C and D show examples of biopotential data. Data were extracted after the pre-processing stage of the algorithm was completed.
FIGURE 8
FIGURE 8
Example of an initial maternal uterine activity trace (MUA–black line) that is produced by a simple addition of the interpolated upward-pointing peaks’ time series (orange points after interpolation) and the absolute values of the interpolated downward-pointing peaks’ time series (red points after interpolation).
FIGURE 9
FIGURE 9
Per-channel surrogate MUA traces and weights for 28 channels, and final MUA activity from a representative subject. The first eight channels (surrounded by a blue frame) are biopotential channels, and the rest (surrounded by an orange frame) are acoustic channels under the different pre-processing parameters described in this study. Note that each 1-min data segment composing these data has their own weight distribution. The weights represented here (red bars) are taken from the last recording segment. Channels with no bars were given the weight of 0.
FIGURE 10
FIGURE 10
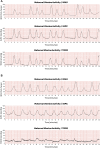
Example of the output of the INVU system. The fetal and maternal heart rates (in beats per minute [BPM]) are shown in the upper plot (green line is the MHR and blue line is the FHR), and the maternal uterine activity (MUA) is shown in the lower plot. The MUA trace is unitless and displays the % change in activity from baseline.
FIGURE 11
FIGURE 11
Uterine contraction monitoring sessions showing recordings from IUPC, TOCO, and INVU. (A) Both INVU and TOCO recordings followed the IUPC recording closely. (B) In some monitoring sessions, the TOCO tracing, which is more sensitive to positioning, motion, and placement, failed to show some of the IUPC contractions that were correctly identified by the INVU (this figure was published in N. Schwartz et al., “Novel Uterine Contraction Monitoring to Enable Remote, Self-administered Non-stress Testing,” Am. J. Obstet. Gynecol., 2021).
FIGURE 12
FIGURE 12
UA monitoring sessions showing recordings from TOCO and INVU during antepartum stage. Contractions detected by INVU and TOCO displayed along with the mother’s reports of contractions she felt. (A) INVU trace closely follows TOCO trace. The blue vertical lines represent contractions felt by the mother. (B) INVU trace shows all contractions presented on both TOCO trace and the mother's perceptions and additional contractions that are neither identifiable by TOCO nor perceived by the mother (false-positives). The red circle denotes a negative deflection at the TOCO trace that appeared concurrently with a contraction identified by INVU.
FIGURE 13
FIGURE 13
Relationship between physiological processes involved in uterine contractions and measurement methods used to identify contractions.

References

    1. Agliari E., Barra A., Barra O. A., Fachechi A., Franceschi Vento L., Moretti L. (2020). Detecting Cardiac Pathologies via Machine Learning on Heart-Rate Variability Time Series and Related Markers. Sci. Rep. 10 (1), 1–18. 10.1038/s41598-020-64083-4 - DOI - PMC - PubMed
    1. Al-Khalidi F. Q., Saatchi R., Burke D., Elphick H., Tan S. (2011). Respiration Rate Monitoring Methods: A Review. Pediatr. Pulmonol. 46 (6), 523–529. 10.1002/ppul.21416 - DOI - PubMed
    1. Alamedine D., Khalil M., Marque C. (2013). Parameters Extraction and Monitoring in Uterine EMG Signals. Detection of Preterm Deliveries. Detect. preterm Deliv. 34 (4–5), 322–325. 10.1016/j.irbm.2013.08.003 - DOI
    1. Alberola-Rubio J., Prats-Boluda G., Ye-Lin Y., Valero J., Perales A., Garcia-Casado J. (2013). Comparison of Non-invasive Electrohysterographic Recording Techniques for Monitoring Uterine Dynamics. Med. Eng. Phys. 35 (12), 1736–1743. 10.1016/j.medengphy.2013.07.008 - DOI - PubMed
    1. Asmi S., Subramaniam K., Iqbal N. V. (2019). A Review of Significant Researches on Prediction of Preterm Birth Using Uterine Electromyogram Signal. Futur. Gener. Comput. Syst. 98, 135–143. 10.1016/j.future.2018.10.033 - DOI

LinkOut - more resources