

Lymphocyte Depletion Rate as a Biomarker of Radiation Dose to Circulating Lymphocytes During Fractionated Partial-Body Radiation Therapy
- PMID: 35928987
- PMCID: PMC9343404
- DOI: 10.1016/j.adro.2022.100959
Lymphocyte Depletion Rate as a Biomarker of Radiation Dose to Circulating Lymphocytes During Fractionated Partial-Body Radiation Therapy
Abstract
Purpose: Radiation causes exponential depletion of circulating lymphocyte populations; in turn, radiation-induced lymphopenia is associated with worse survival for many solid tumors, possibly owing to attenuated antitumor immune responses. Identifying reliable and reproducible methods of calculating the radiation dose to circulating immune cells may facilitate development of techniques to reduce the risk and severity of radiation-induced toxic effects to circulating lymphocytes.
Methods and materials: Patient-specific lymphocyte loss rates were derived from a clinical data set including 684 adult patients with solid tumors. Multivariable linear regression was used to model the relationship between the lymphocyte loss rate and physical parameters of the radiation plan that determine circulating blood dose.
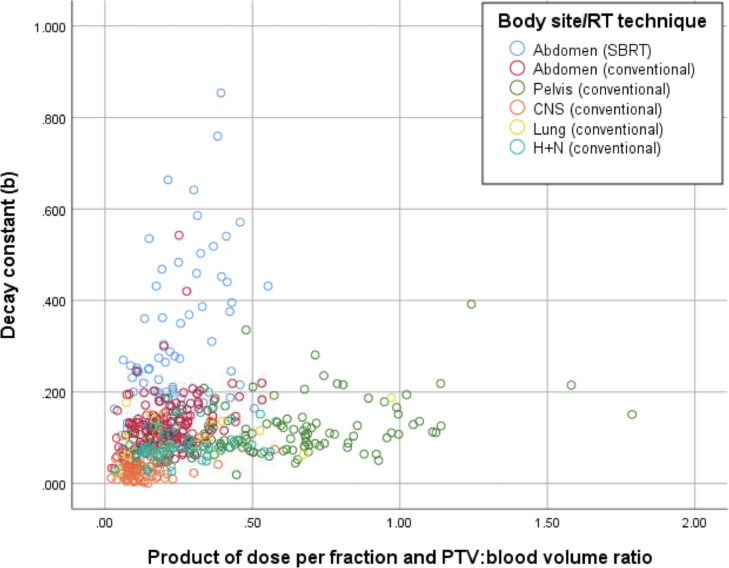
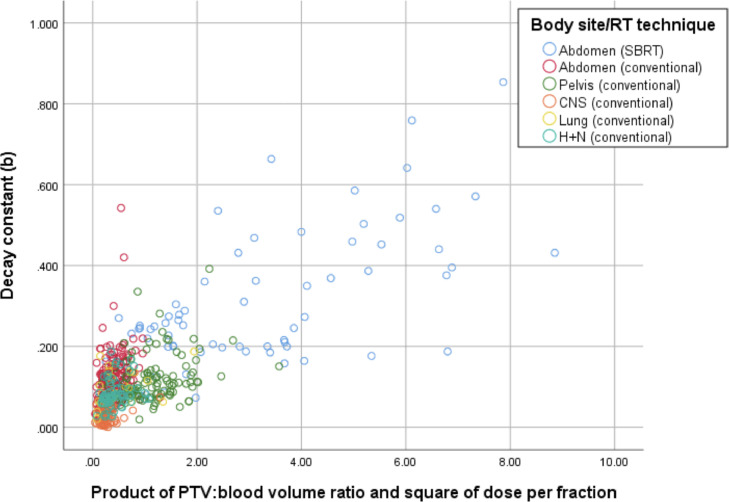
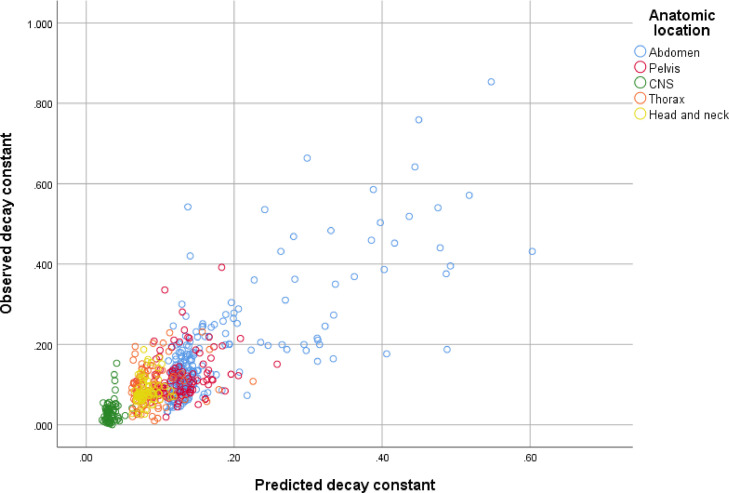
Results: During partial-body radiation, lymphocyte loss rates are determined by physical parameters of the radiation plan that reflect radiation exposure to circulating cells, including target volume size, dose per fraction squared, and anatomic site treated. Differences in observed versus predicted lymphocyte loss rates may be partly explained by variations in concurrent chemotherapy regimens.
Conclusions: We describe a novel method of using patient-specific lymphocyte loss kinetics to approximate the effective radiation dose to circulating lymphocytes during focal fractionated photon radiation therapy. Clinical applications of these findings include the early identification of patients at particularly high risk of severe radiation-induced lymphopenia based on physical parameters of the radiation therapy plan.
© 2022 The Authors.
Figures
References
-
- Pan HY, Haffty BG, Falit BP, et al. Supply and demand for radiation oncology in the United States: Updated projections for 2015 to 2025. Int J Radiat Oncol Biol Phys. 2016;96:493–500. - PubMed
-
- Grassberger C, Ellsworth SG, Wilks MQ, Keane FK, Loeffler JS. Assessing the interactions between radiotherapy and antitumour immunity. Nat Rev Clin Oncol. 2019;16:729–745. - PubMed
-
- Chen D, Verma V, Patel RR, Barsoumian HB, Cortez MA, Welsh JW. Absolute lymphocyte count predicts abscopal responses and outcomes in patients receiving combined immunotherapy and radiation therapy: Analysis of 3 phase 1/2 trials. Int J Radiat Oncol Biol Phys. 2020;108:196–203. - PubMed
LinkOut - more resources
Full Text Sources
