. 2022 Aug 26;50(15):8599-8614.
doi: 10.1093/nar/gkac669.

SRRM2 organizes splicing condensates to regulate alternative splicing

Affiliations

SRRM2 organizes splicing condensates to regulate alternative splicing

Shaohai Xu et al. Nucleic Acids Res. .

Abstract

SRRM2 is a nuclear-speckle marker containing multiple disordered domains, whose dysfunction is associated with several human diseases. Using mainly EGFP-SRRM2 knock-in HEK293T cells, we show that SRRM2 forms biomolecular condensates satisfying most hallmarks of liquid-liquid phase separation, including spherical shape, dynamic rearrangement, coalescence and concentration dependence supported by in vitro experiments. Live-cell imaging shows that SRRM2 organizes nuclear speckles along the cell cycle. As bona-fide splicing factor present in spliceosome structures, SRRM2 deficiency induces skipping of cassette exons with short introns and weak splice sites, tending to change large protein domains. In THP-1 myeloid-like cells, SRRM2 depletion compromises cell viability, upregulates differentiation markers, and sensitizes cells to anti-leukemia drugs. SRRM2 induces a FES splice isoform that attenuates innate inflammatory responses, and MUC1 isoforms that undergo shedding with oncogenic properties. We conclude that SRRM2 acts as a scaffold to organize nuclear speckles, regulating alternative splicing in innate immunity and cell homeostasis.


Figures

Graphical Abstract
Graphical Abstract
SRRM2-IDRs promote condensates to induce exon inclusion, while SRRM2 deficiency induces skipping. Splicing condensates maintain proper alternative splicing and innate immune homeostasis.
Figure 1.
Figure 1.
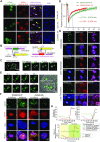
SRRM2 is responsible for organizing nuclear speckles. (A) Representative images of SRRM2, SON, or SRRM1 immunofluorescence staining upon single knockdown of SRRM2 (green cells and arrows), SON (red cells and pink arrows), or SRRM2/SON double knockdown (green and red, yellow arrows) in HEK293T cells (experimental design in Figure S1A). (B) Schematic of the experimental design of SRRM2-EGFP and SRSF2-mCherry knock-ins by CRISPR/Cas9 system. (C) Representative images of FRAP experiments on knock-in EGFP-SRRM2 in HEK293T cells. (D) Fluorescence recovery curve of the FRAP experiment of either knock-in or overexpressed EGFP-SRRM2 with relative fluorescence intensity of EGFP-SRRM2 plotted against time. (E) Live-cell images of two fusion events (arrowheads) among three SRRM2 condensates. Two condensates fused at 5 s, and the formed liquid condensate fused with another one at 140 s. See Video 1. (F) Live-cell imaging 3D reconstruction showing the distribution of SRRM2-EGFP and SRSF2-mCherry at cytokinesis or interphase stage, in either double knock-in (KI) cells or ectopic overexpression (OE) through co-transfection, all in HEK293T. (G) Immunofluorescence staining on fixed double knock-in cells showing the distribution of SRRM1 and SON in late telophase and interphase. (H) Number and size of condensates of SRRM2 or SRSF2 in cytoplasm or nucleus, and ratio of dissolved/condensed SRRM2/SRSF2 in cytoplasm or nucleus at different cell cycle stages by 4D live-cell imaging (Figure S1F and Video 2). Images are representative of at least three independent experiments.
Figure 2.
Figure 2.
SRRM2-IDRs are responsible for condensate formation. (A) Predicted IDRs in human SRRM2. IUPred for disordered tendency; FOLD: intrinsic disorder prediction by PLAAC (blue) and PAPA (red); and NCPR: net charge per residue; RS: RS-rich region; PLD: prion-like region (PLAAC). (B) Immunofluorescence images of HEK293T cells co-transfected with EGFP-SRRM2 with mCherry-SRSF2 and single deletion of UPR, DPR or UPR/DPR double deletion. FL: Full-length SRRM2. (C) Images showing the localization of either FL SRRM2 or ΔUPRΔDPR in SRRM2 knockdown HEK293T cells. SRRM2-EGFP knock-in cell as a reference for showing condensates at a relatively similar expression level (images taken and displayed under same parameters). (D) Images showing control-NCK and NES (Nuclear Export Signal)-NCK with EGFP tag expressed in HEK293T cells. We labeled DNA in fixed cells with DAPI. Enlarged boxes show DAPI accumulated on NCK condensates in the cytoplasm. (EF) In vitro phase-separation experiments showing protein condensates at varying NaCl (75, 150, or 300 mM) and peptide KSR (E) and UPR3 (F) (2, 5, 10, 20, 50, 100 μM) concentrations under 5% PEG. Phase diagram plots the presence (circles) or absence (crosses) of droplets. We show a representative image of 20 μM under 150 mM NaCl (control), protein droplet formation of KSR after adding RNA (final concentration 100 ng/μl) without PEG, and UPR3 droplet formation with PEG (5% final concentration) or RNA (100 ng/μl final concentration) as representative pictures. (G) Representative image of two fusion events of KSR-EGFP droplets formed in vitro at concentration of 20 μM under 150 mM NaCl and 5% PEG. Droplet fusion started at 30 sec and 61 s. (H) Time-lapse of UPR3 droplets at concentration of 20 μM under 150 mM NaCl. We observed several fusion events at each time point. See Video 3.
Figure 3.
Figure 3.
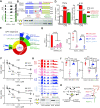
SRRM2 is associated with acute myeloid leukemia. (A) Expression of SRRM2 mRNA in human normal tissues (upper heatmap) and cancers (lower graph). The normal tissues display SRRM2 expression from 0 to 370 Transcripts per Million (TPM), to show that SRRM2 was expressed at roughly the same level in most human normal tissues including bone marrow (highlighted in green) (data from The Human Protein Atlas). SRRM2 mRNA levels in cancers (after log2 transformation) show a specific upregulation in AML bone marrow when compared to other tumor or cancers (data from TCGA Research Network: https://www.cancer.gov/tcga). The increased SRRM2 expression in AML is not due to point mutations (very few red dots indicating samples with SRRM2 mutations). (B) Expression analyses on patient samples showing SRRM2 upregulation in bone marrow from different types of AML (data from BloodSpot) (57). (C) Volcano plot showing log2 fold change (log2FC) of RNA expression of splicing factors between knockdown and control in THP-1. We marked out with black color the significantly changed (log2FC > 1, q-value < 0.05) splicing factors, and representative splicing factors with other colors. (D) Numbers of live/dead cells upon SRRM2 knockdown in THP-1 cells. We cultured 3000 virus-infected cells (72 h) for 2 days before counting cells. (E) GSEA analysis showing that knockdown of SRRM2 influenced G2M checkpoint. We compared gene expression of SRRM2 knockdown to scramble control, based on RNA-seq data. P-value = 0.0000, FDR = 0.0000. We used hallmark gene sets and gene ontology (GO) gene sets for this analysis. (F) FACS assay for detection of the THP-1 surface expression of CD14 and CD11b following shRNA mediated knockdown of splicing factors, without or with PMA treatment (10 ng/ml for 48 h). (G) Pathway analysis by KEGG, Reactome, and PANTHER showing that SRRM2 knockdown downregulates one carbon metabolism (serine metabolism) pathways. (H and I) Gene expression validation by qRT-PCR showing significant downregulation of genes that govern serine biogenesis (PHGDH, PSAT1) and mitochondrial 1-C metabolism/folate cycle pathways (MTHFD2) (H) and their upstream transcription factor ATF4 (I), upon SRRM2 but not SRRM1 knockdown. Data are mean ± s.e.m. (n = 3 experiments). Statistical significance determined using one-way ANOVA test (*P < 0.05; **P < 0.01 and ***P < 0.001. ns: no significant difference).
Figure 4.
Figure 4.
SRRM2 condensates maintain proper alternative splicing. (A) Gene Ontology of DASEs induced by SRRM1 or SRRM2 knockdown. (B) Splicing subtypes of DASEs induced by SRRM1 or SRRM2 knockdown. (C) Overlap and subtypes of SRRM1 and SRRM2 co-regulated DASEs. SE: skipped (cassette) exon; MXE: mutually exclusive exon; RI: Retained Intron; A5SS: alternative 5’ splice sites; A3SS: alternative 3’ splice sites. (D) Numbers of SRRM1 and SRRM2 regulated DASEs. We show for each splicing subtype the numbers of total, positive ΔPSI (enhanced inclusion or longer isoform) and negative ΔPSI (enhanced skipping or shorter isoform). (E) Two validation examples of SRRM1/SRRM2 co-regulated DASEs. Upper graph: PSI based on rMATS analysis. Lower gel: RT-PCR validation showing percentage of inclusion band. (F) Validation examples of SRRM1 (red) but not SRRM2 (green) DASEs. (G) Validation examples of SRRM2 (green) but not SRRM1 (red) DASEs. (H) Correlation of ΔPSI between RT-PCR validation and rMATS analysis of RNA-seq data. (I) Minigene experiment of SRRM2 targets FES and SH3BP2. We transfected either control or SRRM2 knockdown HEK293T cells with minigenes and visualized minigene splicing patterns via RT-PCR. DASEs (|ΔPSI|>0.1, FDR < 0.05). (JK) DASE analysis by RT-PCR (J) and quantification of ΔPSI (PSI_KD – PSI_Ctrl) (K) upon SRRM2 knockdown and rescue with Control, Full-length (FL) SRRM2, or ΔUPRΔDPR. Red label: genes with splicing change caused by KD can only be rescued by FL; green label: targets rescued by both FL and ΔUPRΔDPR. Data are mean ± s.e.m. (n = 3 experiments). Statistical significance determined using one-way ANOVA test (*P < 0.05; **P < 0.01 and ***P < 0.001. ns: no significant difference).
Figure 5.
Figure 5.
SRRM2 targets exhibit specific splicing features. (A) Violin plots showing that knockdown of SRRM2 mainly induced exon skipping, with SRRM1 knockdown as control. Enhanced/Silenced: higher inclusion/skipping of cassette exons. (B) Splice-site strength of SRRM2-regulated DASEs. We analyzed the 5’ SS (splice site) score of 5’ exons and cassette exons and 3’ SS score of cassette exons and 3’ exons of either SRRM1- or SRRM2-regulated DASEs. Yellow lines label the average score of controls. (C) Intron length of SRRM2-regulated DASEs, compared to either SRRM1 or SRRM1/SRRM2 coregulated DASEs. (D) Summary of splicing features of SRRM2. Top, SRRM2 regulated cassette exons possess weak 5’ splice sites and are flanked by short introns. (E) SRRM2 knockdown induced exon-skipping events have a higher percentage (25%) of non-annotated cassette exons (CE). (F) Domain analysis for validated DASEs upon suppression of SRRM2, with some genes as examples. 61% of validated targets displayed domain change (32% with <50% domain change affected plus 29% with >50% domain change), and 40% have strong protein changes (29% of >50% domain change plus the 11% for large region). Alternative CT: alternative C-terminus; AA: amino acid; Large regions: several domains affected concurrently. (G) Examples of protein domain change by single-exon skipping of PRR14 exon 7, and large region removal by multiple skipping of METTL26 (c16orf13) exons 2–5. We show the reads based on RNA-seq data as generated by IGV software. Validation shown in Figure S5A (with PSI derived from RNA-seq and alternative splicing analysis). Statistical significance determined using one-way ANOVA test (*P < 0.05; **P < 0.01; ***P < 0.001. ns: no significant difference).
Figure 6.
Figure 6.
Alternative splicing of the SRRM2 targets FES and MUC1 regulates innate immunity and cell homeostasis. (A) SRRM2 regulates alternative splicing of FES. Map of reads: IGV software; PSI: rMATS analysis; Splicing validation by RT-PCR (Figure S5A). (B) Diagram of mouse and human FES domains including SH2 affected by alternative splicing in human only, and targeting shRNAs (green arrow showing shRNA targeting iso1/2, red arrow showing shRNA targeting all isoforms). Iso, isoform. (C) Isoform-specific knockdown effect of FES shRNAs. (D) Relative expression of TNFα and IL1β proinflammatory cytokines upon isoform-specific knockdown of FES in human macrophage-like THP-1 cells under LPS (1 ng/ml) for 6 h. To observe a stronger phenotype upon FES knockdown, we used a weak LPS stimulation with little effect on THP-1 inflammation. (E) Sunburst diagram showing the effect of CPT drug, and combined CPT plus SRRM2 knockdown on SRRM2 DASEs. (F) Cell viability analysis of THP-1 cells upon SRRM2 knockdown with either CPT or AZA treatment for 24 h. (G) Expression of MUC1 upon SRRM2 knockdown in THP-1, measured by RNA-seq or qRT-PCR. (H) RNA-seq analysis showing the reads and annotations of spliced exons of MUC1 upon SRRM2 knockdown and CPT treatment. (I) RT-PCR validation of the skipping of exons 3 or 4 upon SRRM2 knockdown. (J) PSI differences and statistical analysis of MUC1 exon 3 and 4 upon SRRM2 knockdown and combined treatment with CPT. (K) Graphic diagram showing SRRM2 regulates exon 4 skipping to modulate MUC1 shedding. MUC-N: N-terminal domain; MUC1-C: C-terminal domain; SEA: Sperm protein, Enterokinase and Agrin; GSVVV: cleavage site for proteases TACE or ADAM9; Glycosylation: protein modification. Shedding generates soluble MUC1, promoting cancer progression or regulating immune response. Data are mean ± s.e.m. (n = 3 experiments). Statistical significance determined using one-way ANOVA or two-way ANOVA (F) with Bonferroni correction for multiple comparison (*P < 0.05; **P < 0.01; ***P < 0.001. ns: no significant difference).

Similar articles

Cited by

References

    1. Das R.K., Ruff K.M., Pappu R.V.. Relating sequence encoded information to form and function of intrinsically disordered proteins. Curr. Opin. Struct. Biol. 2015; 32:102–112. - PMC - PubMed
    1. Alberti S., Gladfelter A., Mittag T.. Considerations and challenges in studying liquid-liquid phase separation and biomolecular condensates. Cell. 2019; 176:419–434. - PMC - PubMed
    1. Shin Y., Brangwynne C.P.. Liquid phase condensation in cell physiology and disease. Science. 2017; 357:eaaf4382. - PubMed
    1. Spector D.L., Lamond A.I.. Nuclear speckles. Cold Spring Harb. Perspect. Biol. 2011; 3:a000646. - PMC - PubMed
    1. Fei J., Jadaliha M., Harmon T.S., Li I.T.S., Hua B., Hao Q., Holehouse A.S., Reyer M., Sun Q., Freier S.M.et al. .. Quantitative analysis of multilayer organization of proteins and RNA in nuclear speckles at super resolution. J. Cell Sci. 2017; 130:4180–4192. - PMC - PubMed

Publication types