Clinical Trial
. 2022 Oct;13(5):2537-2550.
doi: 10.1002/jcsm.13050. Epub 2022 Aug 4.

Altered muscle oxidative phenotype impairs exercise tolerance but does not improve after exercise training in multiple sclerosis

Affiliations
Clinical Trial

Altered muscle oxidative phenotype impairs exercise tolerance but does not improve after exercise training in multiple sclerosis

Jan Spaas et al. J Cachexia Sarcopenia Muscle. 2022 Oct.

Abstract

Background: Patients with multiple sclerosis (MS) experience reduced exercise tolerance that substantially reduces quality of life. The mechanisms underpinning exercise intolerance in MS are not fully clear. This study aimed to determine the contributions of the cardiopulmonary system and peripheral muscle in MS-induced exercise intolerance before and after exercise training.

Methods: Twenty-three patients with MS (13 women) and 20 age-matched and sex-matched healthy controls (13 women) performed a cardiopulmonary exercise test. Muscle fibre type composition, size, succinate dehydrogenase (SDH) activity, capillarity, and gene expression and proteins related to mitochondrial density were determined in vastus lateralis muscle biopsies. Nine MS patients (five women) were re-examined following a 12 week exercise training programme consisting of high-intensity cycling interval and resistance training.

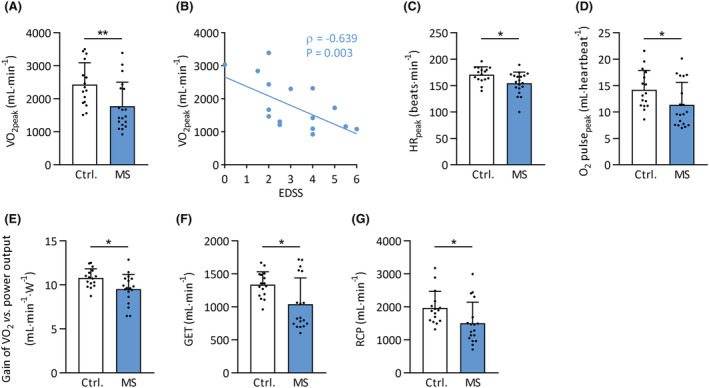
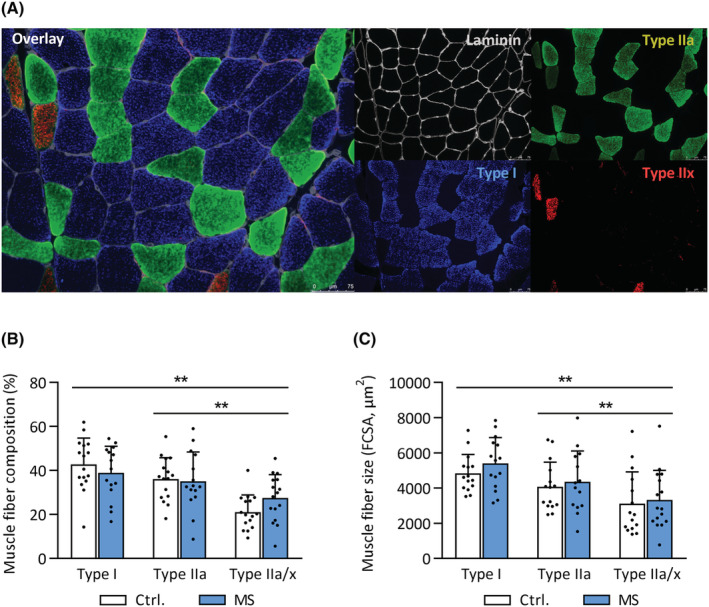
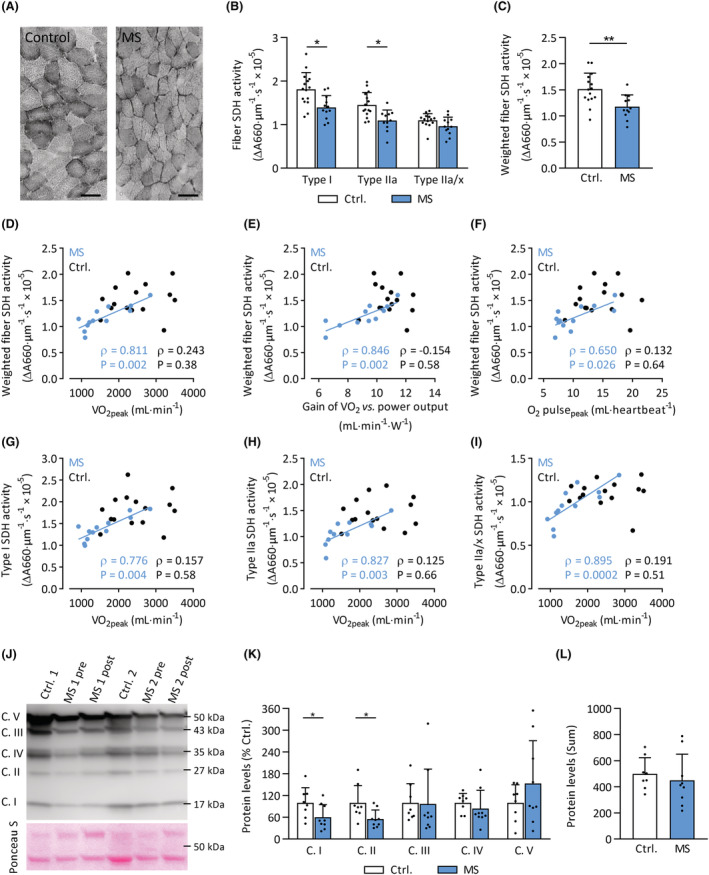
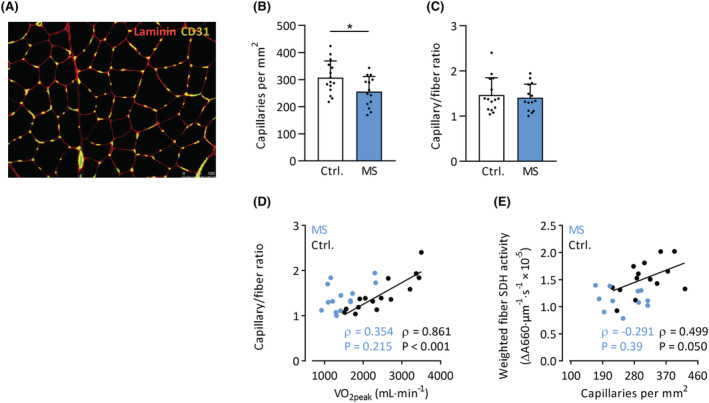
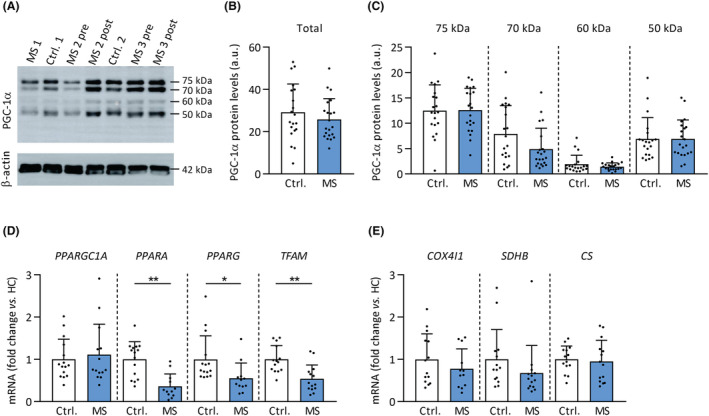
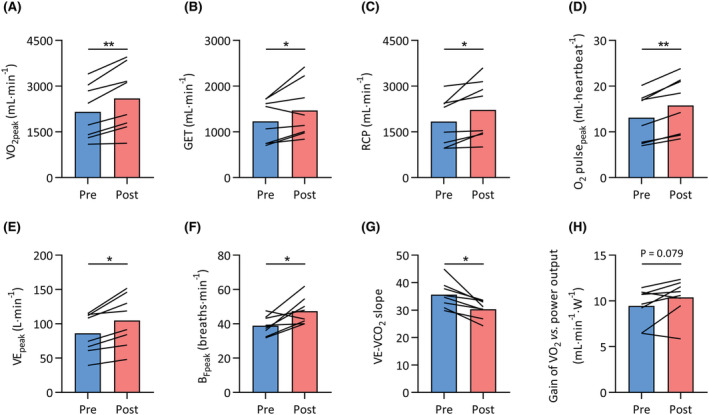
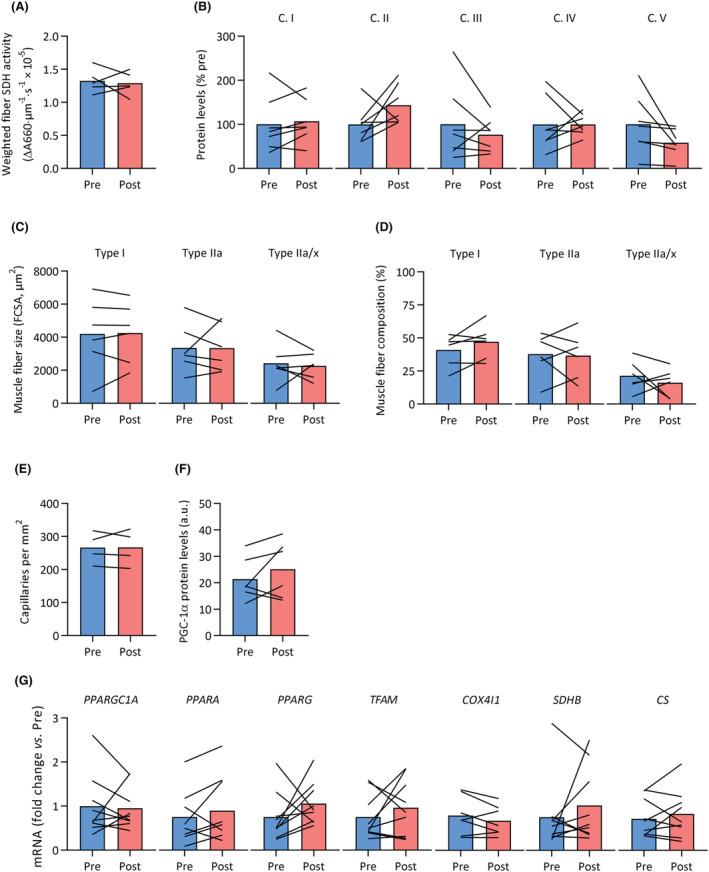
Results: Patients with MS had lower maximal oxygen uptake compared with healthy controls (V̇O2peak , 25.0 ± 8.5 vs. 35.7 ± 6.4 mL/kg/min, P < 0.001). The lower gas exchange threshold (MS: 14.5 ± 5.5 vs. controls: 19.7 ± 2.9 mL/kg/min, P = 0.01) and slope of V̇O2 versus work rate (MS: 9.5 ± 1.7 vs. controls: 10.8 ± 1.1 mL/min/W, P = 0.01) suggested an intramuscular contribution to exercise intolerance in patients with MS. Muscle SDH activity was 22% lower in MS (P = 0.004), and strongly correlated with several indices of whole-body exercise capacity in MS patients (e.g. V̇O2peak , Spearman's ρ = 0.81, P = 0.002), but not healthy controls (ρ = 0.24, P = 0.38). In addition, protein levels of mitochondrial OXPHOS complexes I (-40%, P = 0.047) and II (-45%, P = 0.026) were lower in MS patients versus controls. Muscle capillary/fibre ratio correlated with V̇O2peak in healthy controls (ρ = 0.86, P < 0.001) but not in MS (ρ = 0.35, P = 0.22), and did not differ between groups (1.41 ± 0.30 vs. 1.47 ± 0.38, P = 0.65). Expression of genes involved in mitochondrial function, such as PPARA, PPARG, and TFAM, was markedly reduced in muscle tissue samples of MS patients (all P < 0.05). No differences in muscle fibre type composition or size were observed between groups (all P > 0.05). V̇O2peak increased by 23% following exercise training in MS (P < 0.001); however, no changes in muscle capillarity, SDH activity, gene or protein expression were observed (all P > 0.05).

Conclusions: Skeletal muscle oxidative phenotype (mitochondrial complex I and II content, SDH activity) is lower in patients with MS, contributing to reduced exercise tolerance. However, skeletal muscle mitochondria appeared resistant to the beneficial effects of exercise training, suggesting that other physiological systems, at least in part, drive the improvements in exercise capacity following exercise training in MS.

Keywords: Exercise capacity; Exercise therapy; Mitochondria; Multiple sclerosis; Oxidative metabolism; Skeletal muscle.


Conflict of interest statement

The authors declare that they have no conflict of interest.

Figures

Figure 1
Figure 1
Lower exercise capacity in MS. Variables determined during cardiopulmonary exercise testing in MS patients and healthy controls. Black circles represent individual participant values. (A) Peak oxygen uptake (V̇O2peak) in MS patients versus controls. (B) Relationship between V̇O2peak and score on the expanded disability status scale (EDSS) within the MS patients. (C) Peak heart rate (HRpeak) in MS patients versus controls. (D) Peak O2 pulse (O2 pulsepeak), determined as V̇O2peak/HRpeak in MS patients versus controls. (E) Gain of the relationship between V̇O2 and change in external power output in MS patients versus controls. (F) Gas exchange threshold (GET) in MS versus controls. (G) Respiratory compensation point (RCP) in MS versus controls. *P < 0.05; **P < 0.01. Mean ± SD.
Figure 2
Figure 2
Normal muscle fibre size and composition in MS. Vastus lateralis biopsies were obtained from MS patients and healthy controls. (A) Representative immunohistochemistry images showing the presence of myosin heavy chain type I, IIa, and IIx, delineated by laminin‐stained cell membranes. Scale bar: 75 μm. (B) Muscle fibre type composition of type I, IIa, and IIa/x fibres in MS and controls. (C) Fibre cross‐sectional area (FCSA) of type I, IIa, and IIa/x fibres in MS and controls. **P < 0.01 for main effect of fibre type (from mixed model analysis). Mean ± SD.
Figure 3
Figure 3
Lower muscle fibre SDH activity and mitochondrial complex I and II protein levels in MS. (A) Grey‐scale images stained for SDH activity from representative MS and control subjects. Scale bar: 100 μm. (B) Fibre SDH activity in type I, type IIa, and type IIa/x muscle fibres of MS patients (blue bars) and controls (clear bars). (C) SDH activity weighted for muscle fibre composition in MS patients (blue bars) compared with controls (clear bars). Relationships between weighted SDH activity and (D) peak oxygen uptake (V̇O2peak); (E) gain of the V̇O2 versus power output relationship; (F) peak O2 pulse (O2 pulsepeak). Relationship between V̇O2peak and SDH activity in type I, IIa, and IIa/x (G–I) in MS patients (blue circles) and controls (black circles). (J) Representative Western immunoblot with subunits for complex (C.) I, II, III, IV, and V protein bands at different molecular weights, and Ponceau S loading control. (K) Quantification of subunits of mitochondrial complex protein levels, relative to controls. (L) Total mitochondrial OXPHOS protein levels in MS and controls, calculated as the sum of individual complexes. *P < 0.05, **P < 0.01. Mean ± SD.
Figure 4
Figure 4
Muscle capillarity in MS patients and controls. (A) Representative immunohistochemical section stained for capillaries (CD31+) and membranes (laminin). Scale bar: 100 μm. Capillary density (B) and capillary/fibre ratio (C) in MS patients and controls. Relationships between V̇O2peak and muscle capillary/fibre ratio (D) and muscle capillary density and SDH activity (E). *P < 0.05. Mean ± SD.
Figure 5
Figure 5
Protein and gene expression levels of mitochondrial‐related genes in MS. PGC‐1α protein content and mRNA expression of mitochondrial transcription factors and genes by qPCR were determined in vastus lateralis biopsies of MS patients and healthy controls. (A) Representative Western immunoblot with PGC‐1α protein bands at different molecular weights. Total (B) and individual bands (C) of PGC‐1α protein levels in MS and controls. (D) Quantitative mRNA expression analyses of mitochondria‐related transcription factors and genes (E). *P < 0.05, **P < 0.01. Mean ± SD.
Figure 6
Figure 6
Improved exercise capacity following exercise training in MS. Whole‐body exercise capacity was assessed before (pre, blue bars) and after (post, red) a 12 week exercise training intervention in a subset of patients with MS. (A) Peak oxygen uptake (V̇O2peak), (B) gas exchange threshold (GET), (C) respiratory compensation point (RCP), (D) peak oxygen pulse (O2 pulsepeak), (E) peak ventilation (V̇Epeak), (F) peak breathing frequency (BFpeak), (G) slope of the relationship between ventilation and carbon dioxide output (V̇E‐V̇CO2 slope), and (H) gain of the relationship between V̇O2 and external power output. *P < 0.05, **P < 0.01.
Figure 7
Figure 7
Skeletal muscle fibre composition, fibre size, oxidative capacity, mitochondrial OXPHOS protein levels, capillarity and mitochondrial signalling did not respond to exercise training in MS. Vastus lateralis biopsies were obtained from patients with MS before (pre, blue) and after (post, red) a 12 week exercise training intervention. No significant differences were observed in (A) SDH activity weighted for muscle fibre type, (B) mitochondrial OXPHOS protein levels (complex [C.] I to V), (C) fibre cross‐sectional area (FCSA) for type I, IIa and IIa/x fibres, (D) fibre type composition, (E) capillary density, (F) PGC‐1α protein content, and (G) mRNA expression of various mitochondrial transcription factors and genes.

References

    1. Ontaneda D, Thompson AJ, Fox RJ, Cohen JA. Progressive multiple sclerosis: prospects for disease therapy, repair, and restoration of function. Lancet 2017;389:1357–1366. - PubMed
    1. Dalgas U, Stenager E. Exercise and disease progression in multiple sclerosis: can exercise slow down the progression of multiple sclerosis? Ther Adv Neurol Disord 2012;5:81–95. - PMC - PubMed
    1. Casey B, Coote S, Galvin R, Donnelly A. Objective physical activity levels in people with multiple sclerosis: meta‐analysis. Scand J Med Sci Sports 2018;28:1960–1969. - PubMed
    1. Marrie RA. Comorbidity in multiple sclerosis: Past, present and future. Clin Invest Med 2019;42:E5–E12. - PubMed
    1. Motl RW, Dlugonski D, Pilutti L, Sandroff B, McAuley E. Premorbid physical activity predicts disability progression in relapsing–remitting multiple sclerosis. J Neurol Sci 2012;323:123–127. - PubMed

Publication types