. 2022 Oct 27;34(11):4600-4622.
doi: 10.1093/plcell/koac238.

Eudicot primary cell wall glucomannan is related in synthesis, structure, and function to xyloglucan

Affiliations

Eudicot primary cell wall glucomannan is related in synthesis, structure, and function to xyloglucan

Li Yu et al. Plant Cell. .

Abstract

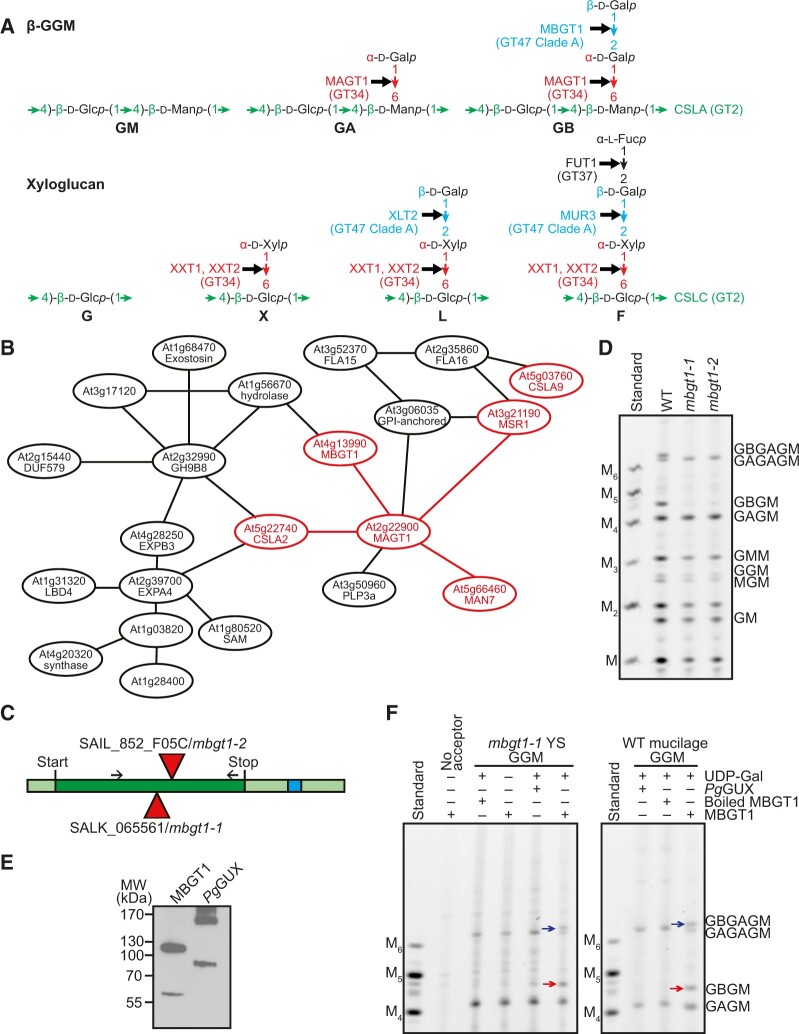
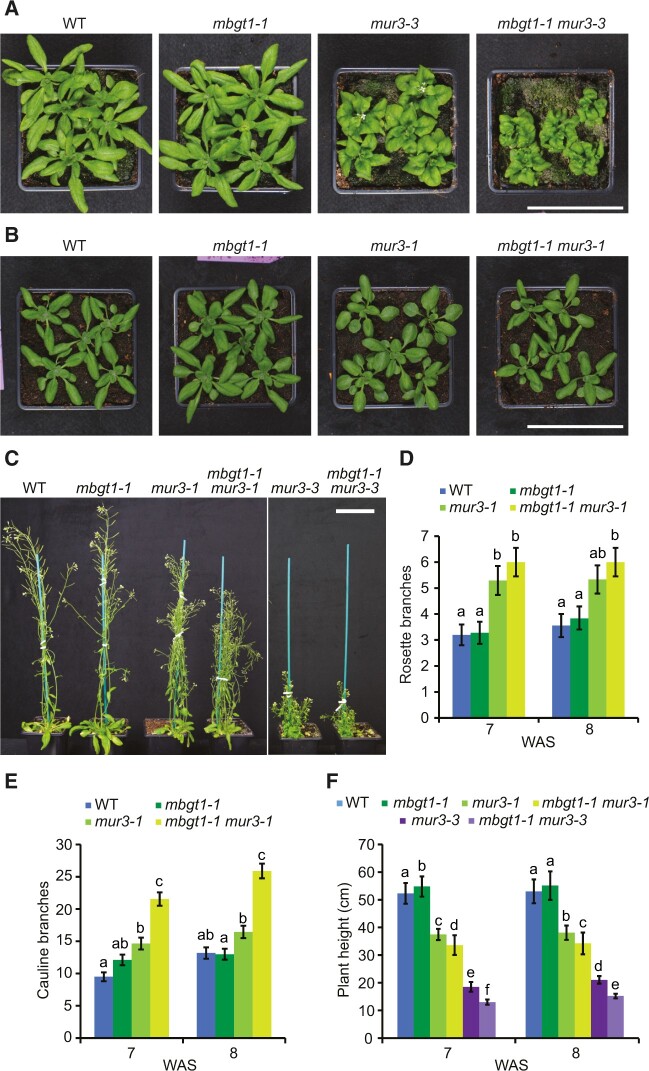
Hemicellulose polysaccharides influence assembly and properties of the plant primary cell wall (PCW), perhaps by interacting with cellulose to affect the deposition and bundling of cellulose fibrils. However, the functional differences between plant cell wall hemicelluloses such as glucomannan, xylan, and xyloglucan (XyG) remain unclear. As the most abundant hemicellulose, XyG is considered important in eudicot PCWs, but plants devoid of XyG show relatively mild phenotypes. We report here that a patterned β-galactoglucomannan (β-GGM) is widespread in eudicot PCWs and shows remarkable similarities to XyG. The sugar linkages forming the backbone and side chains of β-GGM are analogous to those that make up XyG, and moreover, these linkages are formed by glycosyltransferases from the same CAZy families. Solid-state nuclear magnetic resonance indicated that β-GGM shows low mobility in the cell wall, consistent with interaction with cellulose. Although Arabidopsis β-GGM synthesis mutants show no obvious growth defects, genetic crosses between β-GGM and XyG mutants produce exacerbated phenotypes compared with XyG mutants. These findings demonstrate a related role of these two similar but distinct classes of hemicelluloses in PCWs. This work opens avenues to study the roles of β-GGM and XyG in PCWs.


Figures

Figure 1
Figure 1
Two glucomannan types with distinct structures, synthesized by CSLA2 and CSLA9, are widely present in Arabidopsis PCW-rich tissues. Materials from five tissues (etiolated seedling, young stem, seeds with mucilage removed [naked seed], leaves, and silique) were analyzed by PACE. Hemicelluloses were extracted from Col-0, csla2, csla9, csla2 csla9, and magt1 cell wall material using alkali before being hydrolyzed with endo-mannanase CjMan26A. The products were subsequently derivatized with a fluorophore and separated by gel electrophoresis. The csla2 mutant yielded oligosaccharides with a low DP, whereas the WT and csla9 mutant walls yielded longer oligosaccharides. The four main oligosaccharides (named S1–S4) are labeled with colored arrows in samples from csla9. In leaves, the amount of S1–S4 was low, and they are missing in magt1 mutants. M, Man; G, Glc; Manno-oligosaccharide standards M to M6 are shown.
Figure 2
Figure 2
Structural analysis of β-galactosylated glucomannan oligosaccharides from Arabidopsis young stem. A, Characterization of glucomannan oligosaccharides released from WT, csla2, csla9, and magt1 cell walls by CjMan26A. Glucomannan from csla2 is degraded into M, MM, GMM, and oligosaccharides migrating near M4. Many WT and csla9 glucomannan oligosaccharides are resistant to β-glucosidase (β-Glc) and β-mannosidase (β-Man) enzyme digestions, whereas oligosaccharides from csla2 are reduced to mono and disaccharides. B, Degradation of β-galactosylated glucomannan oligosaccharides from csla9 young stem analyzed by PACE. β-Gal, α-Gal, β-Glc, and β-Man enzymes were used sequentially. C, Products of CjMan26A digestion of csla9 cell walls were labeled with 2-AB and analyzed by MALDI-TOF MS. The four main peaks correspond to the saccharides S1–S4. D, S2 Hex6 in C was analyzed by high-energy CID MS/MS. The CID spectrum indicates that the α-Gal residue is linked to C-6 of the third hexose from the reducing end and that the β-Gal residue is linked to the C-2 or C-3 of the α-Gal. E, Nuclear magnetic resonance (NMR) analysis of S2. H-1 strip plots from 2D 1H-1H TOSCY, ROESY, and DQFCOSY spectra, showing the nuclear Overhauser effect (NOE) connectivity arising from the β-Galp-1,2-α-Galp linkage. F, A single-letter nomenclature for the identified β-GGM backbone and possible side chains. G, Characterization of AnGH5 β-GGM glucomannan digestion products by PACE. AnGH5 cleaves β-GGM from csla9 young stem cell walls into GM, GA, GBGM, and GBGA oligosaccharides. H, Proportion of β-GGM disaccharides with different side chains from AnGH5 digestion of etiolated csla9 seedling glucomannan and PACE densitometry (n =4). Error bars show the sd. Manno-oligosaccharide standards M to M6 are shown.
Figure 3
Figure 3
AT4G13990 from CAZy GT47 Clade A encodes Arabidopsis MBGT1. A, β-GGM and XyG share structural and biosynthesis similarities. These two polysaccharides exhibit analogous linkages in their backbones and corresponding side chain sugars. For each position in the hemicellulose, the responsible glycosyltransferases are from the same CAZy family. B, AT4G13990/MBGT1 from GT47 Clade A is in a co-expression network with CSLA2 and other mannan-related genes. C, Gene model representing MBGT1. Triangles represent the position of T-DNA insertions in mutant lines analyzed in this study. Dark green represents the exon. Light green represents the UTR and blue shows an intron. D, Stem material of two insertional mutants of the MBGT1 gene was analyzed by PACE by CjMan26A. No β-galactosylated oligosaccharide was detected in either mbgt1 mutant. E, Immunoblot of 3× Myc-tagged recombinant proteins expressed in N. benthamiana. The expected mass of 3× Myc–MBGT1 is 64.86 kDa. The expected mass of the control enzyme 3× Myc–PgGUX is 78.18 kDa. Data might suggest the proteins form stable dimers. F, In vitro activity of the recombinant MBGT1 protein. In the left panel, mbgt1-1 young stem (YS) glucomannan was used as an acceptor for MBGT1-mediated galactosylation, whereas in the right panel, WT adherent mucilage glucomannan was used. The products were analyzed with PACE using digestion with CjMan26A. Arrows indicate band shifts after each reaction. Manno-oligosaccharide standards M to M6 are shown.
Figure 4
Figure 4
Un-rooted phylogenetic tree of CAZy GT47 Clade A. Sequences from the genomes of 96 streptophytes (Supplemental Table S2) were used to construct a comprehensive phylogeny of GT47 Clade A. Most sequences were downloaded from PLAZA (https://bioinformatics.psb.ugent.be/plaza/), but were supplemented with additional sequences from further genomes, derived from HMMER and TBLASTN searches. The streptophyte algae representative is Klebsormidium nitens, and the Lycopodiophyte representative is Selaginella moellendorffii. Sequences were aligned with MAFFT and truncated to leave only the predicted GT47 domain. The phylogeny was then inferred using FastTree, with 100 bootstrap pseudo-replicates. Percentage replication is indicated for important splits. Scale bar represents 0.3 substitutions per site. The resultant tree revealed the existence of seven main subgroups within GT47-A (groups I–VII), four of which contain known XyG glycosyltransferases. The group containing MBGT was designated group VII. For characterized enzymes, activities (as seen in Arabidopsis) are illustrated in SNFG format.
Figure 5
Figure 5
The importance of β-galactosylation of β-GGM is revealed in the XyG β-galactosylation mutant mur3. A, Four-week-old rosettes of mur3-3 T-DNA insertion mutant and mbgt1-1 mur3-3 double mutant. B, Four-week-old rosettes of mur3-1 point mutant and mbgt1-1 mur3-1 double mutant. C, Six-week-old plants, showing dwarfing of the mur3 and mbgt1-1 mur3 double mutants. D and E, Quantification of the number of rosette branches (D) and cauline branches (E) for 7- and 8-week-old mur3-1 and mbgt1-1 mur3-1 plants. mbgt1-1 mur3-1 mutants show no significant change in rosette branches, but a significant increase in cauline branches compared with mur3-1. Data were modeled by Poisson regression; a likelihood ratio test indicated a significant contribution of genotype in determining the number of stems (Rosette branches 7 weeks: n =75, G23 = 26.2, P =8.6 × 10−6; 8 weeks: n =74, G23 = 16.6, P =8.4 × 10−4). Cauline branches 7 weeks: n =75, G23 = 109, P <2.2 × 10−16; 8 weeks: n =73, G23 = 144, P =1.5 × 10−24). Results of post hoc pairwise comparisons (within each time point) are indicated by compact letter display (letter sharing indicates lack of significant difference, i.e., where P >0.05). Data were modeled by Poisson regression; a likelihood ratio test indicated a significant contribution of genotype in determining the number of stems (Rosette branches 7 weeks: n =75, G23 = 26.2, P =8.6 × 10−6; 8 weeks: n =74, G23 = 16.6, P =8.4 × 10−4). Cauline branches 7 weeks: n =75, G23 = 109, P <2.2 × 10−16; 8 weeks: n =73, G23 = 144, P =1.5 × 10−24). Error bars represent standard error of the mean. F, Quantification of plant height for 7- and 8-week-old plants. One-way, two-tailed ANOVA indicated a significant contribution of genotype in determining plant height at both timepoints (7 weeks: n =208, F5,202 = 1257, P <2 × 10−16; 8 weeks: n =200, F5,194 = 760, P <2 × 10−16). Results of post hoc pairwise comparisons (within each time point) are indicated by compact letter display. Apart from the significant difference between WT and mbgt1-1 at 7 weeks, where P =0.0066, P <1 × 10−6 for all significant differences. Error bars represent standard deviation. WAS, week after sowing. Scale bars = 9 cm.
Figure 6
Figure 6
β-GGM function in PCWs is revealed when the XyG is missing. A, Four-week-old rosettes. Scale bar = 9 cm. B, Six-week-old plants. Scale bar = 9 cm. C, Quantification of plant height for 6-, 7-, and 8-week-old plants. One-way, two-tailed ANOVA indicated a significant contribution of genotype in determining plant height at all three timepoints (6 weeks: n =131, F3,127 = 65.0, P <2 × 10−16; 7 weeks: n =136, F3,132 = 88.2, P <2 × 10−16; 8 weeks: n =131, F3,127 = 35.8, P <2 × 10−16). Results of post hoc pairwise comparisons (Tukey’s honest significant difference) are indicated by compact letter display. For all significant differences, P <0.001 apart from WT–clsa2 at week 7 (P =0.0063) and csla2xxt1 xxt2 at week 8 (P =0.0026). Error bars indicate standard deviation. D, Siliques from 7-week-old plants. Scale bar = 2 cm. E, Violin plot of silique length. Siliques from more than three plants were measured for each genotype. Black circles indicate individual measurements; white lines represent the group mean. One-way, two-tailed ANOVA indicated a significant contribution of genotype in determining silique length (n =89, F3,85 = 553, P <2 × 10−16). Results of post hoc pairwise comparisons (Tukey’s honest significant difference; WT, n =22; csla2, n =25; xxt1 xxt2, n =23; csla2 xxt1 xxt2, n =19) are indicated with asterisks (*P <0.05, ***P <0.001).
Figure 7
Figure 7
A role of β-GGM in cell expansion and cellulose organization. A, Six-day-old hypocotyls grown on MS medium with sucrose. Scale bar = 1 cm. B, Quantification of hypocotyl length for 3- to 6-day-old seedlings (n ≥ 40 seedlings for each point per genotype). DAS, days after sowing. Error bars represent standard deviation. Although one-way, two-tailed ANOVA indicated no significant difference between genotypes at 4 days (n =213, F3,209 = 2.58, P =0.054), a significant difference was seen at 3 days, 5 days, and after (3 days: n =197, F3,193 = 40.7, P <2 × 10−16; 5 days: n =276, F3,272 = 82.8, P <2 × 10−16; 6 days: n =271, F3,267 = 177, P <2 × 10−16; 7 days: n =245, F3,241 = 167, P <2 × 10−16). Results of post hoc pairwise comparisons (Tukey’s honest significant difference) are indicated by compact letter display. C, Cryo-SEM analysis of 4-day-old etiolated seedlings from WT and mutant plants. Individual cells in the tissue are outlined. Cells are shorter in the csla2 xxt1 xxt2 triple mutant than in the xxt1 xxt2 double mutant. Scale bar = 100 μm. D, Quantification of cell length of 4-day-old hypocotyls. Black circles indicate individual measurements; white lines represent the group mean. One-way, two-tailed ANOVA indicated a significant contribution of genotype in determining hypocotyl cell length (n =413, F3,409 = 40.44, P <2 × 10−16). Results of post hoc pairwise comparisons (Tukey’s honest significant difference) are indicated by asterisks (*P <0.05, **P <0.01, ***P <0.001). E, Heatmap showing 4-day-old hypocotyl cell length. Scale bar = 500 μm. F and G, Four-day-old hypocotyls were stained with Pontamine S4B and then observed under a confocal microscope. Representative image of hypocotyl PCW (F). A survey of orthogonal views showing the profile of the hypocotyl PCW (G). Scale bars = 10 μm.
Figure 8
Figure 8
13C CP- and DP-refocused INADEQUATE MAS ssNMR spectra show the β-GGM peaks in irx9l xxt1 xxt2 callus. The β-GGM peaks are labeled: mannose (M) and α-Gal. Also labeled are the main cellulose peaks (domain 1, C1; domain 2, C2), galacturonic acid (GalA) of pectin, and a terminal xylose (X) linked to an unknown polymer. A terminal arabinose (At) and another arabinose (Ac) are also labeled. The inset shows an overlay of the CP and DP INADEQUATE spectra for the M5, M6 region. It is clear that M5 and M6 are not visible in the DP spectrum, that is, are not mobile. Spectra were acquired at a 13C Larmor frequency of 251.6 MHz and a MAS frequency of 12.5 kHz. The spin-echo duration used was 2.24 ms.

Similar articles

Cited by

References

    1. Altschul SF, Gish W, Miller W, Myers EW, Lipman DJ (1990) Basic local alignment search tool. J Mol Biol 215: 403–410 - PubMed
    1. Altschul SF, Madden TL, Schaffer AA, Zhang J, Zhang Z, Miller W, Lipman DJ (1997) Gapped BLAST and PSI-BLAST: a new generation of protein database search programs. Nucleic Acids Res 25: 3389–3402 - PMC - PubMed
    1. Arnling Bååth J, Martinez-Abad A, Berglund J, Larsbrink J, Vilaplana F, Olsson L (2018) Mannanase hydrolysis of spruce galactoglucomannan focusing on the influence of acetylation on enzymatic mannan degradation. Biotechnol Biofuels 11: 114. - PMC - PubMed
    1. Aryal B, Jonsson K, Baral A, Sancho-Andres G, Routier-Kierzkowska AL, Kierzkowski D, Bhalerao RP (2020) Interplay between cell wall and auxin mediates the control of differential cell elongation during apical hook development. Curr Biol 30: 1733–1739 - PubMed
    1. Benselfelt T, Cranston ED, Ondaral S, Johansson E, Brumer H, Rutland MW, Wågberg L (2016) Adsorption of xyloglucan onto cellulose surfaces of different morphologies: an entropy-driven process. Biomacromolecules 17: 2801–2811 - PubMed

Publication types