. 2022 Oct 27;34(11):4274-4292.
doi: 10.1093/plcell/koac239.

The Arabidopsis Rab protein RABC1 affects stomatal development by regulating lipid droplet dynamics

Affiliations

The Arabidopsis Rab protein RABC1 affects stomatal development by regulating lipid droplet dynamics

Shengchao Ge et al. Plant Cell. .

Abstract

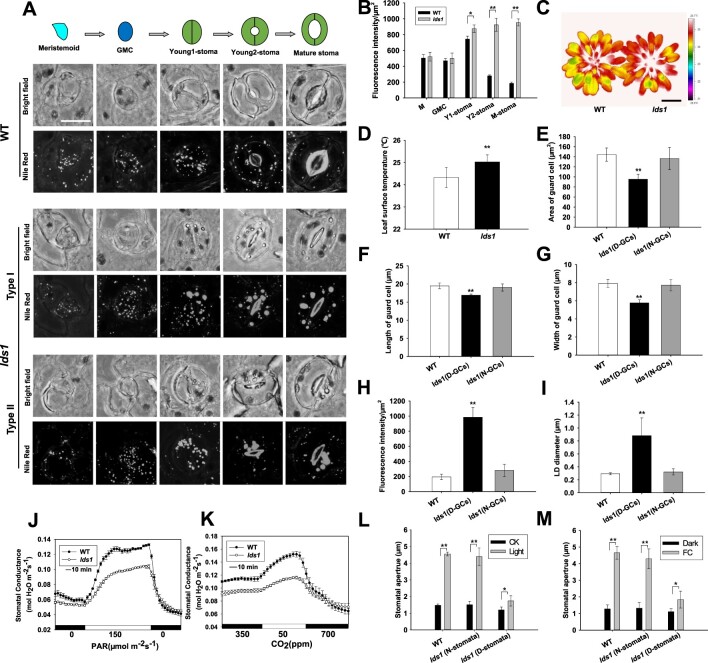
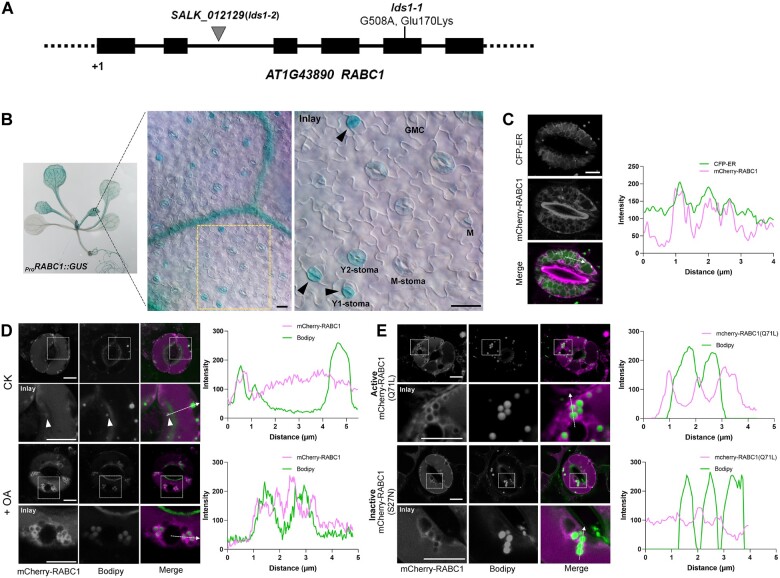
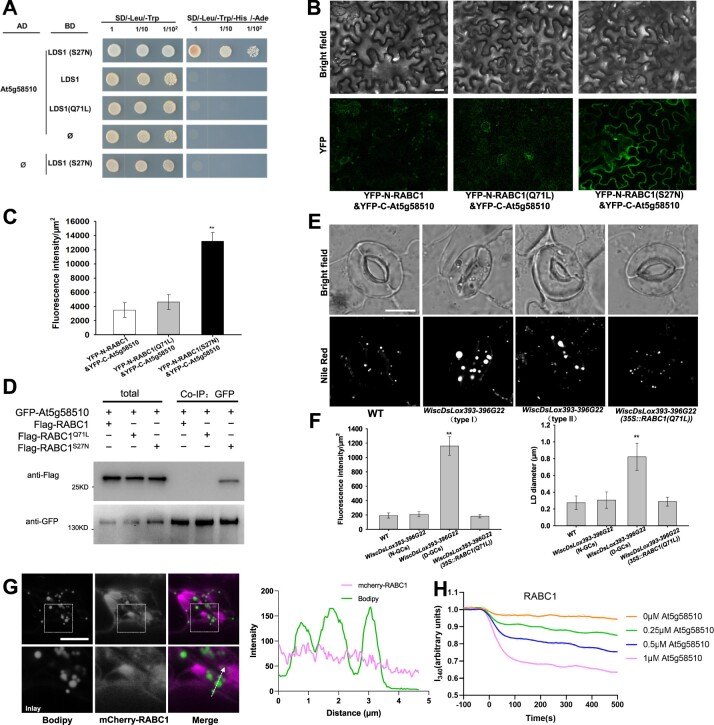
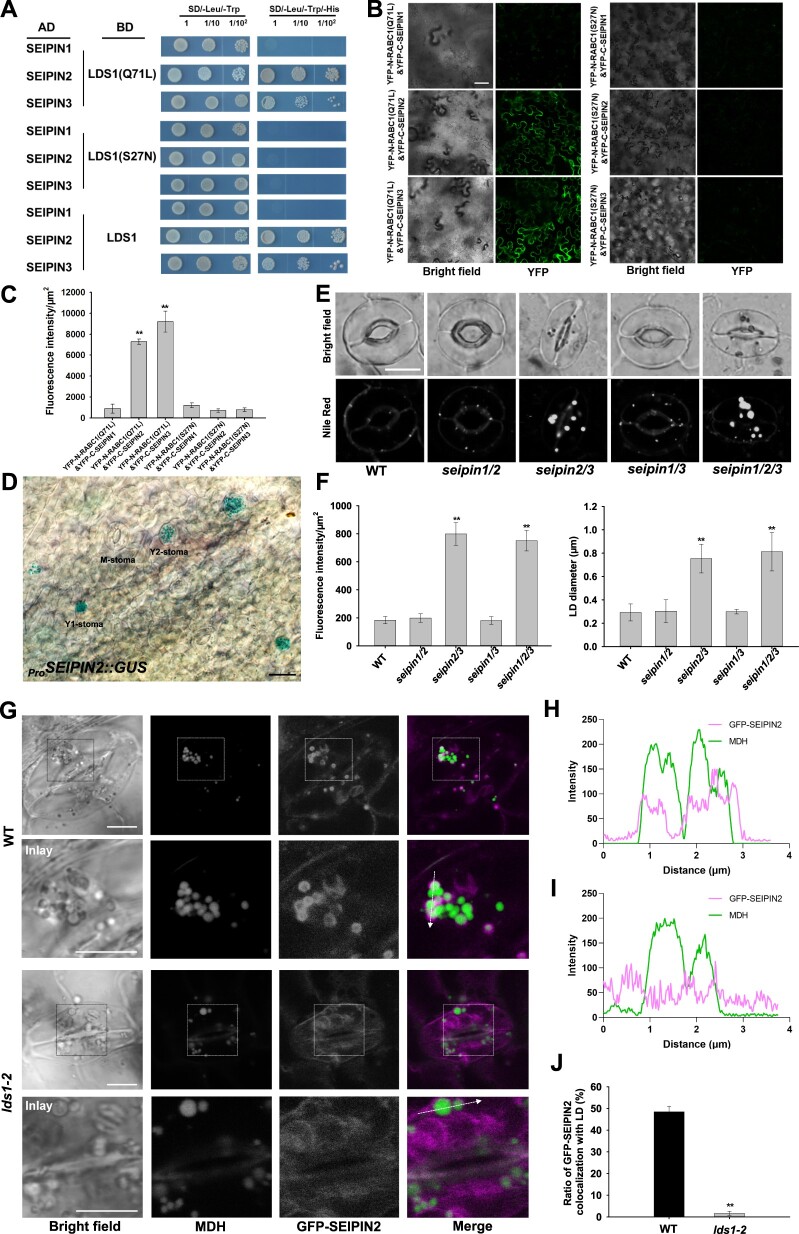
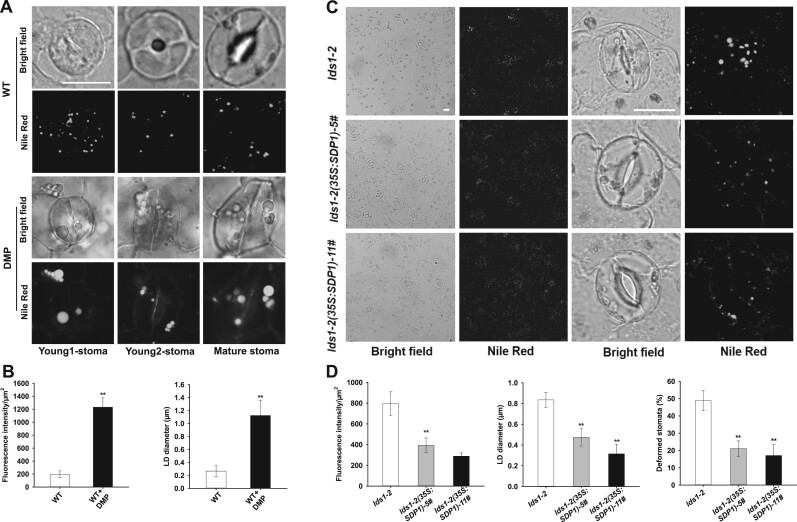
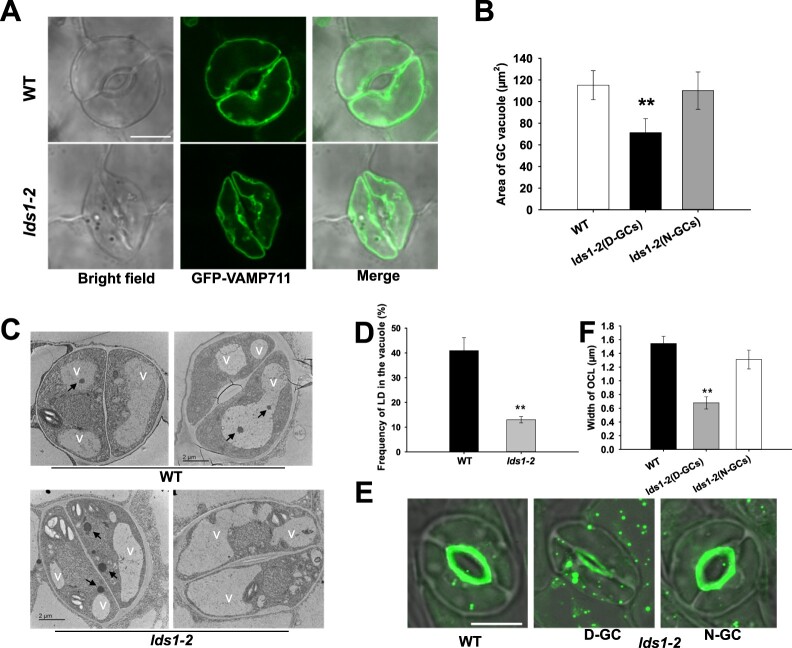
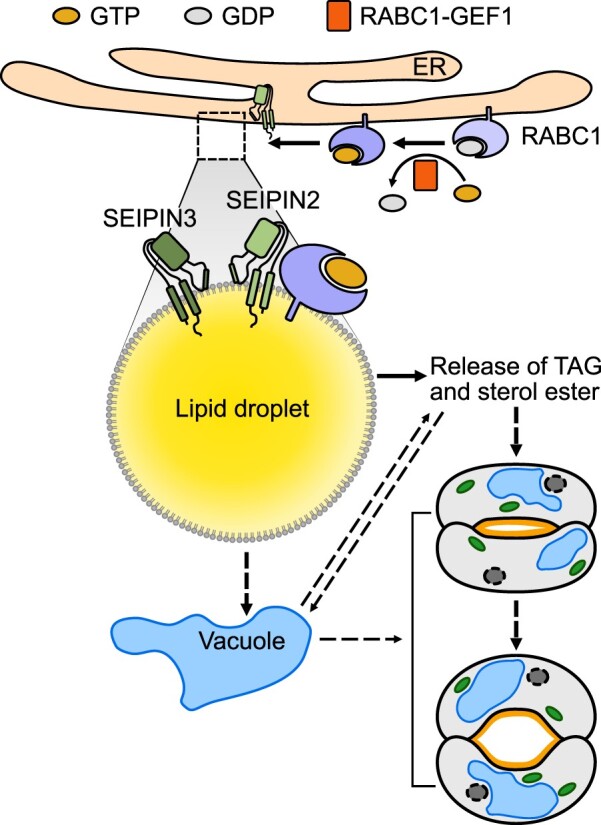
Lipid droplets (LDs) are evolutionarily conserved organelles that serve as hubs of cellular lipid and energy metabolism in virtually all organisms. Mobilization of LDs is important in light-induced stomatal opening. However, whether and how LDs are involved in stomatal development remains unknown. We show here that Arabidopsis thaliana LIPID DROPLETS AND STOMATA 1 (LDS1)/RABC1 (At1g43890) encodes a member of the Rab GTPase family that is involved in regulating LD dynamics and stomatal morphogenesis. The expression of RABC1 is coordinated with the different phases of stomatal development. RABC1 targets to the surface of LDs in response to oleic acid application in a RABC1GEF1-dependent manner. RABC1 physically interacts with SEIPIN2/3, two orthologues of mammalian seipin, which function in the formation of LDs. Disruption of RABC1, RABC1GEF1, or SEIPIN2/3 resulted in aberrantly large LDs, severe defects in guard cell vacuole morphology, and stomatal function. In conclusion, these findings reveal an aspect of LD function and uncover a role for lipid metabolism in stomatal development in plants.


Figures

Figure 1
Figure 1
The lds1 mutant displays aberrant LD size and LDs dynamics during stomatal development. A, LD dynamics in SLCs at different stages of stomatal development in WT and lds1. The representative stomatal images were Z-projections (maximal intensity) of confocal stacks from young leaves of 4-week-old plants. GMC, Scale bar, 10 μm (applies to all images in Figure 1A). B, Quantification of LD abundance at different stages of SLCs, including M (meristemoid), GMC, Y1 (young1)-stoma, Y2 (young2)-stoma, and M (mature) -stoma in lds1 and WT. Data are shown as means ± SD, n = 50. Asterisks represent Student’s t test significance (*P < 0.05; **P < 0.01). C and D, The leaf surface temperature of 5-week-old lds1 and WT under normal growth conditions in greenhouse. Scale bar, 2 cm. Data are shown as means ± SD, n = 40. Asterisks represent Student’s t test significance (**P < 0.01). E–G, Measurements of GCs area (E), length (F), and width (G) of normal shaped GCs (N-GCs) and deformed GCs (D-GCs) in lds1. Data are shown as means ± SD, n = 300. Asterisks represent Student’s t test significance (**P < 0.01). H and I, Quantifications of LDs abundance (H) and LDs diameter (I) in the normal shaped GCs (N-GCs) and deformed GCs (D-GCs) in lds1. Data are shown as means ± SD, n = 40. Asterisks represent Student’s t test significance (**P < 0.01). J and K, Light (J) and low CO2 (K)-induced increases in stomatal conductance were examined in 5-week-old lds1 and WT plants. Data are shown as means ± SD, n = 3. L and M, Stomatal opening responses induced by light (L) and fusicoccin (M) were investigated using leaf epidermal strips of 4-week-old lds1 and WT plants. N-stomata, normal-shaped stomata. D-stomata, deformed stomata. FC, fusicoccin. Data are shown as means ± SD, n≥60. Asterisks represent Student’s t test significance (*P < 0.05; **P < 0.01).
Figure 2
Figure 2
LDS1/RABC1 is highly expressed in young stomata and RABC1 targets to the surface of LDs. A, Schematic view of mutation site determination of two independent lines of lds1 mutants. B, GUS staining of a 2-week-old seedling of ProRABC1:GUS transformant. RABC1 is highly expressed in leaf veins and SLCs. The inset image shows that RABC1 is highly expressed in young GCs. Arrowheads indicate Y1-stomata. M (meristemoid), GMC, Y1 (young1), Y2 (young2), M (mature) -stoma. Scale bars, 20 μm. C, mCherry-RABC1 transformants were used to determine whether RABC1 localized to the ER. mCherry-RABC1 co-localized with CFP-ER. The fluorescence intensity profile plot of mCherry-RABC1 and CFP-ER is quantified along the dotted arrow. Scale bar, 5 μm. D, mCherry-RABC1 transformants were used to determine the relationship between RABC1 localization and LDs. Oleic acid (OA) application induces LD production. Arrowheads indicate ring-like signals surrounding LDs. The fluorescence intensity profile plots of mCherry-RABC1 and Bodipy were quantified along the dotted arrows, respectively. Scale bar, 5 μm. E, Activity status of RABC1 dictates the subcellular localization of RABC1. The fluorescence intensity profile plots of mCherry-RABC1 and Bodipy were quantified along the dotted arrows, respectively. Scale bar, 5 μm.
Figure 3
Figure 3
At5g58510 is a GEF for RABC1. A, The interaction between At5g58510 and RABC1 was dependent on the activity status of RABC1 in the Y2H system. B, BiFC was used to verify the interactions between At5g58510 and RABC1. Scale bar, 30 μm. C, Fluorescence intensity of YFP in (B) was quantified. Data are shown as means ± SD, n = 3. Asterisks represent Student’s t test significance (**P < 0.01). D, Co-IP was used to verify the interaction between At5g58510 and RABC1. E and F, Both allelic mutants of At5g58510 showed defective LDs dynamics, LDs size, and stomatal morphology. Introduction of a dominant-active form of RABC1 (Q71L) into the mutants of At5g58510 rescued the defects. The representative stomatal images were single confocal planes from young leaves of 4-week-old plants (E). LD abundance and size of GCs were quantified (F). Data are shown as means ± SD, n = 20. Asterisks represent Student’s t test significance (**P < 0.01). Scale bar, 10 μm. G, Localization of RABC1 to LDs is blocked by RABC1GEF1 deficiency. The fluorescence intensity profile plots of mCherry-RABC1 and Bodipy are quantified along the dotted arrow. Scale bar, 10 μm. H, In vitro GEF assays of At5g58510. Nucleotide exchange of RABC1 was tested by monitoring tryptophan autofluorescence in the absence or presence of 0.25 mM, 0.5 mM, or 1 mM GST-At5g58510. The raw data are the jagged lines and the bold lines represent the trend lines.
Figure 4
Figure 4
SEINPIN2 and SEIPIN3 are two effectors for RABC1. A, Interaction tests between SEIPINs and different status RABC1 in Y2H system. B, Interaction tests between SEIPINs and different status RABC1 in BiFC tests. Scale bar, 50 μm. C, Fluorescence intensity of YFP in (B) was quantified. Data are shown as means ± SD, n = 3. Asterisks represent Student’s t test significance (**P < 0.01). D, GUS staining of leaves from 2-week-old seedling of ProSEIPIN2:GUS transformant. SEIPIN2 is highly expressed in stomatal cells. Scale bar, 20 μm. E and F, Simultaneous disruption of SEIPIN2 and SEIPIN3 resulted in defective LD dynamics, aberrant LD size, and stomatal morphology. The representative stomatal images were single confocal planes from young leaves of 4-week-old plants (E). LD abundance and size of GCs were quantified (F). Data are shown as means ± SD, n = 20. Asterisks represent Student’s t test significance (**P < 0.01). Scale bar, 10 μm. G, Localization of GFP-SEIPIN2 to LDs is blocked by RABC1 deficiency. The LDs were stained with Monodansylpentane (MDH). Scale bar, 5 μm. H and I, Fluorescence intensity profile plots of GFP-SEIPIN2 and LDs in WT (H) and lds1-2 (I) are quantified along the dotted arrow in (G). J, Quantification of the proportion of GFP-SEIPIN2 localized on LDs in WT and lds1-2. Data are shown as means ± SD, n = 120. Asterisks represent Student’s t test significance (**P < 0.01).
Figure 5
Figure 5
DMP treatment mimics the phenotype of lds1 and overexpression of SDP1 partly restores the aberrant stomatal morphology of lds1. A and B, DMP treatment resulted in defective LD dynamics and stomatal morphology in WT. The representative stomatal images were single confocal planes from young leaves of 2-week-old plants (A). LD abundance and size of GCs were quantified (B). Data are shown as means ± SD, n = 30. Asterisks represent Student’s t test significance (**P < 0.01). Scale bar, 10 μm. C and D, Overexpression of SDP1 restored defects in LDs size and stomatal morphology in lds1-2. The representative stomatal images were single confocal planes from young leaves of 4-week-old plants (C). LD abundance and size (n = 30) of GCs, deformed stomata ratio (n = 400), were quantified (D). Data are shown as means ± SD. Asterisks represent Student’s t test significance (**P < 0.01). Scale bar, 20 μm.
Figure 6
Figure 6
Disruption of RABC1 function affects vacuole occupancy and OCL formation. A, Representative images of vacuoles in GCs of WT and lds1 plants. The representative stomatal images were single confocal planes from young leaves of 4-week-old plants. Scale bar, 10 μm. B, Quantification of the area of vacuoles in GCs of WT and lds1 plants. Data are shown as means ± SD, n = 50. Asterisks represent Student’s t test significance (**P < 0.01). C and D, The number of LDs in the vacuolar lumen of lds1 was reduced compared with WT. Representative TEM images of LDs in the vacuolar lumen (C), quantification of LDs in the vacuolar lumen (D). Arrows indicate LDs. V, vacuole. Data are shown as means ± SD, n = 30. Asterisks represent Student’s t test significance (**P < 0.01). E and F, The OCL of deformed GCs in lds1-2 is much thinner and narrower. The representative stomatal images were single confocal planes from young leaves of 4-week-old plants. Data are shown as means ± SD, n = 40. Asterisks represent Student’s t test significance (**P < 0.01).
Figure 7
Figure 7
Proposed working model of RABC1 regulating LD dynamics and stomatal development. RABC1, a Rab protein that is preferentially expressed in young stomatal GCs, is activated by the binding of RABC1GEF1 (a specific guanine nucleotide exchange factor of RABC1) in response to a yet unknown developmental cue, and then targeted to the surface of LDs, where it interacts with SEIPIN2 and SEIPIN3, two ER-localized proteins that serve as the downstream effectors of RABC1 to regulate LD mobilization and lipid availability for the establishment of functional stomata. The dashed arrows indicate the possible involvement of the vacuole during RABC1-controlled LD homeostasis. ER, endoplasmic reticulum. For more details, please refer to the “Discussion” section.

Similar articles

Cited by

References

    1. Andrés Z, Pérez-Hormaeche J, Leidi EO, Schlücking K, Steinhorst L, McLachlan DH, Schumacher K, Hetherington AM, Kudla J, Cubero B (2014) Control of vacuolar dynamics and regulation of stomatal aperture by tonoplast potassium uptake. Proc Natl Acad Sci USA 111: E1806–E1814 - PMC - PubMed
    1. Antonny B, Madden D, Hamamoto S, Orci L, Schekman R (2001) Dynamics of the COPII coat with GTP and stable analogues. Nat Cell Biol 3: 531–537 - PubMed
    1. Bak G, Lee EJ, Lee Y, Kato M, Segami S, Sze H, Maeshima M, Hwang JU, Lee Y (2013) Rapid structural changes and acidification of guard cell vacuoles during stomatal closure require phosphatidylinositol 3,5-bisphosphate. Plant Cell 25: 2202–2216 - PMC - PubMed
    1. Bekbulat F, Schmitt D, Feldmann A, Huesmann H, Eimer S, Juretschke T, Beli P, Behl C, Kern A (2020) RAB18 loss interferes with lipid droplet catabolism and provokes autophagy network adaptations. J Mol Biol 432: 1216–1234 - PubMed
    1. Bem D, Yoshimura S, Nunes-Bastos R, Bond FC, Kurian MA, Rahman F, Handley MT, Hadzhiev Y, Masood I, Straatman-Iwanowska AA, et al. (2011) Loss-of-function mutations in RAB18 cause Warburg micro syndrome. Am J Hum Genet 88: 499–507 - PMC - PubMed

Publication types

Substances