. 2022 Dec 19;145(12):4264-4274.
doi: 10.1093/brain/awac243.

Gene therapy targeting the blood-brain barrier improves neurological symptoms in a model of genetic MCT8 deficiency

Affiliations

Gene therapy targeting the blood-brain barrier improves neurological symptoms in a model of genetic MCT8 deficiency

Sivaraj M Sundaram et al. Brain. .

Abstract

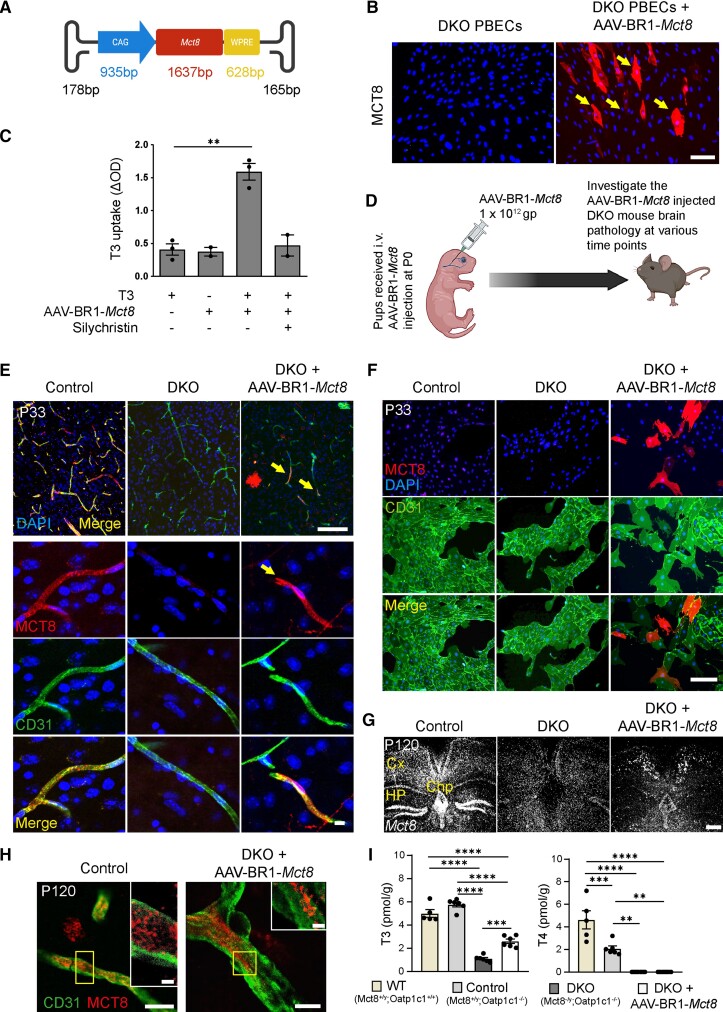
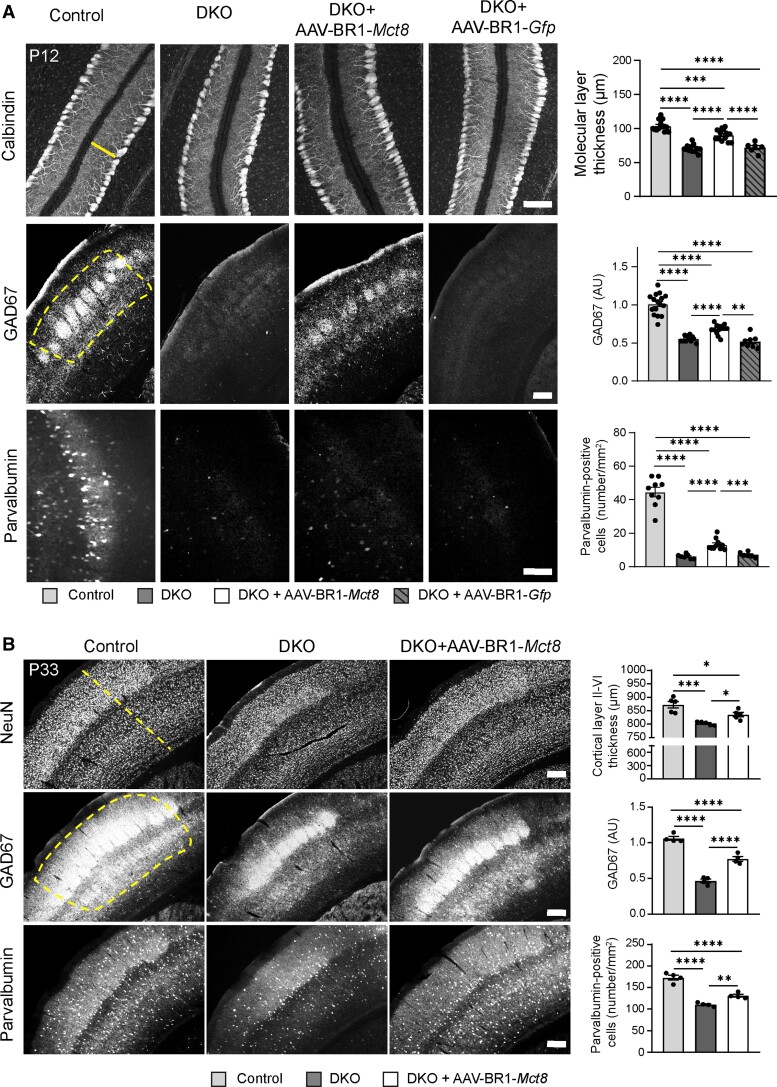
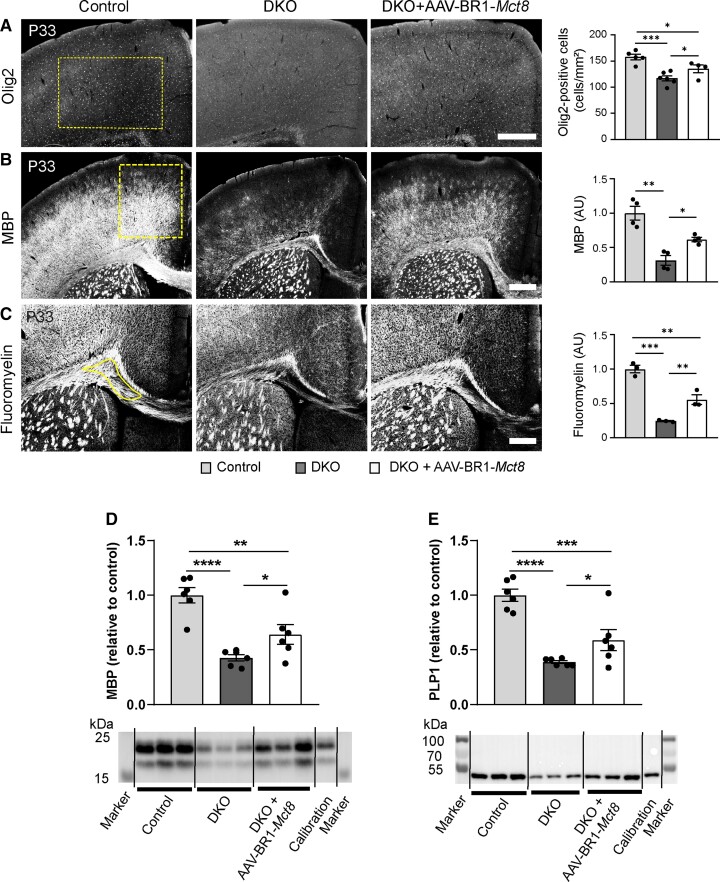
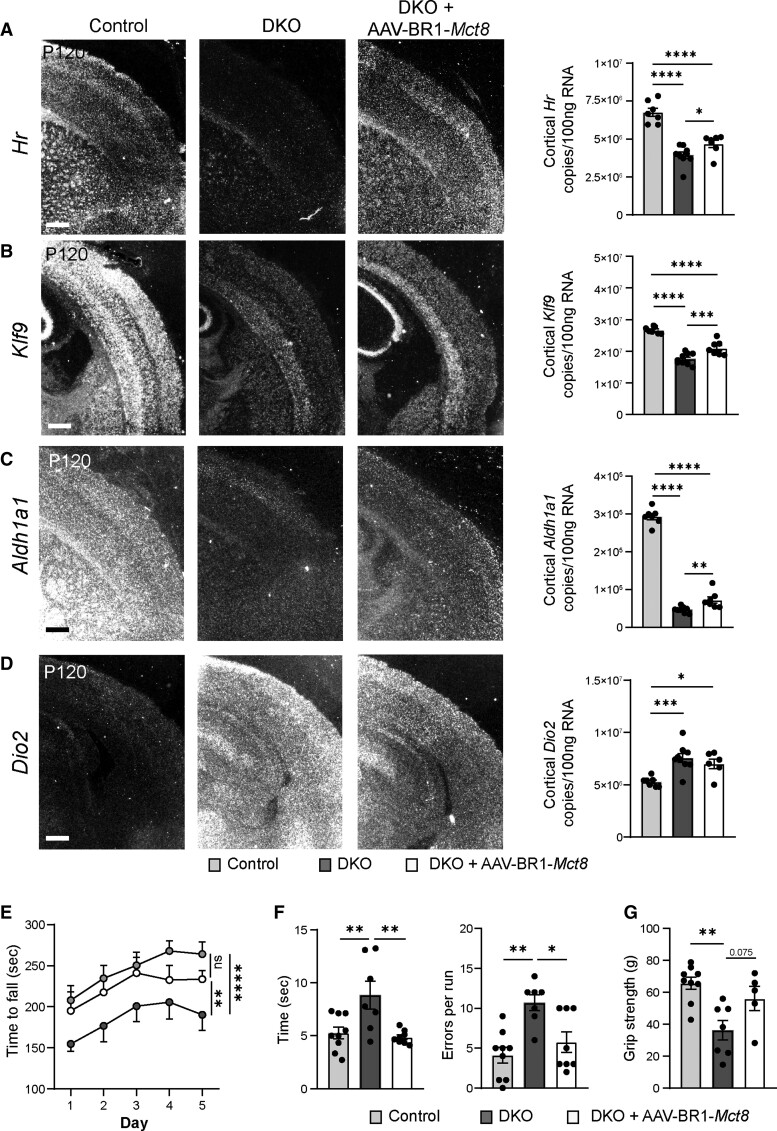
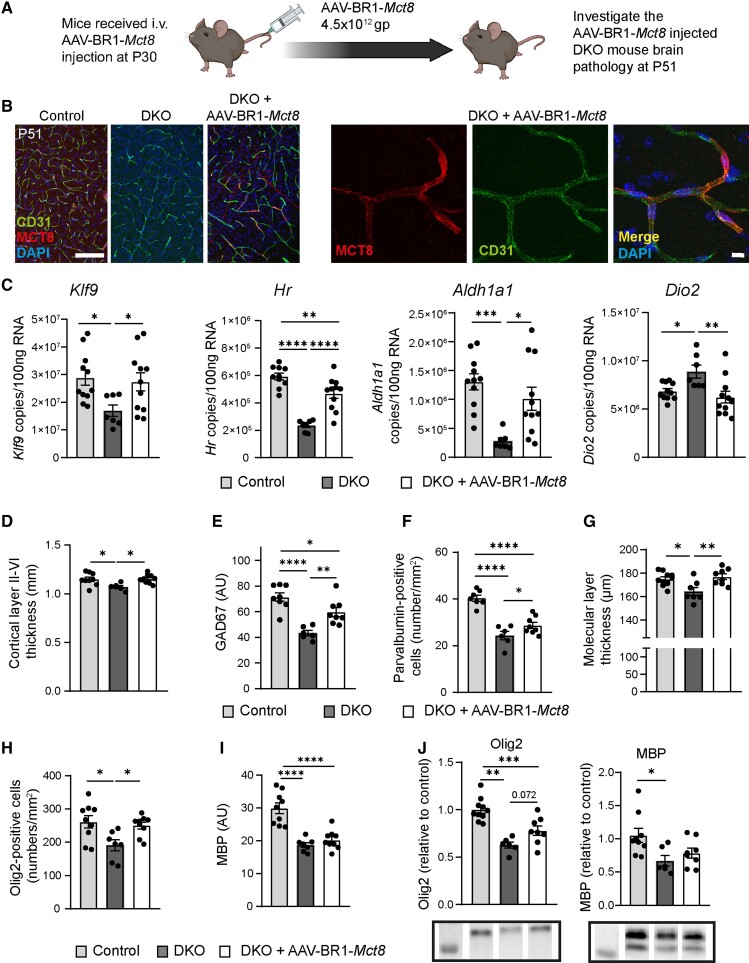
A genetic deficiency of the solute carrier monocarboxylate transporter 8 (MCT8), termed Allan-Herndon-Dudley syndrome, is an important cause of X-linked intellectual and motor disability. MCT8 transports thyroid hormones across cell membranes. While thyroid hormone analogues improve peripheral changes of MCT8 deficiency, no treatment of the neurological symptoms is available so far. Therefore, we tested a gene replacement therapy in Mct8- and Oatp1c1-deficient mice as a well-established model of the disease. Here, we report that targeting brain endothelial cells for Mct8 expression by intravenously injecting the vector AAV-BR1-Mct8 increased tri-iodothyronine (T3) levels in the brain and ameliorated morphological and functional parameters associated with the disease. Importantly, the therapy resulted in a long-lasting improvement in motor coordination. Thus, the data support the concept that MCT8 mediates the transport of thyroid hormones into the brain and indicate that a readily accessible vascular target can help overcome the consequences of the severe disability associated with MCT8 deficiency.

Keywords: cretinism; hypothyroidism; myelination; thyroxine; tri-iodothyronine.


Figures

Figure 1
Figure 1
Intravenous administration of AAV-BR1-Mct8 enables the expression of Mct8 in brain endothelial cells and T3 transport into the CNS. (A) Schematic illustration of AAV-BR1-Mct8 vectors to transduce brain endothelial cells. CAG = cytomegalovirus enhancer fused to the chicken beta-actin promoter; WPRE = woodchuck hepatitis posttranscriptional regulatory element. (B) After transduction of primary brain endothelial cells (PBECs) of DKO mice in vitro with AAV-BR1-Mct8, MCT8 was expressed. MCT8 was detected by fluorescence immunostaining and nuclei with DAPI. Arrows indicate MCT8-positive cells. Scale bar = 100 µm. (C) T3 uptake in DKO PBECs was enhanced by AAV-BR1-Mct8 treatment in vitro. Results were obtained from three independent cell culture preparations. **P = 0.0015 (unpaired t-test). (D) Schematic of the experimental design, created by BioRender.com. gp = genomic particles. (E) MCT8 expression (arrow) in CD31-positive endothelial cells of control or DKO mice that received AAV-BR1-Mct8 at P0. In the top right panel, an MCT8-positive cell with the typical astrocytic morphology is visible. Fluorescence immunostaining for MCT8 and CD31 was performed at P33. Scale bars = 100 µm; 10 µm. (F) MCT8 expression in PBECs prepared from P33 mice that received AAV-BR1-Mct8 at P0 (MCT8-positive cells, 8.6 ± 1.1% of CD31-positive PBECs in four independent cell culture preparations, with one mouse per cell culture preparation). Scale bar = 100 µm. (G and H) At P120, Mct8 mRNA (G) and MCT8 protein (H) were detected in control and DKO mice treated with AAV-BR1-Mct8 at P0. Insets: Higher magnification of the boxed areas. Scale bar = 100 µm (G), 5 µm (H), 2 µm (insets). Cx = cortex; Chp = choroid plexus; Hp = hippocampus. (I) T3 and T4 concentrations in brains of control and DKO mice that received AAV-BR1-Mct8 at P0 and were sacrificed at P21. One-way ANOVA: T3, F(3/19) = 104.7, P < 0.0001; T4, F(3/19) = 34.03, P < 0.0001; Holm–Sidak’s post hoc test. Each dot represents one animal. Means ± SEM are shown. **P < 0.01; ***P < 0.001; ****P < 0.0001.
Figure 2
Figure 2
AAV-BR1-Mct8 treatment improves neuronal morphology and gene expression. (A) Administration of AAV-BR1-Mct8 at P0 to DKO mice increased thickness of the molecular layer in the cerebellar vermis as well as the relative fluorescence intensity of GAD67- and parvalbumin-positive interneurons of the somatosensory cortex at P12. Administration of AAV-BR1-Gfp at P0 to DKO mice had no effect. One-way ANOVA: molecular layer thickness, F(3/40) = 50.25, P < 0.0001; Holm–Sidak’s post hoc test. Welch’s ANOVA: GAD67, W(3/21.43) = 58.74, P < 0.0001; parvalbumin-positive interneurons, W(3/15.37) = 64.72, P < 0.0001; Tamhane's T2 post hoc test. Scale bar = 100 µm (top and bottom panel); Scale bar = 200 µm (middle panel). (B) Administration of AAV-BR1-Mct8 at P0 improved the thickness of the somatosensory cortex layers II–VI, the relative fluorescence signal intensity of GAD67 and the number of parvalbumin-positive interneurons in the cortex at P33. One-way ANOVA: cortical thickness, F(2/12) = 16.4, P = 0.0004; GAD67, F(2/9) = 102.0, P < 0.0001; parvalbumin-positive interneurons, F(2/9) = 63.01, P < 0.0001; Holm–Sidak’s post hoc test. Scale bar = 200 µm. Each dot represents one animal. Means ± SEM are shown. Dashed line indicates region of interest. *P < 0.05; **P < 0.01; ***P < 0.001; ****P < 0.0001.
Figure 3
Figure 3
AAV-BR1-Mct8 treatment increases oligodendrocyte numbers and myelination. Treatment of DKO mice at P0 improved several parameters of myelination at P33 and P21. (A) The reduced number of Olig2-immunopositive oligodendrocytes in the cerebral cortex was significantly increased in DKO treated with AAV-BR1-Mct8 at P33. Scale bar = 200 µm. One-way ANOVA, F(2/12) = 13.94, P = 0.0007; Holm–Sidak’s post hoc test. (B) AAV-BR1-Mct8 improved MBP levels in the cortex of DKO mice at P33. MBP was detected by immunostaining. Scale bar = 100 µm. Welch’s ANOVA test, W(2/4.96) = 14.8, P = 0.0081; Tamhane’s T2 post hoc test. (C) Compact myelin stained by FluoroMyelin was diminished in the corpus callosum of untreated DKO but improved by treatment with AAV-BR1-Mct8 at P33. Scale bar = 100 µm. One-way ANOVA, F(2/6) = 53.15, P = 0.0002; Holm–Sidak’s post hoc test. (D and E) AAV-BR1-Mct8 treatment at P0 increased the levels of MBP (D) and PLP1 (E) in brain lysate of DKO mice at P21 as determined by immunoblotting. One-way ANOVA: MBP, F(2/15) = 18.09, P = 0.0001; PLP1, F(2/15) = 23.05, P < 0.0001; Holm–Sidak’s post hoc test. Cropped blots are shown; for full-length blots, see Supplementary Fig. 8. Each dot represents one animal. Means ± SEM are shown. Dashed line indicates region of interest. *P < 0.05; **P < 0.01; ***P < 0.001; ****P < 0.0001.
Figure 4
Figure 4
AAV-BR1-Mct8 treatment improves expression of TH-dependent genes and motor function in DKO mice. (A and B) AAV-BR1-Mct8 injected at P0 increased the expression of neuronal Hr and Klf9 in the cortex of DKO mice at P120. Gene expression was visualized by in situ hybridization and quantified by qPCR. In situ hybridization images are representative for several replicates (Supplementary Table 1). Scale bar = 100 µm. One-way ANOVA: Hr, F(2/20) = 36.92, P < 0.0001; Klf9, F(2/20) = 52.79, P < 0.0001; Holm–Sidak’s post hoc test. (C and D) AAV-BR1-Mct8 injected at P0 increased the expression of astrocytic Aldh1a1 (C) in the cortex of DKO mice at P120. The elevated cortical Dio2 expression (D) in DKO mice was not reduced by AAV-BR1-Mct8. Scale bar = 100 µm. One-way ANOVA: Aldh1a1, F(2/20) = 440.4, P < 0.0001; Dio2, F(2/19) = 10.01, P = 0.0011; Holm–Sidak’s post hoc test. (E) AAV-BR1-Mct8 treatment at P0 prolonged the time DKO mice were able to balance on the rotarod as a sign of improved coordination and motor learning. Mice were assessed on five consecutive days starting at P120. Repeated-measures ANOVA, F(2/26) = 5.045, P = 0.0141; Holm–Sidak’s post hoc test. (F) AAV-BR1-Mct8 treatment reduced the time DKO mice needed to cross the beam and led to a trend towards fewer errors, indicating better motor coordination. One-way ANOVA: time, F(2/21) = 7.567, P = 0.0034; errors, F(2/21) = 9.274, P = 0.0013; Holm–Sidak’s post hoc test. (G) AAV-BR1-Mct8 treatment tended to increase the grip strength of DKO mice in comparison to control animals. One-way ANOVA, F(2/18) = 8.301, P = 0.0028; Holm–Sidak’s post hoc test. Each dot represents one animal. Means ± SEM are shown. ns = non-significant; *P < 0.05; **P < 0.01; ***P < 0.001; ****P < 0.0001.
Figure 5
Figure 5
Intravenous administration of AAV-BR1-Mct8 in juvenile mice enables the expression of Mct8 in brain endothelial cells and improves T3-dependent parameters. (A) Schematic of the experimental design, created by BioRender.com. gp = genomic particles. (B) MCT8 expression in CD31-positive endothelial cells of control or DKO mice that received AAV-BR1-Mct8 at P30. Fluorescence immunostaining for MCT8 and CD31 was performed at P51. Scale bar = 100 µm (left), 10 µm (right). (C) AAV-BR1-Mct8 injected at P30 increased the expression of Klf9, Hr and Aldh1a1 and reduced expression of Dio2 in DKO mice at P51. Gene expression was quantified by qPCR. One-way ANOVA: Klf9, F(2/26) = 4.031, P = 0.0299; Hr, F(2/25) = 32.80, P < 0.0001; Aldh1a1, F(2/26) = 8.9, P = 0.0011); Dio2, F(2/26) = 6.076, P = 0.0068; Holm–Sidak’s post hoc test. (DG) Administration of AAV-BR1-Mct8 at P30 improved the thickness of the somatosensory cortex layers II–VI (D), the relative fluorescence signal intensity of GAD67 (E), the number of parvalbumin-positive interneurons (F) and the thickness of the molecular layer in the cerebellar vermis (G) at P51. One-way ANOVA for cortical thickness, F(2/22) = 5.723, P = 0.0099; GAD67, F(2/19) = 17.75, P < 0.0001; parvalbumin, F(2/18) = 31.46, P < 0.0001; molecular layer thickness, F(2/22) = 6.723, P = 0.0053; Holm–Sidak’s post hoc test. (H) The reduced number of Olig2-immunopositive oligodendrocytes in the corpus callosum was significantly increased in DKO treated with AAV-BR1-Mct8. One-way ANOVA, F(2/22) = 12.74, P = 0.0002; Holm–Sidak’s post hoc test. (I) AAV-BR1-Mct8 did not improve MBP levels of DKO mice. MBP was detected by immunostaining. One-way ANOVA, F(2/22) = 23.95, P < 0.0001; Holm–Sidak’s post hoc test. (J) Protein levels of Olig2 and MBP quantified by immunoblot were not improved compare with DKO mice. One-way ANOVA: Olig2, F(2/21) = 19.31, P < 0.0001; MBP, F(2/20) = 4.523, P = 0.024; Holm–Sidak’s post hoc test. Each dot represents one animal. Means ± SEM are shown. Cropped blots are shown; for the full-length blots, see Supplementary Fig. 9. *P < 0.05; **P < 0.01; ***P < 0.001; ****P < 0.0001.

Similar articles

Cited by

References

    1. Wood-Allum CA, Shaw PJ. Thyroid disease and the nervous system. Handb Clin Neurol. 2014;120:703–735. - PubMed
    1. Halpern JP, Boyages SC, Maberly GF, Collins JK, Eastman CJ, Morris JG. The neurology of endemic cretinism. A study of two endemias. Brain. 1991;114(Pt 2):825–841. - PubMed
    1. Dwyer JB, Aftab A, Radhakrishnan R, et al. . Hormonal treatments for major depressive disorder: State of the art. Am J Psychiatry. 2020;177:686–705. - PMC - PubMed
    1. Tan ZS, Vasan RS. Thyroid function and Alzheimer’s disease. J Alzheimers Dis. 2009;16:503–507. - PubMed
    1. Bernal J, Guadano-Ferraz A, Morte B. Thyroid hormone transporters—Functions and clinical implications. Review. Nat Rev Endocrinol. 2015;11:406–417. - PubMed

Publication types

Supplementary concepts