. 2022 Oct 27;34(11):4213-4231.
doi: 10.1093/plcell/koac236.

TANDEM ZINC-FINGER/PLUS3 regulates phytochrome B abundance and signaling to fine-tune hypocotyl growth

Affiliations

TANDEM ZINC-FINGER/PLUS3 regulates phytochrome B abundance and signaling to fine-tune hypocotyl growth

Weiwei Fang et al. Plant Cell. .

Abstract

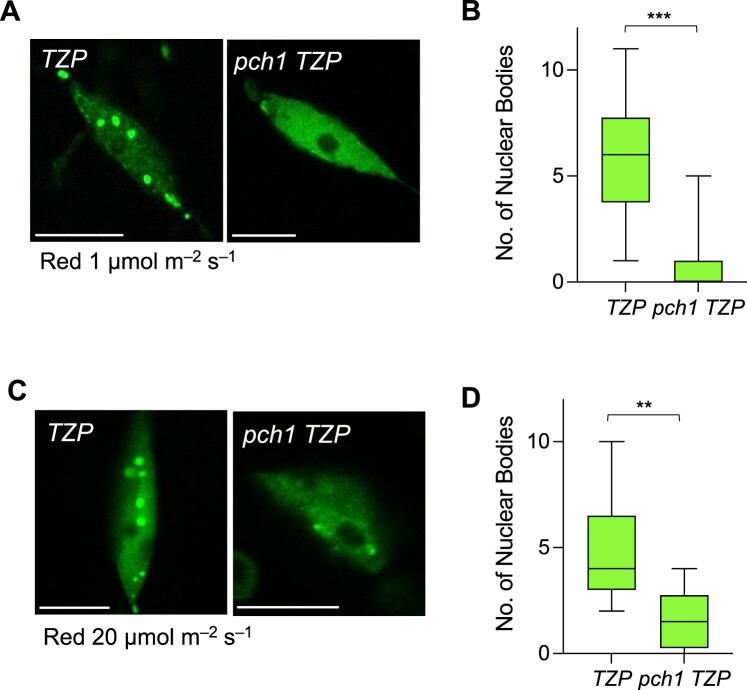
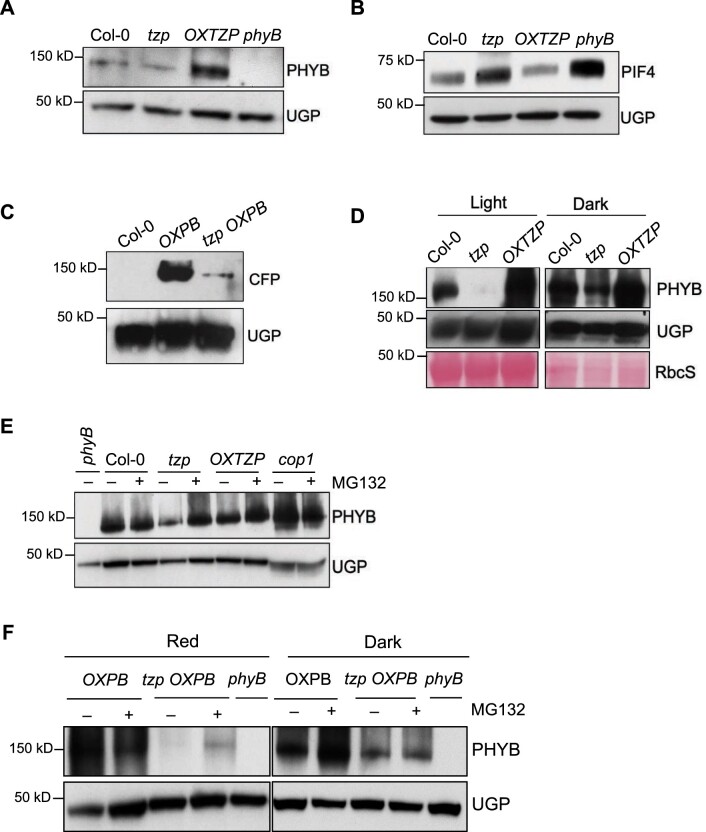
TANDEM ZINC-FINGER/PLUS3 (TZP) is a transcriptional regulator that acts at the crossroads of light and photoperiodic signaling. Here, we unveil a role for TZP in fine-tuning hypocotyl elongation under red light and long-day conditions. We provide genetic evidence for a synergistic action between TZP and PHOTOPERIODIC CONTROL OF HYPOCOTYL 1 (PCH1) in regulating the protein abundance of PHYTOCHROME INTERACTING FACTOR 4 (PIF4) and downstream gene expression in response to red light and long days (LDs). Furthermore, we show that TZP is a positive regulator of the red/far-red light receptor and thermosensor phytochrome B (phyB) by promoting phyB protein abundance, nuclear body formation, and signaling. Our data therefore assign a function to TZP in regulating two key red light signaling components, phyB and PIF4, but also uncover a new role for PCH1 in regulating hypocotyl elongation in LDs. Our findings provide a framework for the understanding of the mechanisms associated with the TZP signal integration network and their importance for optimizing plant growth and adaptation to a changing environment.


Figures

Figure 1
Figure 1
The loss of TZP function enhances the elongated hypocotyl phenotype of pch1 in LDs, SDs, and red light. A–C, Hypocotyl measurements of mutant combinations of tzp with pch1 and control lines. Seedlings were grown for 5 days in white light (60 µmol m−2 s−1) under a LD (16-h light/8-h dark) (A) or SD (8-h light/16-h dark) (B) photoperiod. C, Seedlings were grown for 5 days in red light (1 µmol m−2 s−1). Hypocotyl length was measured from digital images using ImageJ. In whisker plots, boxes show median, IQR, and maximum–minimum interval of each data set (n = 15 seedlings). The IQR was calculated based on the formula: quartile3 (Q3) – quartile1 (QI). Whiskers represent QI – 1.5 × IQR and Q3 + 1.5 × IQR. Different lowercase letters represent significant differences by one-way ANOVA with Tukey’s post hoc test between assessed samples (P < 0.05). Data shown are representative of three biological replicates with independent populations of plants. D and E, RT-qPCR analysis of ATHB2 and HFRI mRNA levels normalized to the housekeeping gene ISU1 in the indicated genotypes. Tissue was harvested on the fourth day (ZT = 8 for LD, ZT = 0 for SD), tzp pch1 A, D, indicate two independent double mutant lines. Data are means ± se of three biological replicates with independent pools of tissue. Different lowercase letters represent significant differences by one-way ANOVA with Tukey’s post hoc test (P < 0.05).
Figure 2
Figure 2
Overexpression of TZP counteracts the pch1 phenotype in SDs and red light. A and B, Hypocotyl measurements of Col-0, OXTZP, pch1, pch1 OXTZP lines (2–7, 2–8, 1–12), the pch1 TZP (2–11 3) transgenic line, and phyB-9. Seedlings were grown for 5 days in white light (60 µmol m−2 s−1) SD conditions (8-h light/16-h dark) (A) or constant red light (1 µmol m−2 s−1) (B). Data shown are representative of three biological replicates with independent populations of seedlings. Hypocotyl length was measured from digital images using ImageJ. In whisker plots, boxes show median, IQR, and maximum–minimum interval of each data set (n = 15 seedlings). Different lowercase letters represent significant differences by one-way ANOVA with Tukey’s post hoc test among assessed samples (P < 0.05).
Figure 3
Figure 3
PIF4 protein levels increase in tzp pch1. A, Immunoblot analysis of phyB protein levels from seedlings grown in continuous red light (1 µmol m−2 s−1) for 4 days. An anti-phyB antibody was used to detect phyB protein and anti-UGP to monitor UGP as loading control. The phyB-9 mutant was used as a negative control. B, Quantification of the relative band intensities (phyB/UGP) of the immunoblot shown in (A), as performed in ImageJ. Data are means ± sd from three biological replicates with independent pools of tissue. C and D, Immunoblot analysis of PIF4 protein levels from seedlings grown in LD conditions (white light 60 µmol m−2 s−1) (C), or continuous red light (1 µmol m−2 s−1) (D) for 4 days. Protein was isolated at ZT8 (8 h after lights on) in LD. PIF4 protein levels were detected by an anti-PlF4-specific antibody. UGP was used as loading control. A pif4 mutant was used as a negative control. Data shown are representative of three biological replicates with independent pools of tissue. Quantification of relative band intensities of (C and D) can be found in Supplemental Figure S3, B and C. E, Time course analysis of PIF4 protein levels from seedlings grown in a LD photoperiod (white light 60 µmol m−2 s−1) for 10 days. Tissue was harvested every 4 h from ZT0, with an extra time point at ZT2. Tissue collection at ZT0 and ZT24 was conducted in darkness. PIF4 protein levels were determined with an anti-PlF4-specific antibody. Ponceau S staining of the housekeeping protein RbcS (small subunit of rubisco) was used as loading control. F, Time course analysis of PIF4 transcript levels from seedlings grown in identical conditions as in (E). PIF4 transcript levels were normalized to the housekeeping gene ISU1. Data shown are representative of three biological replicates with independent pools of tissue.
Figure 4
Figure 4
TZP nuclear body formation is impaired in pch1. A and C, Confocal image analysis of nuclear body (NB) abundance of GFP-tagged TZP (OXTZP) and a pch1 TZP (lines 1–12) crossing line. Representative images of the outermost epidermal cells of the upper third hypocotyl part of 4-day-old etiolated seedlings exposed to red light (A) 1 µmol m−2 s−1 or (C) 20 µmol m−2 s−1 for 24 h are shown. Scale bars, 10 µm. B and D, Quantification analysis of the number of NBs per nucleus from confocal images of TZP and pch1 TZP in response to the conditions described in (A) and (C), respectively. Confocal images were analyzed in ImageJ and graphs were plotted in GraphPad Prism. In whisker plots, boxes show median, IQR, and maximum–minimum interval of each data set. A minimum of 12 nuclei per condition and per biological replicate were examined. Asterisks (**) represent P < 0.01 by one-way ANOVA and indicate a significant difference compared with TZP. Data shown are representative of three biological replicates with independent populations of seedlings.
Figure 5
Figure 5
TZP regulates phyB-mediated hypocotyl elongation and gene expression in red light. A and B, Hypocotyl measurements and phenotypes of mutant combinations between tzp and phyB-9 or phyBOX (OXPB) and the corresponding parental lines. Surface-sterilized and stratified seeds were grown for 5 days in red light (1 µmol m−2 s−1); seedlings were scanned at the end of the fifth day. Hypocotyl length was measured from digital images using ImageJ. Graph of hypocotyl measurements (A) and representative image (B) of Col-0, tzp, OXTZP, phyB-9, OXPB, tzp phyB 2-3, tzp phyB 6-1, tzp OXPB 1-8, and tzp OXPB 1-4 seedlings grown in the indicated conditions (scale bar, 5 mm) are shown. In whisker plots, boxes show median, IQR, and maximum–minimum interval of each data set (n = 15 seedlings). Data shown are representative of three biological replicates with independent populations of seedlings. Different lowercase letters represent significant differences by one-way ANOVA with Duncan’s post hoc test between assessed samples (P < 0.05). C, RT-qPCR analysis of ATHB2, HFR1 transcript levels, normalized to the housekeeping gene ISU1 in the indicated genotypes. Surface-sterilized and stratified seeds were first exposed to white light (60 µmol m−2 s−1) for 5 h before being exposed to 5 µmol m−2 s−1 red light; tissue was collected on the fifth day after red light exposure. Data are means ± se of three biological replicates with independent pools of tissue. Different lowercase letters represent significant differences by one-way ANOVA with Tukey’s post hoc test (P < 0.05).
Figure 6
Figure 6
TZP stabilizes phyB protein. A, Immunoblot analysis of phyB protein levels from seedlings grown in constant red light (1 µmol m−2 s−1) for 4 days by using an anti-phyB-specific antibody. UGP was used as a loading control. B, Immunoblot analysis of PIF4 protein levels of seedlings grown under the same conditions as in (A). PIF4 protein levels were determined with an anti-PlF4-specific antibody; UGP was used as loading control. Quantification of relative band intensities (A–B) can be found in Supplemental Figure S6, A and B. C, Immunoblot analysis of CFP-tagged phyB protein in OXPB and tzp OXPB grown under the same conditions as in (A). An anti-GFP antibody was used to detect CFP-tagged phyB in OXPB and tzp OXPB. UGP was used as loading control and Col-0 was used as a negative control. D, Immunoblot analysis of phyB protein levels in 4-day-old seedlings grown in constant white light (60 µmol m−2 s−1) or kept in darkness. An anti-phyB-specific antibody was used to detect phyB protein. UGP and a Ponceau S stain of RbcS were used as loading controls. Quantification of the relative band intensities can be found in Supplemental Figure S6E. E, Immunoblot analysis of phyB protein levels in 4-day-old etiolated seedlings infiltrated with 50 µM of the proteasomal inhibitor MG132 or an equal volume of DMSO in liquid half-strength MS medium for 2 h in the dark prior to a 2-h red light (25 µmol m−2 s−1) exposure. Quantification of the relative band intensities can be found in Supplemental Figure S6F. F, Four-day-old etiolated seedlings were infiltrated with 50 µM of the proteasomal inhibitor MG132 or DMSO in liquid half-strength MS medium for 2 h in the dark prior to a 2-h red light (25 µmol m−2 s−1) exposure or kept in darkness. Quantification of the relative band intensities (F) can be found in Supplemental Figure S6G. PhyB protein levels were determined with an anti-phyB-specific antibody. UGP was used as loading control. The phyB-9 mutant was used as negative control. Data shown are representative of three biological replicates with independent pools of tissue.
Figure 7
Figure 7
TZP regulates phyB nuclear body formation. A and C, Confocal image analysis of nuclear body (NB) abundance of CFP-tagged phyB (OXPB) and tzp OXPB. Representative images of the outermost epidermal cells of the upper third hypocotyl part of 4-day-old etiolated seedlings exposed to 1 µmol m−2 s−1 (A) or 20 µmol m−2 s−1 (C) red light for 24 h are shown. Scale bars, 10 µm. B and D, Quantification analysis of the number of NBs per nucleus from confocal images of OXPB and tzp OXPB in response to the conditions described in (A) and (C), respectively. Confocal images were analyzed in ImageJ and graphs were plotted in GraphPad Prism. In whisker plots, boxes show median, IQR, and maximum/minimum interval of each data set. A minimum of 12 nuclei per condition and per biological replicate were examined. Asterisks (***) represent P < 0.001 by one-way ANOVA and indicate a significant difference compared with OXPB. Data shown are representative of three biological replicates with independent populations of seedlings.
Figure 8
Figure 8
TZP regulates the nuclear body morphology and abundance of the constitutively active phyBY276H. A and D, PhyBY276H (YHB) nuclear body (NB) abundance and morphology were monitored by confocal microscopy. Representative images of the outermost epidermal cells of the upper third hypocotyl part of 4-day-old seedlings grown in the dark (A) or in red light (20 µmol m−2 s−1) (D) in YHB and tzp YHB are shown. Scale bars, 10 µm. Quantification of the NB number per nucleus (B, E) and NB area (C, F) from confocal images of YHB and tzp YHB in response to the conditions described in (A) and (D), respectively. Confocal images were analyzed in ImageJ and graphs were plotted in GraphPad Prism. In whisker plots, boxes show median, IQR, and maximum–minimum interval of each data set. A minimum of 12 nuclei and per biological repeat were examined. Asterisks (***) represent P < 0.001 by one-way ANOVA and indicate significant difference compared with YHB. Data shown are representative of three biological replicates with independent populations of seedlings.
Figure 9
Figure 9
PIF4 acts downstream of TZP in red light signaling. Hypocotyl measurements of mutant combinations between tzp and pif4, pif4 pif5 and controls. Seedlings were grown for 5 days in red light (1 µmol m−2 s−1). Hypocotyl lengths (A) and graphs of representative images (B) of Col-0, tzp, pif4, tzp pif4 1.29.4, tzp pif4 1.20.5, pif4 pif5, tzp pif4 pif5 2.2.3, tzp pif4 pif5 1.20.4, phyB seedlings grown in the indicated conditions. tzp pif4 1.29.4, tzp pif4 1.20.5 are two independent tzp pif4 double mutant lines; tzp pif4 pif5 2.2.3, tzp pif4 pif5 1.20.4 are two independent tzp pif4 pif5 triple mutant lines. Scale bar, 3 mm. Seedlings were scanned at the end of the fifth day. Hypocotyl length was measured from digital images using ImageJ. In whisker plots, boxes show median, IQR, and maximum–minimum interval of each data set (n = 15 seedlings). Data shown are representative of three biological replicates with independent populations of seedlings. Different lowercase letters represent significant differences by one-way ANOVA with Tukey’s post hoc test among assessed samples (P < 0.05).

Similar articles

Cited by

References

    1. Casal JJ, Questa JI (. 2018) Light and temperature cues: multitasking receptors and transcriptional integrators. New Phytol 217: 1029–1034 - PubMed
    1. Chen M, Chory J (. 2011) Phytochrome signaling mechanisms and the control of plant development. Trends Cell Biol 21: 664–671 - PMC - PubMed
    1. Chen M, Galvao RM, Li M, Burger B, Bugea J, Bolado J, Chory J (. 2010) Arabidopsis HEMERA/pTAC12 initiates photomorphogenesis by phytochromes. Cell 141: 1230–1240 - PMC - PubMed
    1. Chen M, Schwab R, Chory J (. 2003) Characterization of the requirements for localization of phytochrome B to nuclear bodies. Proc Natl Acad Sci USA 100: 14493–14498 - PMC - PubMed
    1. Chen M, Tao Y, Lim J, Shaw A, Chory J (. 2005) Regulation of phytochrome B nuclear localization through light-dependent unmasking of nuclear-localization signals. Curr Biol 15: 637–642 - PubMed

Publication types

MeSH terms