

Plasma biomarkers for systemic inflammation in COVID-19 survivors
- PMID: 35929818
- PMCID: PMC9539278
- DOI: 10.1002/prca.202200031
Plasma biomarkers for systemic inflammation in COVID-19 survivors
Abstract
Background: While the majority of COVID-19 patients fully recover from the infection and become asymptomatic, a significant proportion of COVID-19 survivors experience a broad spectrum of symptoms lasting weeks to months post-infection, a phenomenon termed "post-acute sequelae of COVID-19 (PASC)." The aim of this study is to determine whether inflammatory proteins are dysregulated and can serve as potential biomarkers for systemic inflammation in COVID-19 survivors.
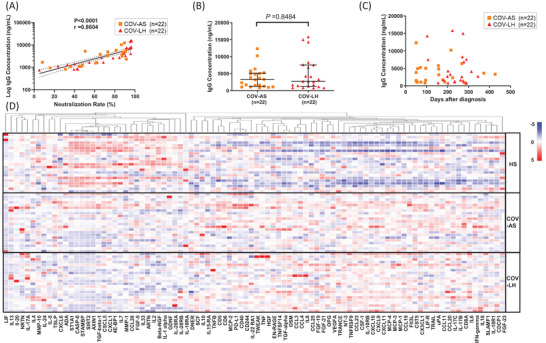
Methods: We determined the levels of inflammatory proteins in plasma from 22 coronavirus disease 2019 (COVID-19) long haulers (COV-LH), 22 COVID-19 asymptomatic survivors (COV-AS), and 22 healthy subjects (HS) using an Olink proteomics assay and assessed the results by a beads-based multiplex immunoassay.
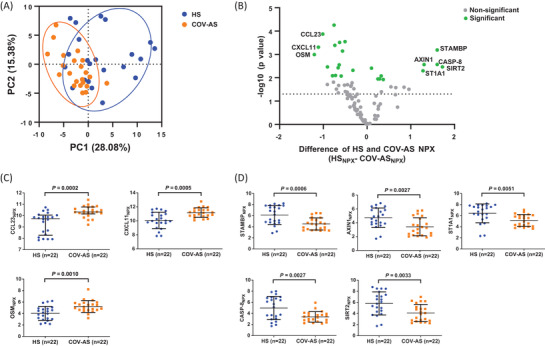
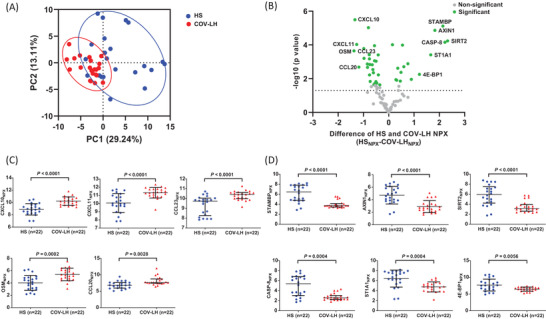
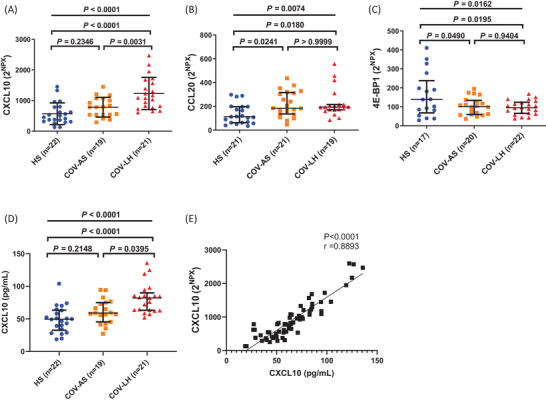
Results: Compared to HS, we found that COVID-19 survivors still exhibited systemic inflammation, as evidenced by significant changes in the levels of multiple inflammatory proteins in plasma from both COV-LH and COV-AS. CXCL10 was the only protein that significantly upregulated in COV-LH compared with COV-AS and HS.
Conclusions: Our results indicate that several inflammatory proteins remain aberrantly dysregulated in COVID-19 survivors and CXCL10 might serve as a potential biomarker to typify COV-LH. Further characterization of these signature inflammatory molecules might improve the understanding of the long-term impacts of COVID-19 and provide new targets for the diagnosis and treatment of COVID-19 survivors with PASC.
Keywords: COVID-19; SARS-CoV-2; biomarkers; inflammation; long haulers.
© 2022 Wiley-VCH GmbH.
Conflict of interest statement
The authors have no conflicts of interest to declare.
Figures
Similar articles
-
Plasma Biomarkers of Neuropathogenesis in Hospitalized Patients With COVID-19 and Those With Postacute Sequelae of SARS-CoV-2 Infection.Neurol Neuroimmunol Neuroinflamm. 2022 Mar 7;9(3):e1151. doi: 10.1212/NXI.0000000000001151. Print 2022 May. Neurol Neuroimmunol Neuroinflamm. 2022. PMID: 35256481 Free PMC article.
-
Neurological post-acute sequelae of SARS-CoV-2 infection.Psychiatry Clin Neurosci. 2023 Feb;77(2):72-83. doi: 10.1111/pcn.13481. Epub 2022 Oct 17. Psychiatry Clin Neurosci. 2023. PMID: 36148558 Free PMC article. Review.
-
Post-acute sequelae of SARS-CoV-2 infection: Caring for the 'long-haulers'.Cleve Clin J Med. 2021 May 3;88(5):267-272. doi: 10.3949/ccjm.88a.21010. Cleve Clin J Med. 2021. PMID: 33941600
-
Persistence of SARS CoV-2 S1 Protein in CD16+ Monocytes in Post-Acute Sequelae of COVID-19 (PASC) up to 15 Months Post-Infection.Front Immunol. 2022 Jan 10;12:746021. doi: 10.3389/fimmu.2021.746021. eCollection 2021. Front Immunol. 2022. PMID: 35082777 Free PMC article.
-
Postacute Sequelae of COVID-19 Critical Illness.Crit Care Clin. 2022 Jul;38(3):455-472. doi: 10.1016/j.ccc.2022.01.001. Epub 2022 Jan 10. Crit Care Clin. 2022. PMID: 35667737 Free PMC article. Review.
Cited by
-
Proteomic profiling identifies biomarkers of COVID-19 severity.Heliyon. 2023 Dec 9;10(1):e23320. doi: 10.1016/j.heliyon.2023.e23320. eCollection 2024 Jan 15. Heliyon. 2023. PMID: 38163173 Free PMC article.
-
Plasma proteome of Long-COVID patients indicates HIF-mediated vasculo-proliferative disease with impact on brain and heart function.J Transl Med. 2023 Jun 10;21(1):377. doi: 10.1186/s12967-023-04149-9. J Transl Med. 2023. PMID: 37301958 Free PMC article.
-
Plasma proteome responses in zebrafish following λ-carrageenan-Induced inflammation are mediated by PMN leukocytes and correlate highly with their human counterparts.Front Immunol. 2022 Sep 29;13:1019201. doi: 10.3389/fimmu.2022.1019201. eCollection 2022. Front Immunol. 2022. PMID: 36248846 Free PMC article.
-
Long COVID and Biomarker Dysregulation-A Shift Toward Immune Exhaustion?Medicina (Kaunas). 2025 May 28;61(6):996. doi: 10.3390/medicina61060996. Medicina (Kaunas). 2025. PMID: 40572685 Free PMC article.
-
Demonstration of the impact of COVID-19 on metabolic associated fatty liver disease by bioinformatics and system biology approach.Medicine (Baltimore). 2023 Sep 1;102(35):e34570. doi: 10.1097/MD.0000000000034570. Medicine (Baltimore). 2023. PMID: 37657050 Free PMC article.
References
-
- World Health Organization . (2022). Coronavirus disease (COVID‐2019) situation reports. Retrieved June 8, 2022, from https://www.who.int/emergencies/diseases/novel‐coronavirus‐2019/situatio...
-
- Taquet, M. , Dercon, Q. , Luciano, S. , Geddes, J. R. , Husain, M. , & Harrison, P. J. (2021). Incidence, co‐occurrence, and evolution of long‐COVID features: A 6‐month retrospective cohort study of 273,618 survivors of COVID‐19. PLoS Medicine, 18(9), e1003773. 10.1371/journal.pmed.1003773 - DOI - PMC - PubMed
Publication types
MeSH terms
Substances
Grants and funding
LinkOut - more resources
Full Text Sources
Medical
Research Materials
Miscellaneous
