. 2022 Sep 5;221(9):e202112097.
doi: 10.1083/jcb.202112097. Epub 2022 Aug 5.

Pericentrin interacts with Kinesin-1 to drive centriole motility

Affiliations

Pericentrin interacts with Kinesin-1 to drive centriole motility

Matthew R Hannaford et al. J Cell Biol. .

Abstract

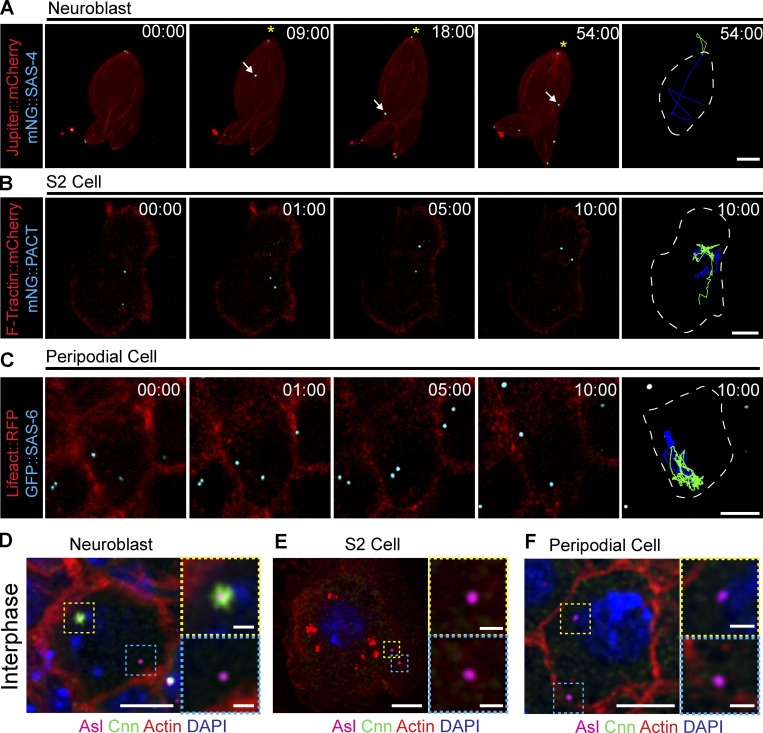
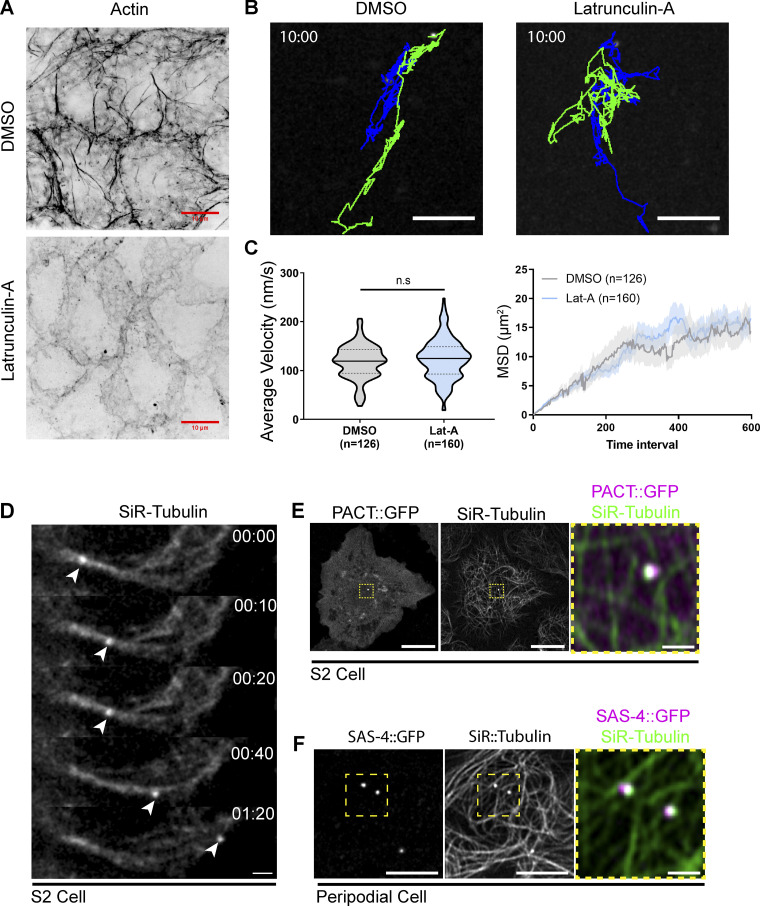
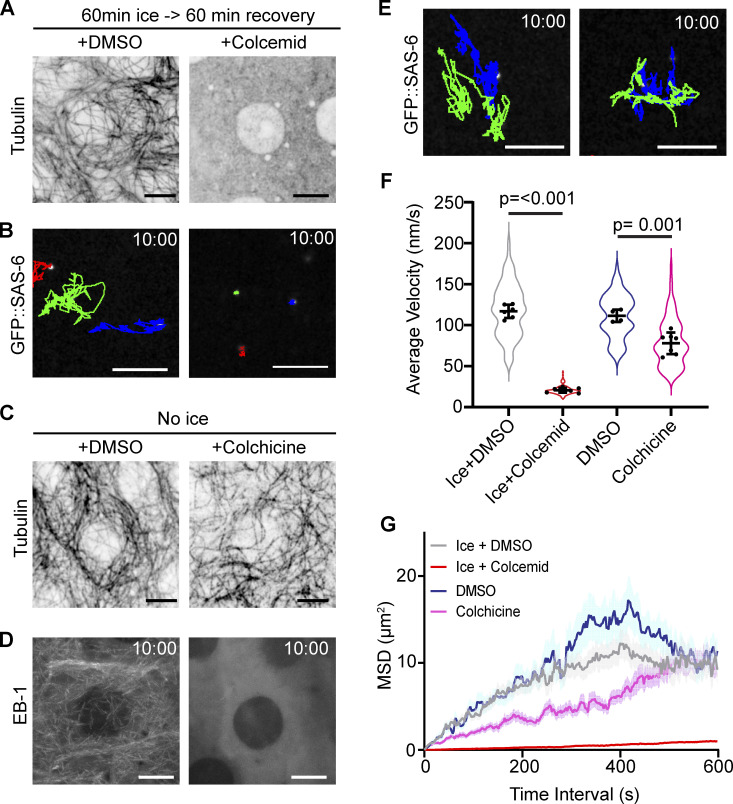
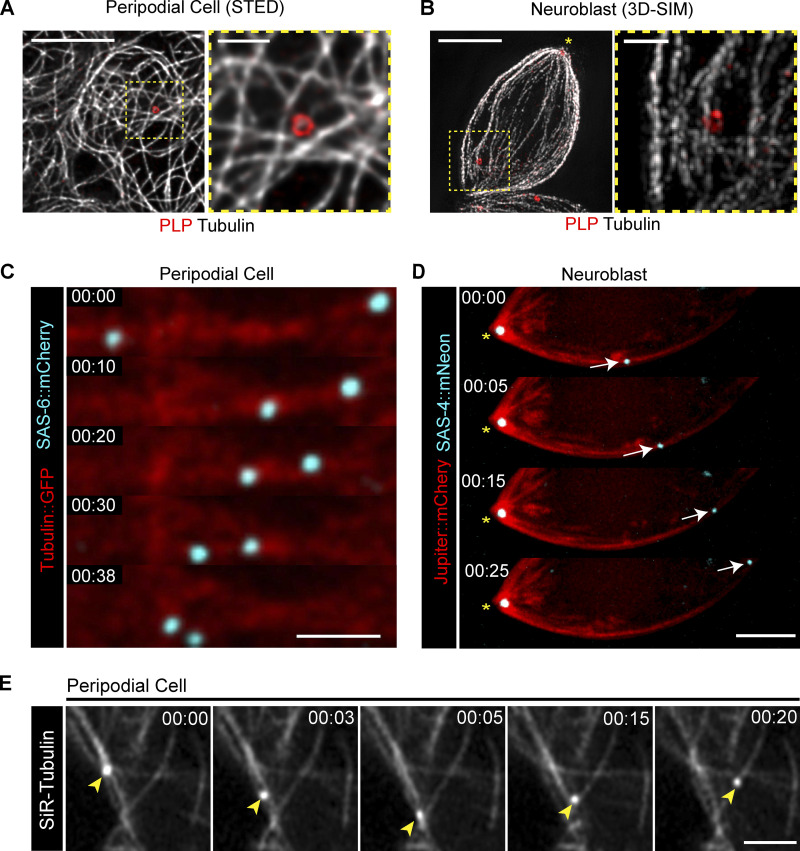
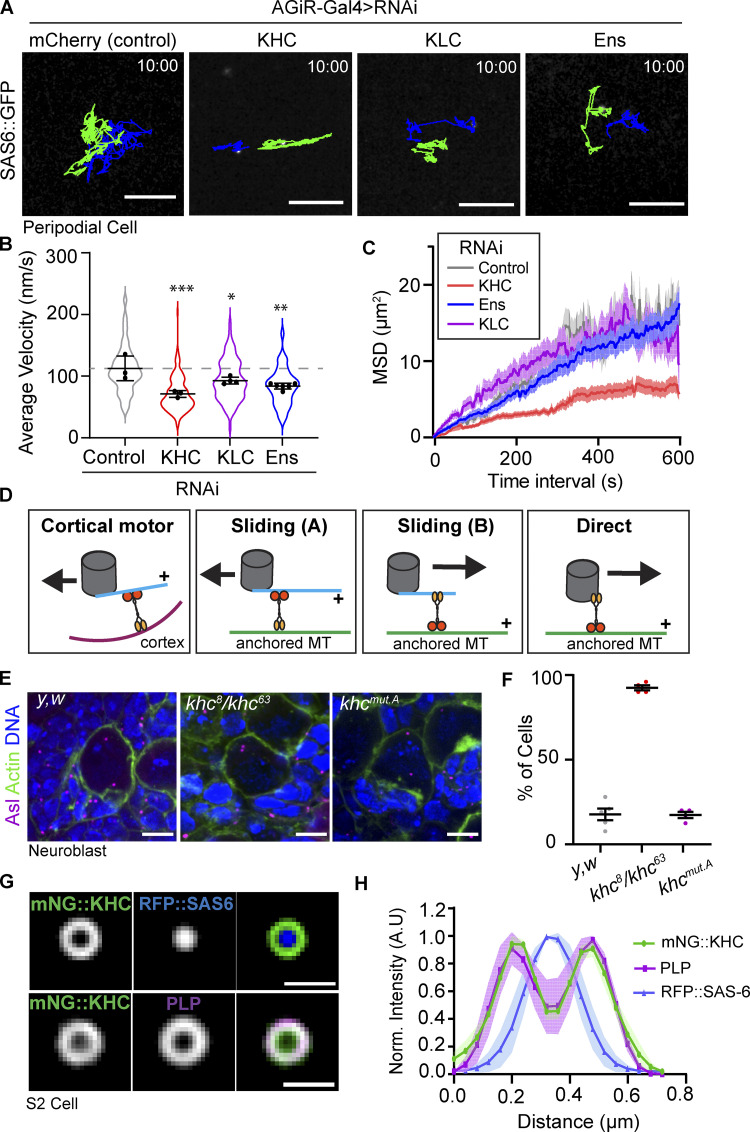
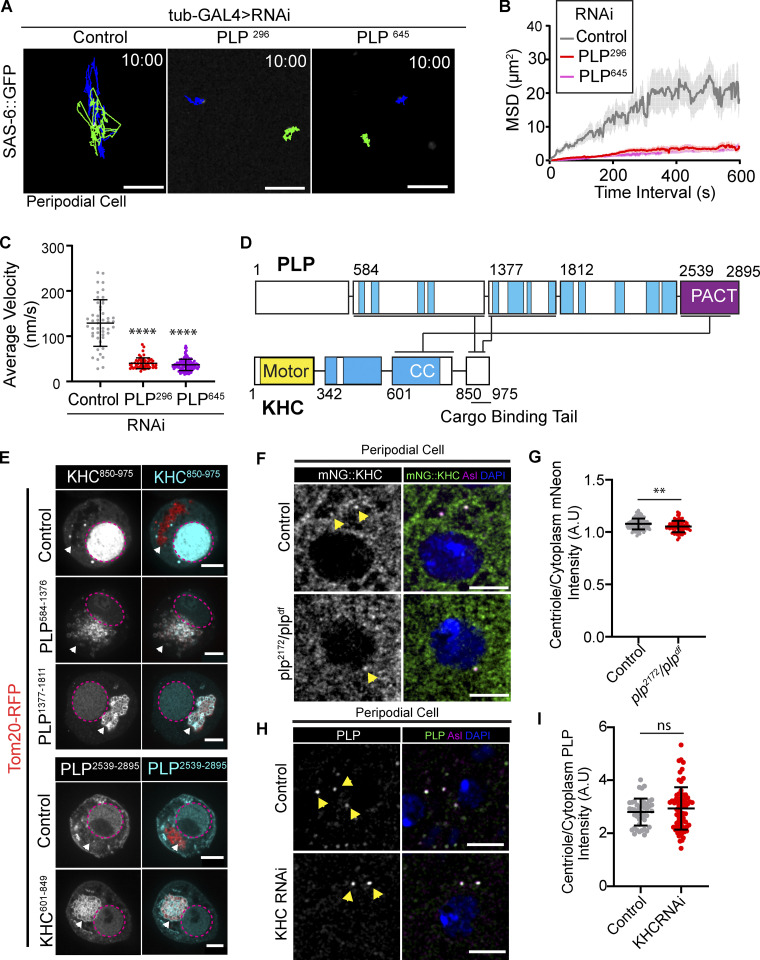
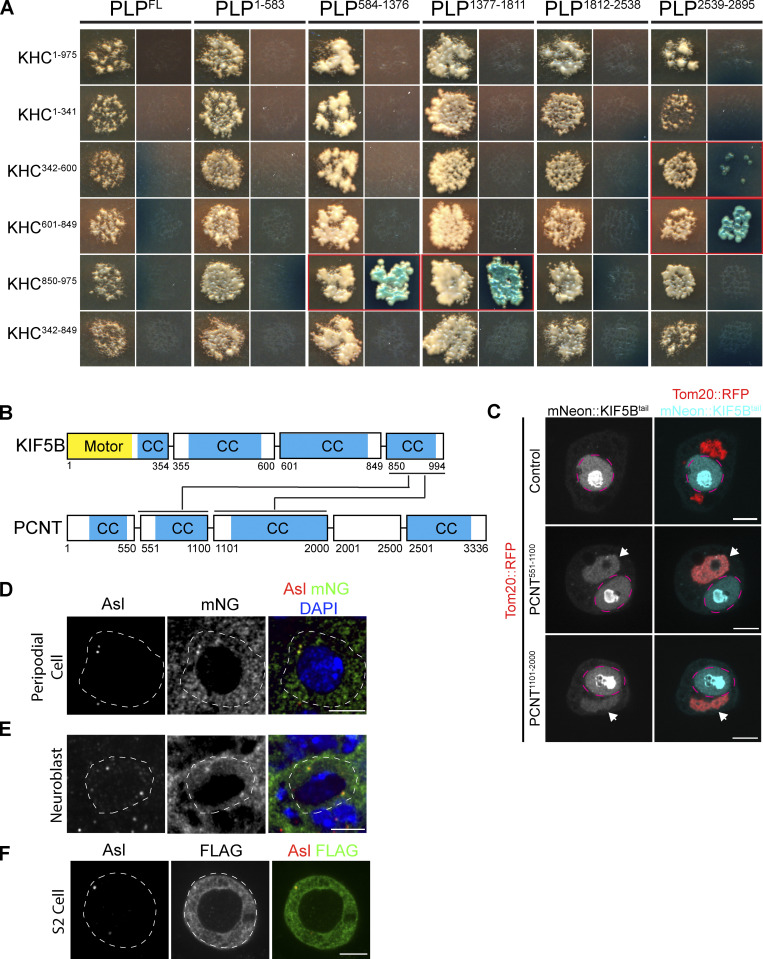
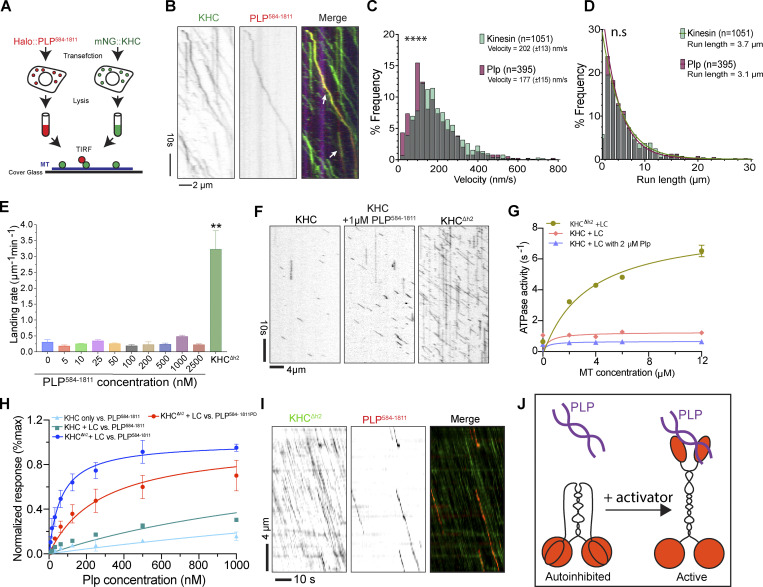
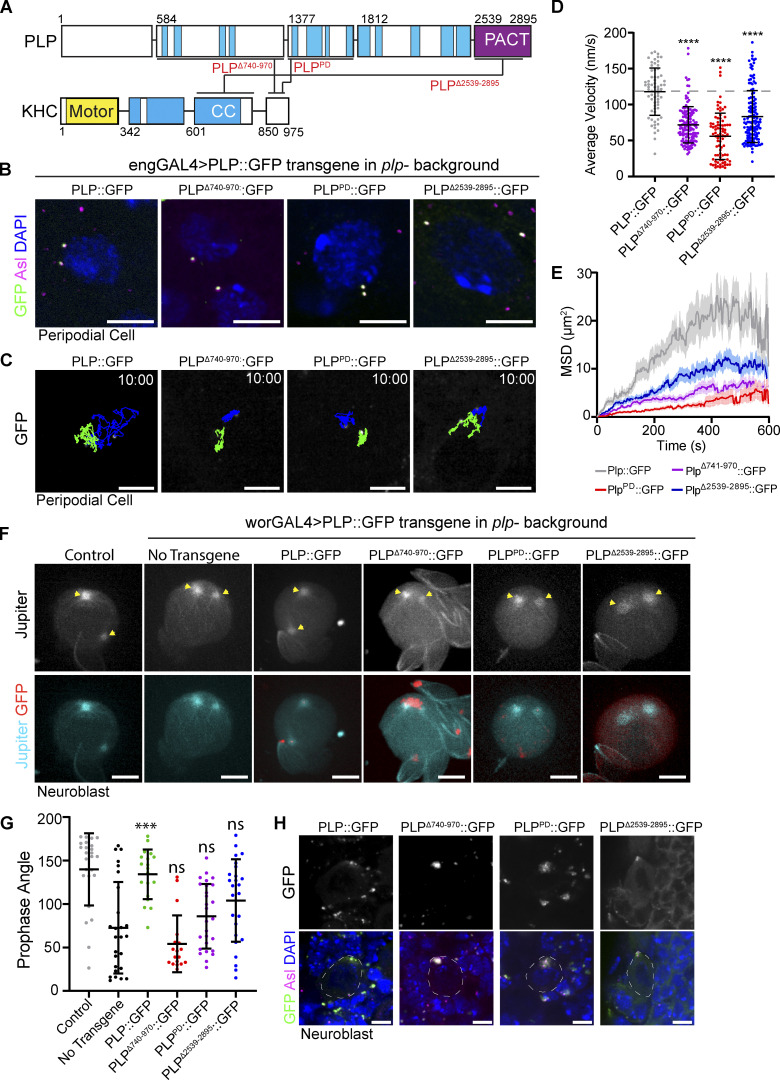
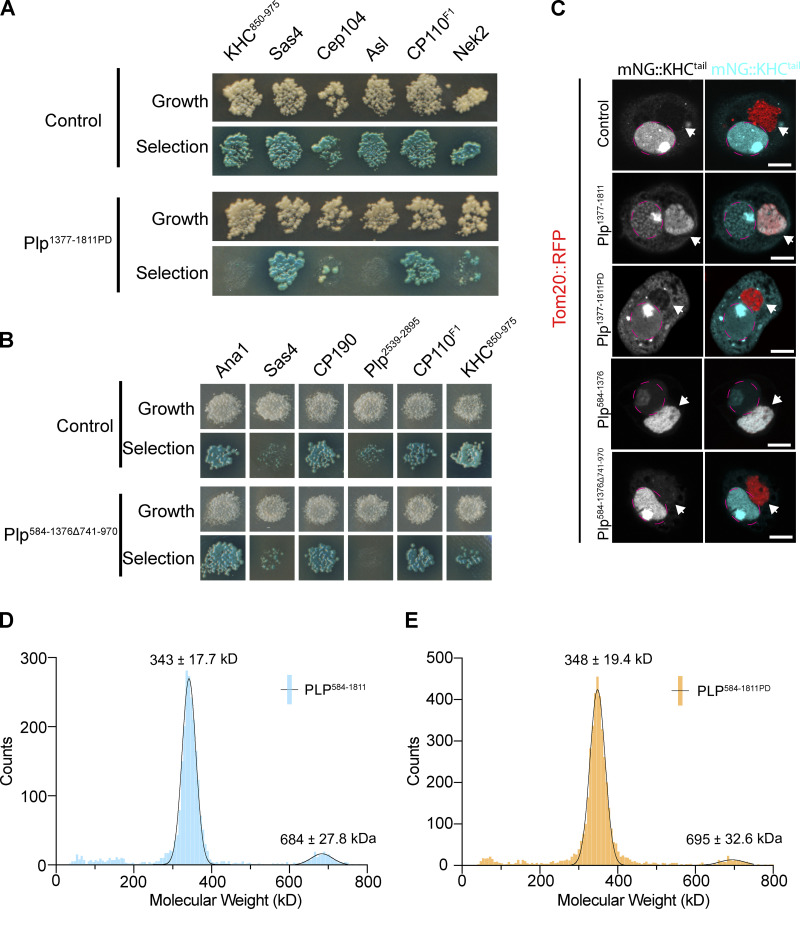
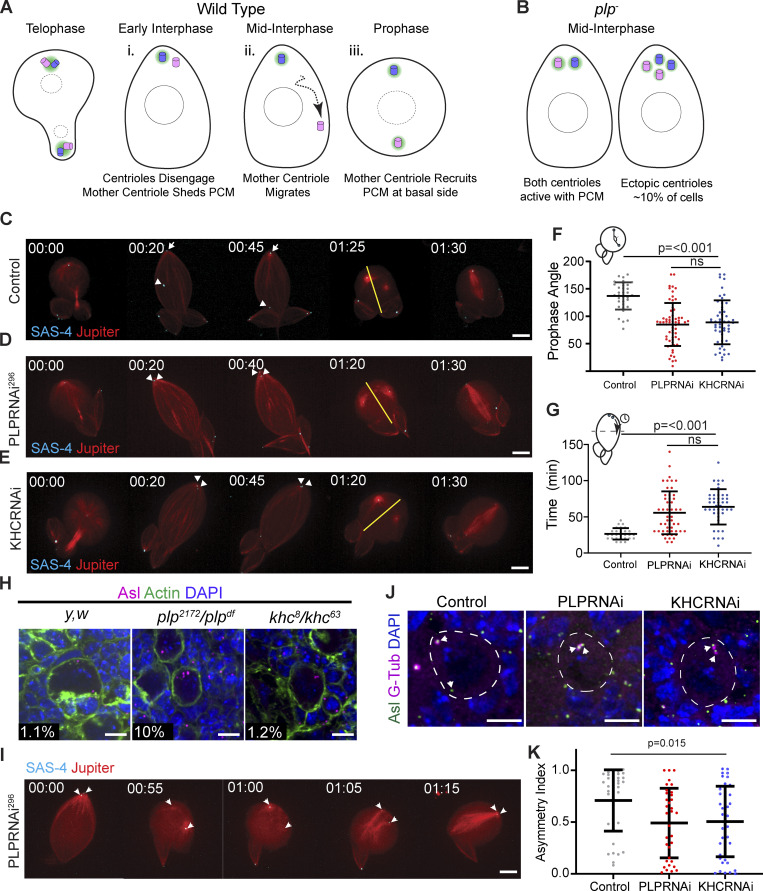
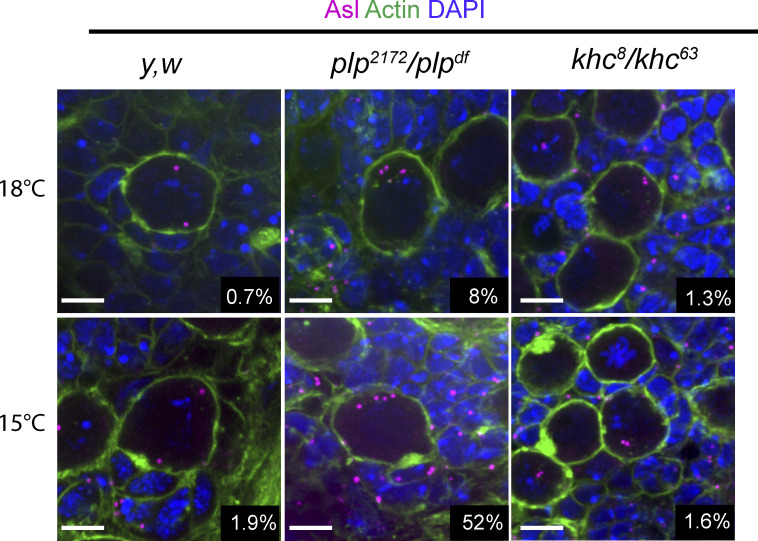
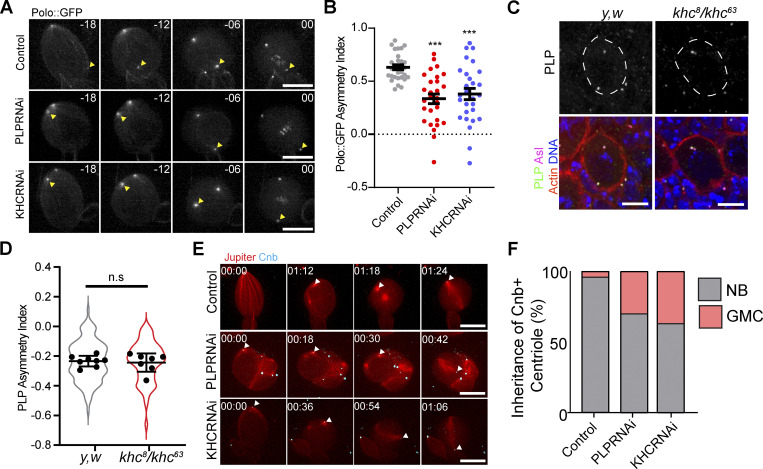
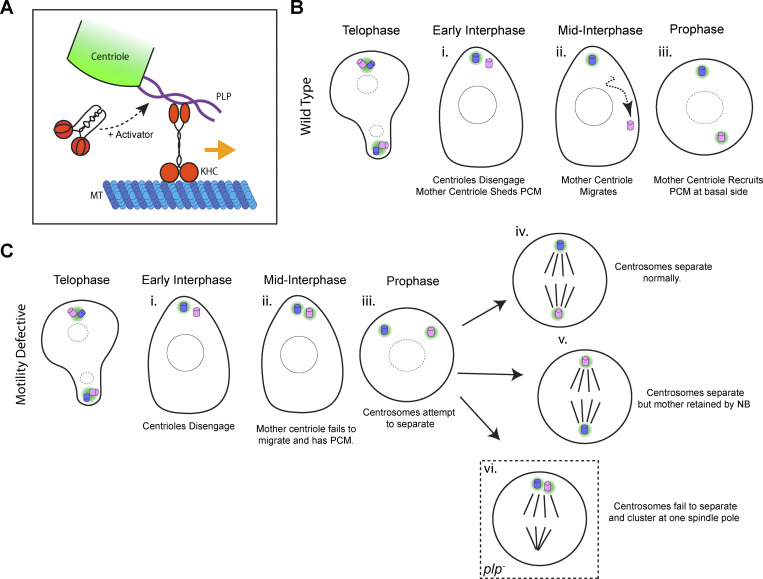
Centrosome positioning is essential for their function. Typically, centrosomes are transported to various cellular locations through the interaction of centrosomal microtubules (MTs) with motor proteins anchored at the cortex or the nuclear surface. However, it remains unknown how centrioles migrate in cellular contexts in which they do not nucleate MTs. Here, we demonstrate that during interphase, inactive centrioles move directly along the interphase MT network as Kinesin-1 cargo. We identify Pericentrin-Like-Protein (PLP) as a novel Kinesin-1 interacting molecule essential for centriole motility. In vitro assays show that PLP directly interacts with the cargo binding domain of Kinesin-1, allowing PLP to migrate on MTs. Binding assays using purified proteins revealed that relief of Kinesin-1 autoinhibition is critical for its interaction with PLP. Finally, our studies of neural stem cell asymmetric divisions in the Drosophila brain show that the PLP-Kinesin-1 interaction is essential for the timely separation of centrioles, the asymmetry of centrosome activity, and the age-dependent centrosome inheritance.


Figures

Figure 1.
Figure 1.
Drosophila centrioles are motile in interphase cells. (A) Z-stack projection of an interphase NB expressing Jupiter::mCherry (red) and mNG::SAS-4 (cyan). The mother centriole (asterisk) remains closely associated with the apical cell cortex; the daughter centriole (arrow) moves throughout the cell. (B) Cultured S2 cell transfected with F-tractin::mCherry (red) to visualize the cell and mNG::PACT (cyan) to label centrioles. Both centrioles are highly motile through the acquisition. (C) Peripodial cell expressing Lifeact::RFP (red) to visualize the cell and GFP::SAS-6 (cyan) labelling the centrioles. Both centrioles are highly motile within the cell. Last columns in A, B, and C show cell outline (white line) and 10-min time projections of centriole movement (green and blue lines). (D) Fixed NB showing that Cnn (green) is restricted to one of the two centrioles (magenta). (E and F) Fixed S2 cell (E) and peripodial cell (F) showing no Cnn (green) present on the centrioles (magenta). Scale bars: 5 µm; inset scale bars: 1 µm. Time stamp: mm:ss.
Figure S1.
Figure S1.
Centriole motility is independent of the Actin network and centrioles associate with the interphase MT cytoskeleton. (A) Z-stack projection of example PC’s labelled with Phalloidin showing that 10 µM Latrunculin-A treatment destroys the Actin network. Scale bars: 10 μm. (B) Tracks showing the movement of centrioles over a 10-min period. Latrunculin-A treatment does not inhibit centriole motility in peripodial cells. Scale bars: 5 μm. (C) Quantification of average velocity. (DMSO: 117.6 nm/s ± 34, n = 126, Lat-A: 123.5 nm/s ± 41, n = 140. Data = mean ± SD. Unpaired, two tailed, t test: P = 0.19). (D) Mean squared displacement is not affected by Latrunculin A treatment. Data = Mean ± SD (D) Timelapse series of an S2 cell labelled with SiR-Tubulin. Arrowhead denotes brighter spot corresponding to the centriole moving along the MT network. Scale bar: 2 μm. (E) Projection of a live S2 cell transfected with PACT::GFP to label the centriole (magenta). Centriolar signal is coincident with bright accumulation of SiR-Tubulin (green). Scale bar: 10 μm, inset: 1 μm. (F) Live PC expressing SAS-4::GFP (centriole, magenta) and labelled with SiR tubulin (green). SiR tubulin accumulation corresponds to SAS-4 positive centrioles. Scale bar: 5 μm; inset: 1 μm.
Figure 2.
Figure 2.
Interphase motility is dependent on intact MT networks. (A) Peripodial cells following 1 h ice treatment followed by recovery in DMSO or 50 µM Colcemid. Note: no visible MTs remaining in the Colcemid treated wing disc. (B) 10-min time projection of centriole movement (colored tracks). Centrioles are not motile following ice treatment and Colcemid recovery. (C and D) Colchicine treatment does not destroy the pre-existing MT network (C) but does block MT dynamics revealed by EB-1 localization (D). (E) 10-min time projections of centriole movement (colored tracks). Centrioles remain highly motile following Colchicine treatment. (F) Quantification of instantaneous velocity in the indicated conditions (ice + DMSO: 117 ± 8.1 n = 6 wing discs, 95 centrioles. ice + Colcemid: 20.7 ± 2.8, n = 7 wing discs, 158 centrioles. DMSO: 115.5 ± 7.4, n = 4 wing discs, 78 centrioles. Colchicine: 77.9 ± 13.2, n = 7 wing discs, 109 centrioles). Data = mean ± SD, P values derived from unpaired t test. (G) Average mean squared displacement of centrioles. Scale bars: 5 µm. Time stamp: mm:ss.
Figure 3.
Figure 3.
Centrioles are MT cargo. (A and B) Super-resolution imaging reveals a close relationship between centrioles (PLP; red) and MTs (gray) in PCs (A) and NBs (B). Scale bars: 5 µm; inset 1 µm. (C and D) Centrioles (cyan) move on the MTs (red) in PCs (C) and NBs (D). Scale bar: 2 µm. Fluorescence transgenes are as indicated on left. (E) PCs treated with SiR-Tubulin showing centrioles (arrowheads) moving along MTs and switching tracks. Scale bar: 2 µm. Time stamp: mm:ss.
Figure 4.
Figure 4.
Kinesin-1 is required for efficient centriole motility. (A) 10-min time projections of centriole movement (colored tracks) in the indicated knockdown conditions in PCs. Scale bars: 5 µm. (B) Average velocity is significantly reduced following the knockdown of Kinesin-1 components (control: 112 ± 20, n = 3 wing discs, 100 centrioles. KHCRNAi: 71 ± 5, n = 3 wing discs, 110 centrioles. KLCRNAi: 92 ± 5, n = 4 wing discs, 97 centrioles. EnsRNAi: 83 ± 8, n = 6 wing discs, 84 centrioles; data = mean ± SD. ANOVA P = 0.001, Dunnett’s pairwise comparisons: Ctrl vs. KHCRNAi P = 0.0005, ***, Ctrl vs KLCRNAi P = 0.043, *, Ctrl vs. EnsRNAi P = 0.0027, **). (C) Mean squared displacement is reduced following KHC knockdown in PCs. (D) Diagram summarizing the models by which Kinesin-1 could move centrioles in cells. Kinesin-1 cargo domain is shown in yellow; motor domain (orange) always walks toward the indicated + sign, and the black arrow indicates the movement direction of the centriole. (E) Z-stack projections of fixed NBs sowing centriole positioning. Note: in khc8/khc63 NBs, the centrioles are adjacent to the apical side of the cell. (F) Quantification of the percentage of neuroblasts with adjacent apical centrioles. y,w: 17.8% ± 7, n = 5 brains; khc8/khc63: 92.5% ± 3, n = 4 brains, khcmut.A: 17.4% ± 3.5, n = 4 brains. Data = mean ± SD. (G) Averaged OMX-SIM micrograph showing mNG::KHC localizes to the outer centriole edge. Scale bar: 500 nm. (H) Quantification of rotational averaged centrioles showing the distribution of mNG::KHC relative to PLP and RFP::SAS-6 (n = 4).
Figure 5.
Figure 5.
PLP is essential for centriole motility and interacts with KHC. (A) 10-min time projections of centriole movement (colored tracks) in PCs following knockdown of PLP with tub-GAL4. Scale bars: 5 µm. (B and C) Quantification of mean squared displacement (B) and average velocity (C) following PLP knockdown (control average velocity = 128.8 nm/s ± 51.48, n = 49; PLPRNAi296 = 40.19 nm/s ±12.04, n = 54; PLPRNAi645 = 36.6 nm/s ±12.48, n = 112, data = mean ± SD, ANOVA: P = <0.0001, Dunnett’s pairwise comparison P = 0.0001 between Ctrl and RNAi conditions, ****). (D) Diagram showing the three independent interactions (black lines) found through yeast two-hybrid screening of PLP and KHC subfragments (Fig. S4). Blue = predicted coiled coils. Yellow = KHC motor domain. The PACT domain of PLP is located in the final C-terminal fragment (purple). (E) Mitochondrial recruitment assay validating interactions found through Y2H. Prey fragments (gray/cyan) accumulate in nucleus (magenta dashed line). In the presence of a co-transfected bait fragments (red, arrowhead) that is targeted to the mitochondria via a Tom20-RFP tag, a positive interacting fragment (gray/cyan) is also recruited to the mitochondria. (F) Examples showing mNG::KHC (green) localization in control or plp PCs. Yellow arrowheads indicated centriolar localization determined by Asterless staining (magenta). Blue = nucleus. (G) Quantification of mNG::KHC localization determined by the mean intensity at the centriole divided by mean cytoplasmic intensity. Mean ± SD: Control = 1.078 ± 0.05, n = 116 centrioles; plp2172/Df = 1.05 ± 0.06, n = 69 centrioles, unpaired t test: P = 0.003, **. (H) Examples showing endogenous PLP (green) localization in control or KHCRNAi expressing PCs. Yellow arrowheads indicated centriolar localization determined by Asterless staining (magenta). Blue = nucleus. (I) Quantification of PLP localization determined by the mean intensity at the centriole divided by mean cytoplasmic intensity. Mean ± SD: Control = 2.8 ± 0.5, n = 44 centrioles; KHCRNAi = 2.9 ± 0.8, n = 71 centrioles, unpaired t test: P = 0.3, ns.
Figure S2.
Figure S2.
PLP knockdown does not cause precocious centriole activation in PCs. (A) Fixed PCs stained for Asl (red), Cnn (cyan), and Gamma-tubulin (green) shows that PCM does not accumulate in PLPRNAi expressing PCs. (B) Quantification of Centrosomin intensity relative to cytoplasm (Control: 1.16 ± 0.05 n = 7 wing discs, 67 centrioles; PLPRNAi296: 1.1 ± 0.05, n = 8 wing discs, 91 centrioles; PLPRNAi645: 1.1 ± 0.05, n = 8 wing discs, 86 centrioles. Mean ± SD. ANOVA: P = 0.003. Dunnett’s multiple comparison: Control vs PLPRNAi296: P = 0.0035, Control vs PLPRNAi645: P = 0.0065). (C) Quantification of Gamma Tubulin intensity relative to cytoplasm (Control: 1.15 ± 0.05 n = 7 wing discs, 67 centrioles; PLPRNAi296: 1.1 ± 0.04, n = 8 wing discs, 91 centrioles; PLPRNAi645: 1.2 ± 0.06, n = 8 wing discs, 86 centrioles. ANOVA: P = 0.01, multi-comparison test showed no significance between Control and RNAi groups. Mean ± SD). (D) Fixed mitotic wing disc cells stained for Asl (red), Cnn (cyan), and Gamma-tubulin (green). PLP knockdown does not prevent PCM accumulation in mitosis. But PCM can appear disorganized. Scale bars: 1 µm.
Figure S3.
Figure S3.
PLPKinesin-1 interaction is conserved. (A) Images of mated yeast clones. For each PLP fragment, the left column is DDO plates to select for both bait and prey. Right column is QDOXA plates to select for interaction. Red outlined clones indicate a positive interaction, identified by the growth of blue yeast colonies. (B) Diagram illustrating interactions identified between human KIF5B and PCNT fragments, predicted coiled coils are highlighted in blue (CC). (C) Example images of S2 cells in which fragments of PCNT (Red) have been targeted to the mitochondria by a Tom20 mitochondrial targeting sequence. The KIF5B tail (aa850-994) was tagged with mNeonGreen. Note that KIF5B is only recruited to mitochondria in the presence of PCNT fragments (arrow heads) indicative of interaction. mNeon::KIF5B also accumulated in the nucleus (magenta dashed line). (D) Representative image of a peripodial cell expressing mNG::KHC. Note mNG signal (green) coincident with the centriole marker Asterless (red). (E) Representative image of an interphase NB expressing mNG::KHC. mNG::KHC localizes to both the apical and the basal centriole. (F) Representative image of an S2 cell expressing FLAG::KHC stained for FLAG and Asterless. Scale bar: 5 μm.
Figure 6.
Figure 6.
In vitro analysis of KHC motility. (A) Diagram of in vitro motility experiment. mNG::KHC (red) and Halo::PLP584-1811 (green) were transfected into S2 cells. Cleared lysate was then flowed onto MTs (blue) for TIRF analysis. (B) Co-migration of mNG-KHC (green) with Halo-PLP584-1811 (red) on HiLyte-647 MTs (blue). (C) Velocities of KHC motors and PLP584-1811 cargos on MTs. Kinesin mean velocity = 202 (± 113, SD) nm/s (n = 1,051). PLP584-1811 mean velocity = 177 (± 115, SD) nm/s (n = 395). Mann-Whitney test P value = <0.0001, ****. (D) Characteristic run lengths of KHC motors and PLP584-1811 cargo. PLP584-1811 run length = 3.1 μm, (n = 1,051). KHC run length = 3.7 μm (n = 395). Mann-Whitney test P value = 0.08, ns. (E) Quantification of the landing rates of 25 nM KHC + LC with PLP584-1811 at indicated concentrations in comparison with that of 25 nM KHCΔh2 + LC. Error bars represent the SD of landing rates determined from three or four independent movies. For each condition, several thousand landing events were quantified on a total MT length of several millimeters. Unpaired, two tailed t test P value = <0.001 (**), KHCΔh2 + LC vs. KHC + LC + PLP (at varying concentrations). (F) Kymographs showing landing and movement of KHC on MTs in the absence and presence of PLP and compared with the activated KHCΔh2. (G) Steady-state ATPase activities of different Kinesin-1 constructs in the presence or absence of 2 μM PLP584-1811 as a function of MT concentration. Data were presented as mean ± SD and fitted with Michaelis-Menten kinetics. N = 3 independent titrations. (H) Steady-state analysis of Kinesin-1 to PLP binding affinity using biolayer interferometry (BLI). KHC, KHC + LC, or KHCΔh2 + LC were loaded onto the biosensors and exposed to WT PLP584-1811 or PLP584-1811PD mutant at the indicated concentrations. BLI signals at equilibrium were plotted against PLP concentrations, and dissociation constant (Kd) were determined by fitting the data with nonlinear regression single-site binding: WT PLP584-1811 vs. KHC, 4.4 μM; vs. KHC + LC, 1.7 μM; vs. KHCΔh2 + LC, 65 nM; PLPPD vs. KHCΔh2 + LC, 281 nM. (I) Kymograph analysis showing events of PLP584-1811 comigrating with KHCΔh2 + LC. (J) Diagram highlighting how the interaction between the motor domain and cargo binding tail could inhibit PLP interaction.
Figure 7.
Figure 7.
PLPKHC interaction mutants show reduced centriole motility. (A) Schematic showing the interactions between PLP and KHC and the corresponding interaction mutations (red text). (B) Example projections of PCs showing PLP transgenes (green) localizing centrioles (Asterless; magenta). DNA (blue) shows cells are in interphase. (C) 10-min time projections of centriole movement (colored tracks) in PCs expressing the indicated PLP transgenes in a mutant background (plp2172/Df(3L)Brd15). (D) Rescue with the mutant transgenes results in a significantly slower instantaneous velocity compared to full length rescue (PLP::GFP: 117 ± 32, n = 66. PLPΔ740-971::GFP: 71 ± 25, n = 83. PLPPD::GFP: 55 ± 32, n = 138, PLPΔ2539-2895::GFP: 83 ± 36 n = 139, ANOVA: ****P = <0.0001, Dunnett’s pairwise comparison between PLP::GFP and all other conditions). Data = mean ± SD. (E) Mean squared displacement shows motility is most effected by mutations (PLPPD and PLPΔ740-971) that interfere with interaction between PLP and the cargo binding tail of KHC. (F) Maximum intensity projections from live NBs showing the position of the MTOCs (yellow arrows; Jupiter::RFP) in prophase. Cells are expressing the indicated PLP transgene in a PLP mutant background (plp2172/Df(3L)Brd15). (G) The angle of the centrosomes relative to the nucleus in prophase is not significantly rescued by the transgenes that block PLP–KHC interaction (Control: 139° ± 41.4, n = 25. No Transgene: 72° ± 52, n = 26. PLP::GFP: 134° ± 28, n = 19, P = <0.0001. PLPΔ740-971::GFP: 54° ± 32.7, n = 18, P = 0.69. PLPPD::GFP: 85.8° ± 37, n = 27, P = 0.86. PLPΔ2539-2895::GFP: 104 ± 47.5, n = 25, P = 0.08. P values determined by Tukey pairwise comparison between no transgene and PLP rescue conditions). Data = mean ± SD. (H) Maximum projections showing the localization of the indicated transgenes in interphase NBs. Scale bars: 5 µm. Time stamp: mm:ss.
Figure S4.
Figure S4.
Disrupting the PLPKinesin-1 interaction. (A) Yeast clones showing the PLP interactions disrupted by the PLPPD mutation. Note that Asl interaction is also disrupted. Interaction was determined by the growth of blue clones on the selection plate (QDOXA). (B) Yeast clones showing the interactions disrupted by deletion of PLP aa741-970. The interaction with KHC850-975 appears weaker due to decreased growth. Note interaction with PLP2539-2895 is also disrupted. (C) Validation of PLP–KHC interaction mutants by mitochondrial targeting assay. PLP fragments were targeted to the mitochondria using the Tom20 mitochondrial localization sequence (red). The cargo binding tail of KHC (KHC850-975) was tagged with mNeon. Interaction was determined by recruitment of mNeon::KHC850-975 to the mitochondria. (Arrowheads point to mitochondria; magenta dashed line labels the nuclei.) (D and E) Histograms of single particle mass values determined by mass photometry for HALO::PLP584-1811: WT and PD mutant, respectively. Lines are the Gaussian fit to the data yielding the molecular weights, consistent with a predominant dimer (346 kD) and a minor tetramer (692 kD) species of PLP. Scale bars: 5 µm.
Figure 8.
Figure 8.
Comparison of PLP and KHC loss of function in NBs. (A i–iii) Schematic of centrosome asymmetry in a wild-type NB. (i) Mother centriole (pink) sheds PCM (green). (ii) Mother centriole migrates to the basal side. (iii) Mother centriole recruits PCM in the following prophase. (B) Schematic showing the main phenotypes in plp mutants: Centrioles do not migrate away from the apical domain, mother centriole retains PCM, some NBs inherit supernumerary centrioles. (C–E) Live imaging of NBs expressing the centriole marker mNG::SAS-4 (cyan, arrows) and the MT marker Jupiter::mCherry (red). The apical daughter centriole is indicated in control NB (arrow), metaphase spindle axis is indicated by yellow line. Unlike controls (C), centrioles do not migrate away from the apical cortex following PLP (D) or KHC (E) knockdown. (F) The angle between the two centrosomes is significantly reduced at prophase following PLP or KHC knockdown (Control angle: 137 ± 25, n = 34. PLPRNAi angle: 84.98 ± 39, n = 62. KHC RNAi angle: 88.94 ± 40, n = 52; data = mean ± SD; ANOVA P = <0.0001, Tukey multiple comparison: P = <0.0001 between Control and RNAi conditions), ns = not significant. (G) The time taken for one centriole to cross the cell midline (equator) is significantly increased following PLP or KHC knockdown compared to controls (Control separation time: 26.43 ± 8, n = 28. PLPRNAi separation time: 55.65 ± 29.7, n = 54. KHCRNAi separation time: 63.84 ± 24.4, n = 43; data = mean ± SD; ANOVA P = <0.0001, Tukey multiple comparison: P = 0.001 between Control and RNAi conditions). (H) Representative NBs showing supernumerary centrioles are present in plp (plp2171/df(3L) Brd15, 10%, n = 258 NBs, four brains) mutants but not in control (y,w, 1.1%, n = 229 NBs, four brains) or khc (khc8/khc63, 1.15%, n = 195 NBs, four brains) mutants. Numbers represent percentage of cells carrying >2 centrioles as determined by Asl puncta (magenta) (I) Time series showing supernumerary centrioles following plp loss of function arise from a failure of centrosomes to separate in prophase. (J) Fixed neuroblasts showing Gamma-Tubulin (magenta) associates with both centrioles (green) following PLP or KHC knockdown. (K) Quantification of the asymmetric index showing a significant reduction in gamma tubulin asymmetry in PLP or KHC knockdown (Control ASI: 0.7 ± 0.29, n = 37. PLPRNAi ASI: 0.49 ± 0.33, n = 34. KHCRNAi ASI: 0.5 ± 0.37, n = 46; ANOVA: P = <0.0001, Tukey pairwise comparison: P = <0.0001 between Control and all other conditions). Data = mean ± SD. Scale bars: 5 µm.
Figure S5.
Figure S5.
Increased supernumerary centrioles at low temperature is only observed in plp mutant NBs. Fixed NBs stained for Asterless (Asl, magenta) to label centrioles, Phalloidin (green), and DAPI (blue). Centrioles were counted by counting the number of Asl positive puncta in each cell. Raising flies in lower temperatures only increased in the percentage of NBs carrying more than two Asl puncta in plp mutants (plp2172/plpdf). 18°C: Control = 0.7% ± 0.8 (n = 4 brains, 230 NBs), plp = 8.8% ± 3.6 (n = 4 brains, 330 NBs), khc = 1.3% ± 2.7 (n = 4 brains 235 NBs). 15°C: Control = 1.9% ± 1.5 (n = 4 brains, 205 NBs), plp = 52% ± 6.7 (n = 4 brains, 161 NBs), khc = 1.6% ± 2.3 (n = 4 brains, 197 NBs). Data = mean ± SD. Scale bars: 5 µm.
Figure 9.
Figure 9.
Loss of KHC or PLP causes early Polo exposure and defective age dependent centriole segregation. (A) Polo::GFP is recruited early to the ganglion mother cell (GMC) inherited centrosome (yellow arrowhead) in isolated NBs expressing KHC or PoloRNAi. (B) Quantification of Polo asymmetry ∼18 min before metaphase (Control ASI: 0.63 ± 0.12, n = 29. PLPRNAi ASI: 0.33 ± 0.24 n = 28, KHCRNAi ASI: 0.37 ± 0.28 n = 28, ANOVA: P < 0.0001, Tukey pairwise comparison: Control vs PLPRNAi P < 0.0001, Control vs. KHCRNAi P = 0.0002). Error bars = SEM. (C) Example projections from whole mount brains showing that PLP localization is not perturbed in khc mutants (khc8/khc63). (D) Quantification of PLP asymmetry in khc mutant NBs (Control ASI: −0.23 ± 0.03 n = 112 cells, eight brains. khc ASI: −0.024 ± 0.06 n = 123 cells, seven brains. Unpaired, two tailed, t test P = 0.7). Violins show ASI from all cells measured; points show averaged ASI per brain imaged. Errors bars = SD. (E) Isolated NBs expressing Cnb::GFP (cyan, arrowhead) to label the daughter centriole. In NBs also expressing KHC or PLP RNAi, the daughter centriole is more frequently segregated into the GMC. (F) Quantification of Cnb::GFP + centriole inheritance (% Cnb + centriole inherited by NB: Ctrl: 96%, PLPRNAi: 74%, KHCRNAi: 63%, 40 NBs were imaged per condition). Scale bars: 10 µm.
Figure 10.
Figure 10.
Model. (A) Diagram showing proposed complex assembled on the outer centriole for transport. Kinesin-1 interacts with the central region of PLP (aa584-1811). A yet-to-be-identified activator relieves autoinhibition of the Kinesin heavy chain, thereby enhancing MT landing rate as well as PLP interaction. (B) Diagram illustrating the centriole cycle of asymmetrically dividing neuroblasts (Fig. 8 A). (C i–vi) Diagram showing the consequence of defective centriole motility on the centriole cycle. (i) In early interphase, the centrioles disengage but remain at the apical side of the cell (Fig. 8, C–E). (ii) In mid interphase, both centrioles remain at the apical side of the cell, and the mother centriole (normally inactive) recruits PCM (Fig. 8 J and Fig. 9 A). (iii) The consequence of this is that at prophase, both centrosomes are activated at the apical side of the cell. They attempt to separate via the prophase centrosome separation pathway (Fig. 8, C–E). (iv) In some cells, the prophase centrosome separation and spindle alignment machinery is able to rescue the defective motility, resulting in a normal division with the neuroblast retaining the daughter centrosome. (v) In ∼30% of cells, the prophase centrosome separation pathway is able to rescue the centrosome separation; however, the NB will retain the mother centrosome (Fig. 9, E and F). (vi) In plp neuroblast, some cells fail to separate the two centrosomes by the prophase centrosome separation pathway. In this case, both centrosomes cluster at one spindle pole (Fig. 8 I); this will result in supernumerary centrioles in the next cell cycle (Fig. 8 H).

Similar articles

Cited by

References

    1. Agircan, F.G., Schiebel E., and Mardin B.R.. 2014. Separate to operate: Control of centrosome positioning and separation. Philos. Trans. R. Soc B Biol. Sci. 369:20130461. 10.1098/rstb.2013.0461 - DOI - PMC - PubMed
    1. Ayloo, S., and Holzbaur E.L.F.. 2015. Reconstitution of microtubule-based motility using cell extracts. Methods Cell Biol. 128:57–68. 10.1016/bs.mcb.2015.02.002 - DOI - PubMed
    1. Azimzadeh, J., and Bornens M.. 2007. Structure and duplication of the centrosome. J. Cell Sci. 120:2139–2142. 10.1242/jcs.005231 - DOI - PubMed
    1. Bakhoum, S.F., and Cantley L.C.. 2018. The multifaceted role of chromosomal instability in cancer and its microenvironment. Cell. 174:1347–1360. 10.1016/j.cell.2018.08.027 - DOI - PMC - PubMed
    1. Blasius, T.L., Cai D., Jih G.T., Toret C.P., and Verhey K.J.. 2007. Two binding partners cooperate to activate the molecular motor Kinesin-1. J. Cell Biol. 176:11–17. 10.1083/jcb.200605099 - DOI - PMC - PubMed

Publication types